| Param | Original file | Final file |
|---|---|---|
| Filename | modeM0/AS1A09_095T02_9000003846_26590cztM0_level2.evt | modeM0/AS1A09_095T02_9000003846_26590cztM0_level2_quad_clean.evt |
| Size (bytes) | 589,449,600 | 101,534,400 |
| Size | 562.1 MB | 96.8 MB |
| Events in quadrant A | 3,162,083 | 694,858 |
| Events in quadrant B | 3,821,055 | 698,107 |
| Events in quadrant C | 3,538,414 | 657,413 |
| Events in quadrant D | 6,933,431 | 614,645 |
| Mode M9 | |||
|---|---|---|---|
| Quadrant | BADHDUFLAG | Total packets | Discarded packets |
| A | 0 | 13 | 0 |
| B | 0 | 13 | 0 |
| C | 0 | 13 | 0 |
| D | 0 | 13 | 0 |
| Mode M0 | |||
|---|---|---|---|
| Quadrant | BADHDUFLAG | Total packets | Discarded packets |
| A | 0 | 13000 | 0 |
| B | 0 | 15721 | 0 |
| C | 0 | 14256 | 0 |
| D | 0 | 24654 | 0 |
| Quadrant | Total seconds | Saturated seconds | Saturation percentage |
|---|---|---|---|
| A | 5863 | 66 | 1.125704% |
| B | 5863 | 91 | 1.552106% |
| C | 5863 | 144 | 2.456081% |
| D | 5863 | 915 | 15.606345% |
Noise dominated data is calculated using 1-second bins in cleaned event files. If a bin has >2000 counts, and if more than 50% of those come from <1% of pixels, then it is considered to be noise-dominated and hence unusable.
| Quadrant | # 1 sec bins | Bins with >0 counts | Bins with >2000 counts | High rate bins dominated by noise | Noise dominated (total time) | Noise dominated (detector-on time) | Marked lightcurve |
|---|---|---|---|---|---|---|---|
| A | 7193 | 5863 | 0 | 0 | 0.00% | 0.00% |  |
| B | 7193 | 5863 | 11 | 11 | 0.15% | 0.19% |  |
| C | 7193 | 5863 | 40 | 40 | 0.56% | 0.68% |  |
| D | 7193 | 5863 | 707 | 707 | 9.83% | 12.06% | 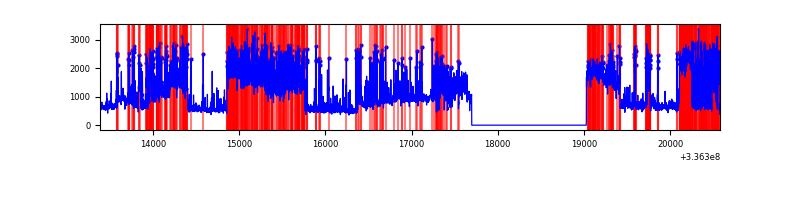 |
Top three noisy pixels from each quadrant. If the there are fewer than three noisy pixels in the level2.evt file, extra rows are filled as -1
| Pixel properties | Quadrant properties | ||||||
|---|---|---|---|---|---|---|---|
| Quadrant | DetID | PixID | Counts | Sigma | Mean | Median | Sigma |
| A | 5 | 168 | 20858 | 125.73 | 810 | 798 | 159.5 |
| A | 12 | 96 | 12827 | 75.39 | 810 | 798 | 159.5 |
| A | 13 | 254 | 9650 | 55.48 | 810 | 798 | 159.5 |
| B | 0 | 189 | 611370 | 4192.33 | 793 | 777 | 145.6 |
| B | 3 | 64 | 69092 | 469.05 | 793 | 777 | 145.6 |
| B | 5 | 172 | 25487 | 169.66 | 793 | 777 | 145.6 |
| C | 4 | 254 | 230950 | 1362.28 | 752 | 760 | 169.0 |
| C | 15 | 208 | 184258 | 1085.96 | 752 | 760 | 169.0 |
| C | 14 | 238 | 124965 | 735.06 | 752 | 760 | 169.0 |
| D | 7 | 80 | 3073966 | 17629.54 | 737 | 719 | 174.3 |
| D | 1 | 52 | 700795 | 4015.95 | 737 | 719 | 174.3 |
| D | 2 | 250 | 296672 | 1697.72 | 737 | 719 | 174.3 |
Histogram calculated using DETX and DETY for each event in the final _common_clean file
| Quadrant A | 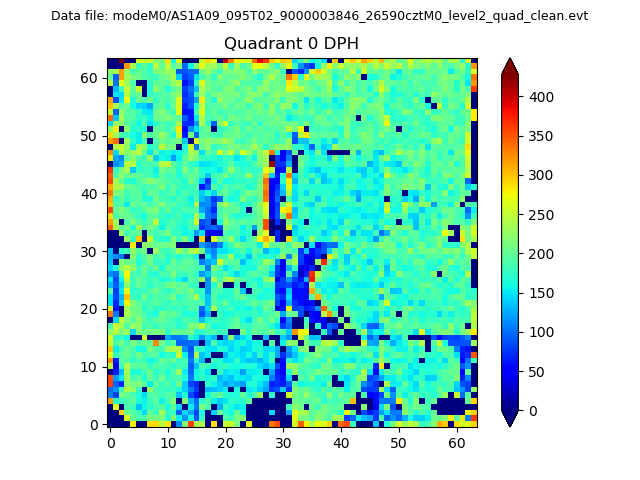 |
 |
Quadrant B |
|---|---|---|---|
| Quadrant D | 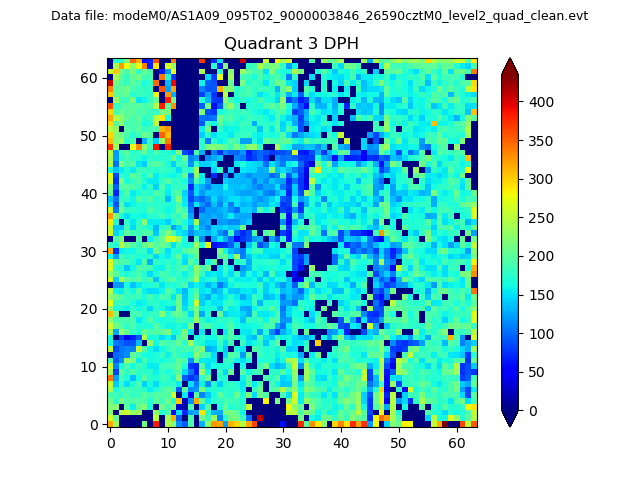 |
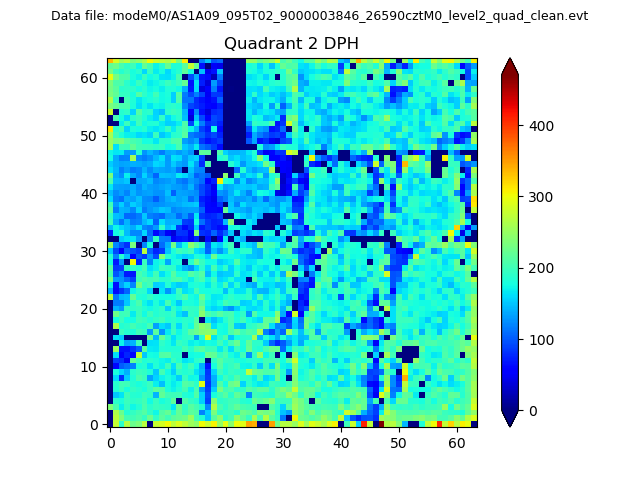 |
Quadrant C |
| Plot type | Count rate plots | Images |
|---|---|---|
| Comparison with Poisson distribution Blue bars denote a histogram of data divided into 1 sec bins. Red curve is a Poisson curve with rate = median count rate of data. |
 |
 |
| Quadrant-wise count rates Data is divided into 100 sec bins |
 |
|
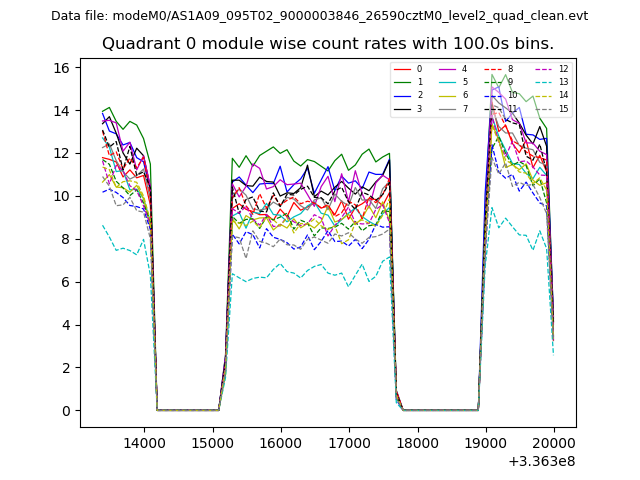
| Module-wise count rates for Quadrant A Data is divided into 100 sec bins |
 |
 |
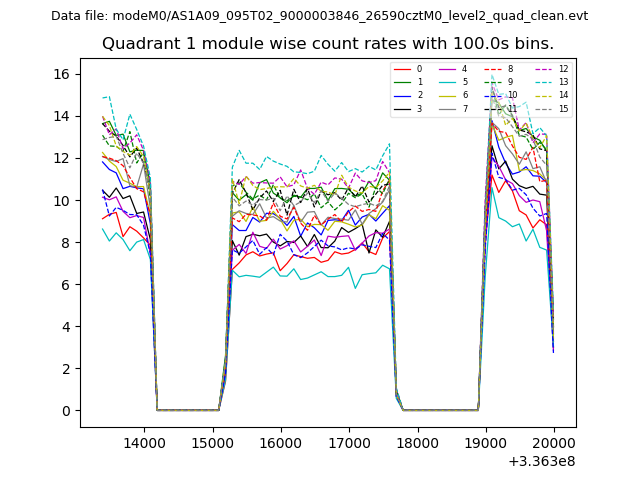
| Module-wise count rates for Quadrant B Data is divided into 100 sec bins |
 |
 |
| Module-wise count rates for Quadrant C Data is divided into 100 sec bins |
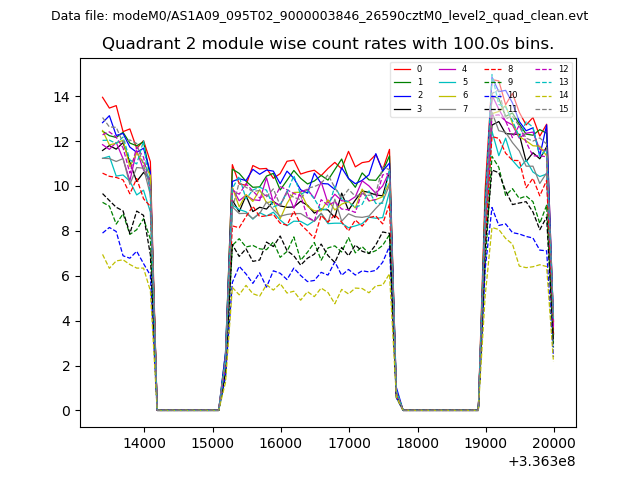 |
 |
| Module-wise count rates for Quadrant D Data is divided into 100 sec bins |
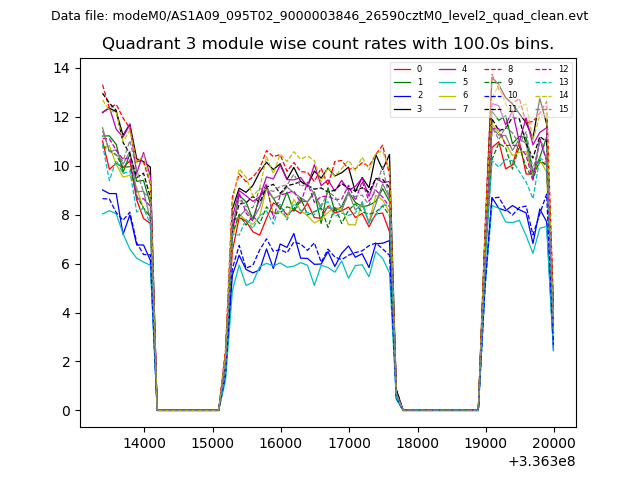 |
 |
| Parameter | Plot |
|---|---|
| CZT HV Monitor | 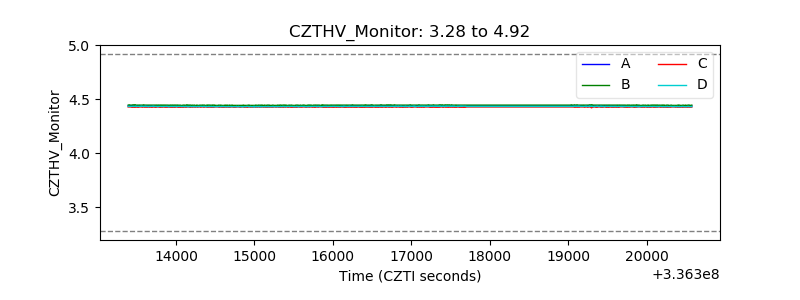 |
| D_VDD | 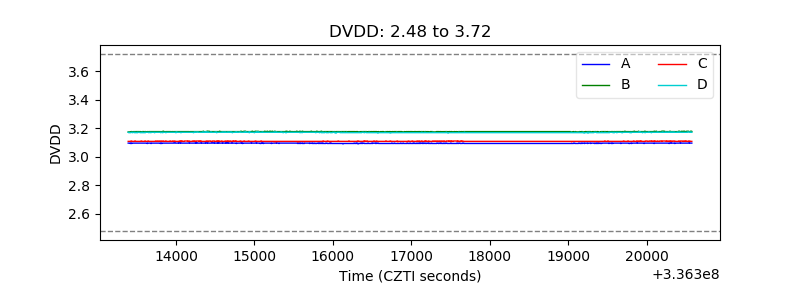 |
| Temperature 1 | 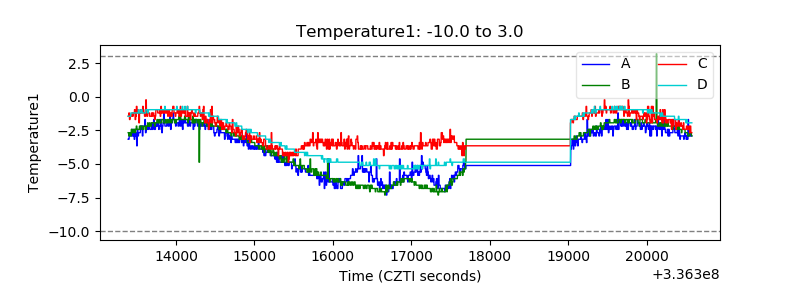 |
| Veto HV Monitor | 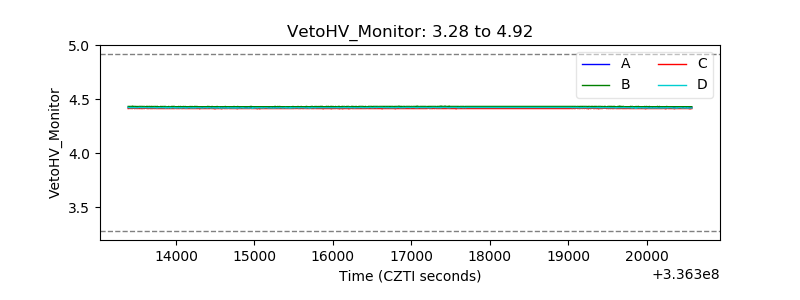 |
| Veto LLD | 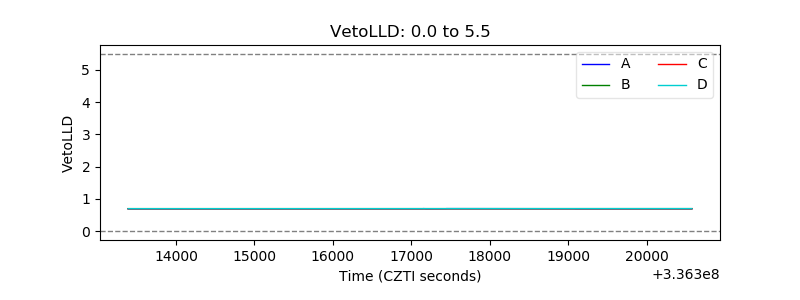 |
| Alpha Counter |  |
| _CPM_Rate |  |
| CZT Counter | 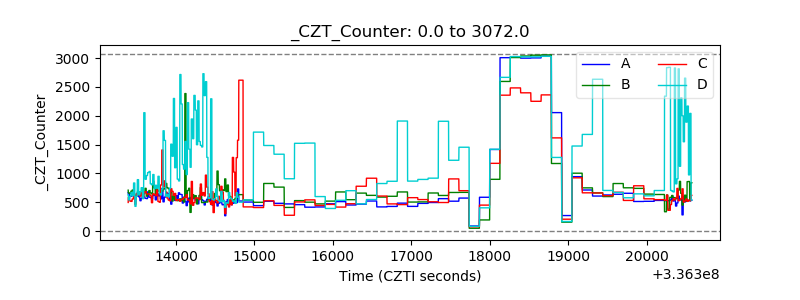 |
| +2.5 Volts monitor |  |
| +5 Volts monitor |  |
| _ROLL_ROT | 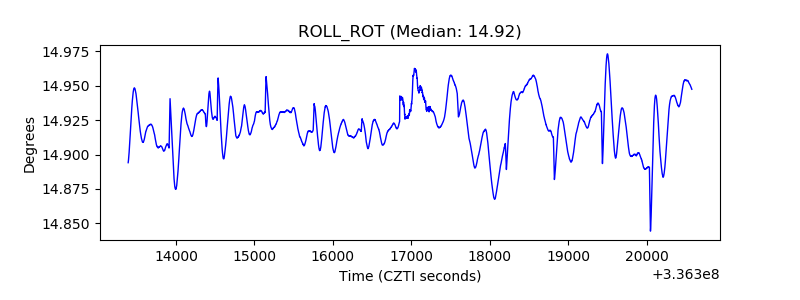 |
| _Roll_DEC | 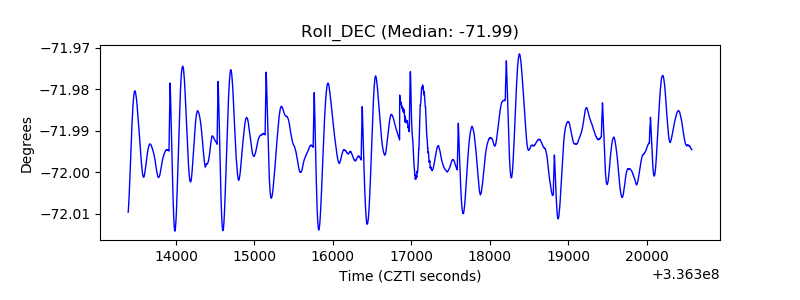 |
| _Roll_RA | 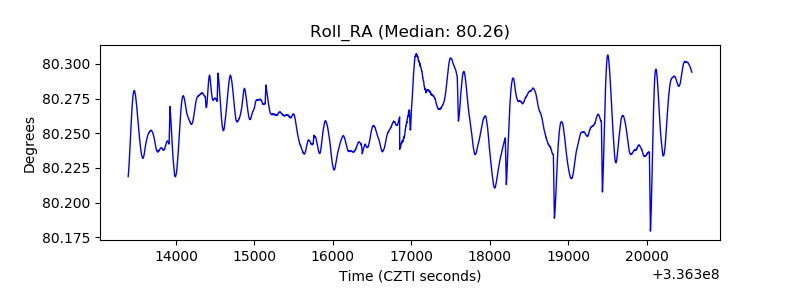 |
| Veto Counter | 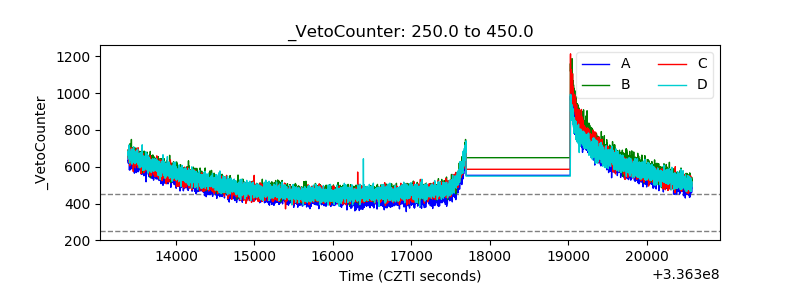 |