| Param | Original file | Final file |
|---|---|---|
| Filename | modeM0/AS1A09_095T02_9000003846_26591cztM0_level2.evt | modeM0/AS1A09_095T02_9000003846_26591cztM0_level2_quad_clean.evt |
| Size (bytes) | 528,595,200 | 85,956,480 |
| Size | 504.1 MB | 82.0 MB |
| Events in quadrant A | 2,950,449 | 576,154 |
| Events in quadrant B | 3,265,955 | 582,186 |
| Events in quadrant C | 3,145,555 | 545,053 |
| Events in quadrant D | 6,266,894 | 507,876 |
| Mode M9 | |||
|---|---|---|---|
| Quadrant | BADHDUFLAG | Total packets | Discarded packets |
| A | 0 | 13 | 0 |
| B | 0 | 13 | 0 |
| C | 0 | 13 | 0 |
| D | 0 | 13 | 0 |
| Mode M0 | |||
|---|---|---|---|
| Quadrant | BADHDUFLAG | Total packets | Discarded packets |
| A | 0 | 12076 | 0 |
| B | 0 | 13343 | 0 |
| C | 0 | 12734 | 0 |
| D | 0 | 22534 | 0 |
| Quadrant | Total seconds | Saturated seconds | Saturation percentage |
|---|---|---|---|
| A | 5603 | 105 | 1.873996% |
| B | 5604 | 139 | 2.480371% |
| C | 5604 | 158 | 2.819415% |
| D | 5604 | 1122 | 20.021413% |
Noise dominated data is calculated using 1-second bins in cleaned event files. If a bin has >2000 counts, and if more than 50% of those come from <1% of pixels, then it is considered to be noise-dominated and hence unusable.
| Quadrant | # 1 sec bins | Bins with >0 counts | Bins with >2000 counts | High rate bins dominated by noise | Noise dominated (total time) | Noise dominated (detector-on time) | Marked lightcurve |
|---|---|---|---|---|---|---|---|
| A | 6893 | 5603 | 0 | 0 | 0.00% | 0.00% | 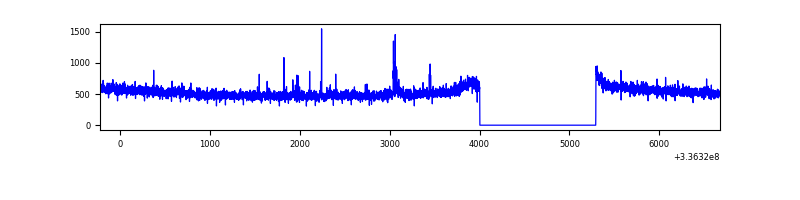 |
| B | 6894 | 5604 | 20 | 20 | 0.29% | 0.36% | 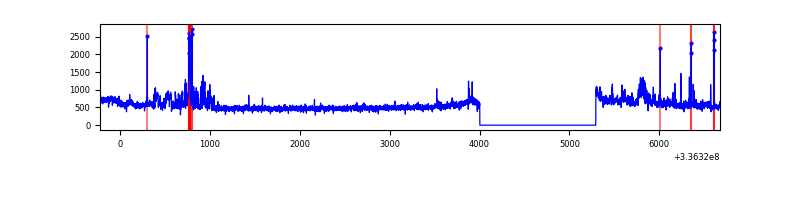 |
| C | 6894 | 5604 | 12 | 12 | 0.17% | 0.21% | 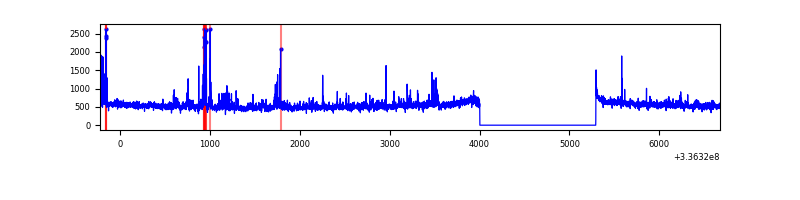 |
| D | 6894 | 5604 | 993 | 993 | 14.40% | 17.72% | 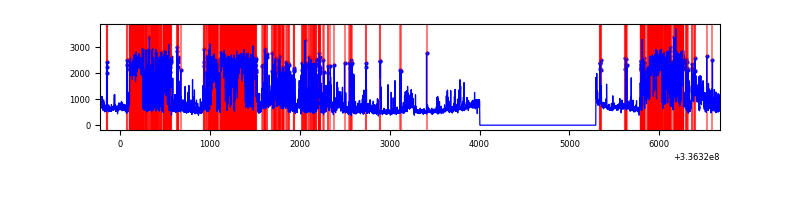 |
Top three noisy pixels from each quadrant. If the there are fewer than three noisy pixels in the level2.evt file, extra rows are filled as -1
| Pixel properties | Quadrant properties | ||||||
|---|---|---|---|---|---|---|---|
| Quadrant | DetID | PixID | Counts | Sigma | Mean | Median | Sigma |
| A | 12 | 96 | 29166 | 193.4 | 750 | 738 | 147.0 |
| A | 5 | 168 | 18132 | 118.34 | 750 | 738 | 147.0 |
| A | 0 | 13 | 11599 | 73.89 | 750 | 738 | 147.0 |
| B | 0 | 189 | 149558 | 1086.87 | 740 | 724 | 136.9 |
| B | 15 | 33 | 105551 | 765.51 | 740 | 724 | 136.9 |
| B | 5 | 172 | 61748 | 445.63 | 740 | 724 | 136.9 |
| C | 3 | 233 | 198034 | 1227.0 | 703 | 711 | 160.8 |
| C | 14 | 238 | 115712 | 715.1 | 703 | 711 | 160.8 |
| C | 15 | 208 | 87706 | 540.95 | 703 | 711 | 160.8 |
| D | 7 | 80 | 1484726 | 9167.92 | 665 | 648 | 161.9 |
| D | 2 | 250 | 1020044 | 6297.34 | 665 | 648 | 161.9 |
| D | 1 | 52 | 893485 | 5515.52 | 665 | 648 | 161.9 |
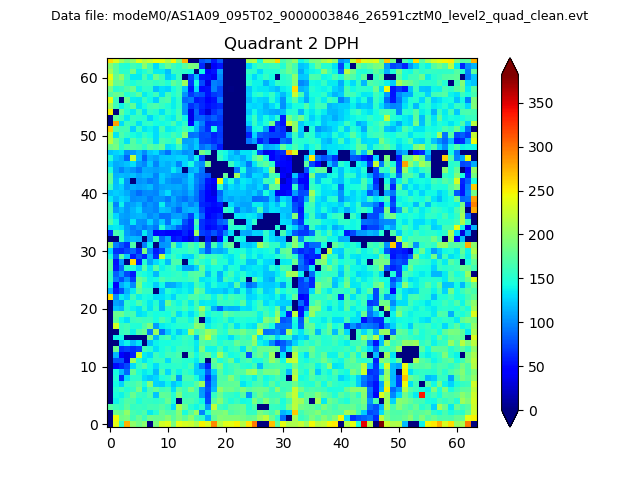
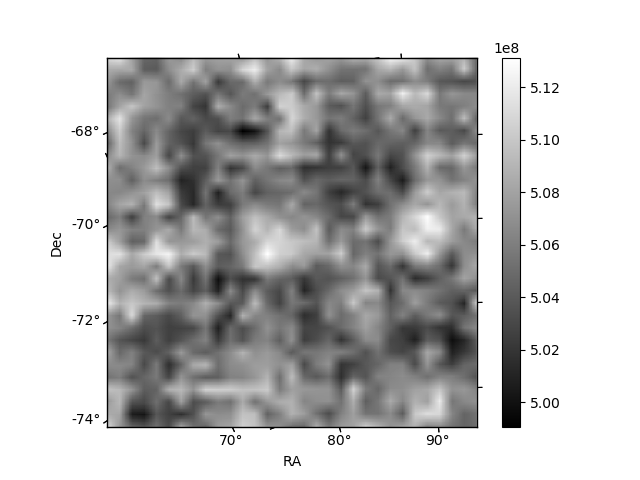
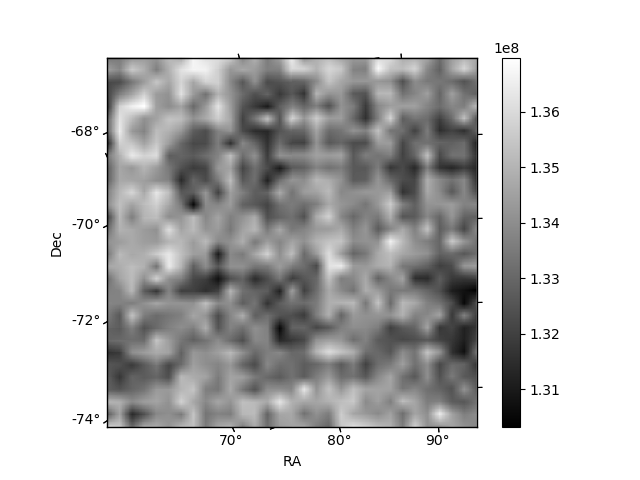
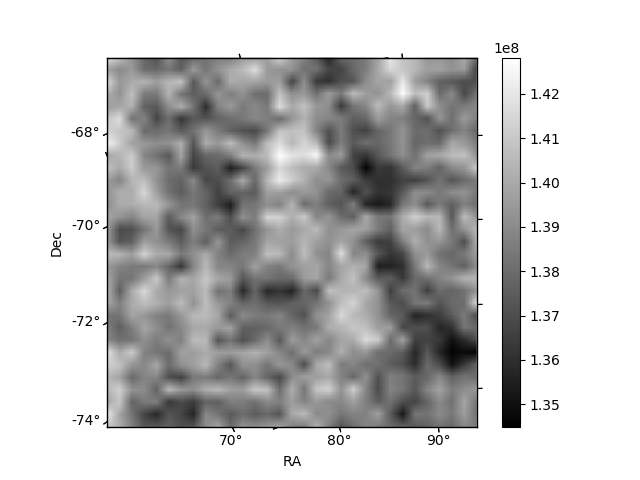
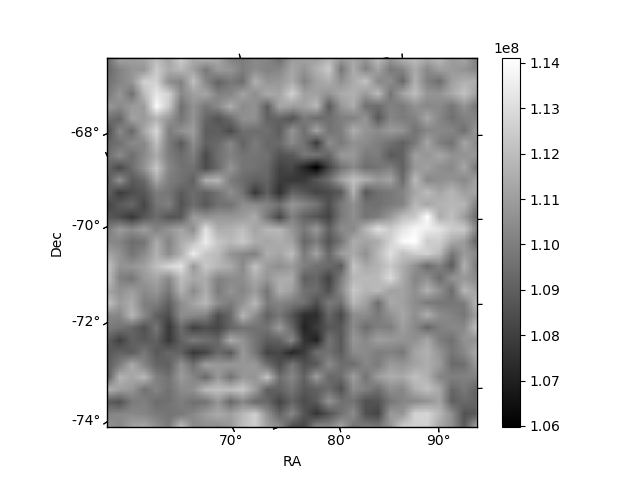
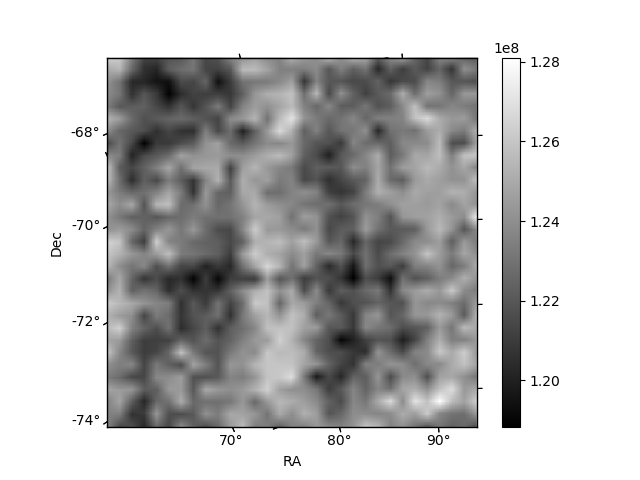
Histogram calculated using DETX and DETY for each event in the final _common_clean file
| Quadrant A | 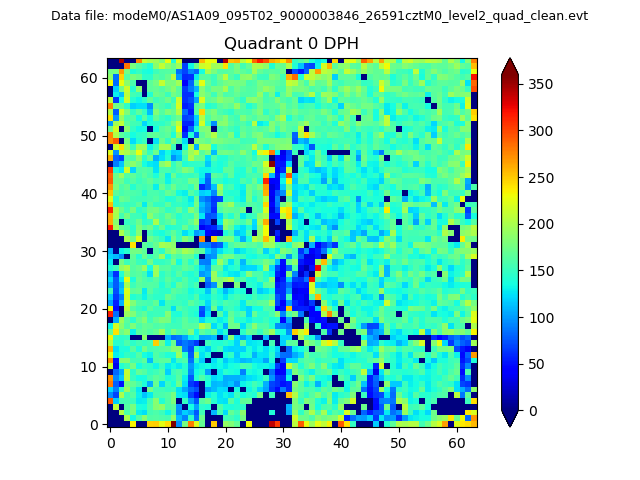 |
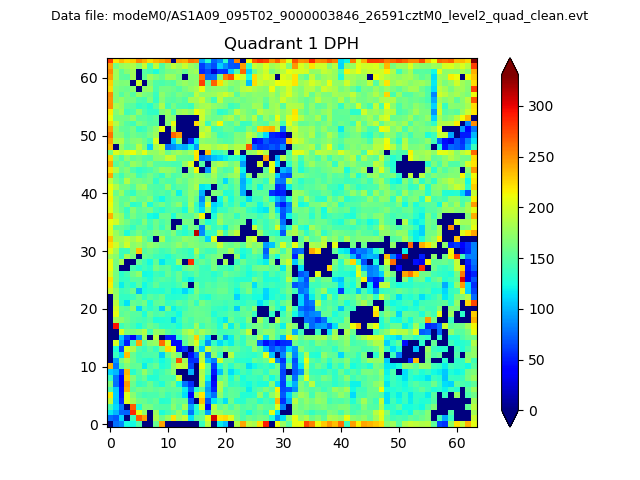 |
Quadrant B |
|---|---|---|---|
| Quadrant D | 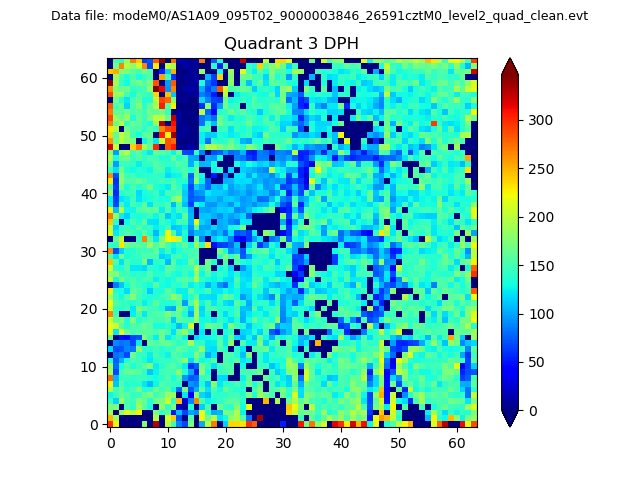 |
 |
Quadrant C |
| Plot type | Count rate plots | Images |
|---|---|---|
| Comparison with Poisson distribution Blue bars denote a histogram of data divided into 1 sec bins. Red curve is a Poisson curve with rate = median count rate of data. |
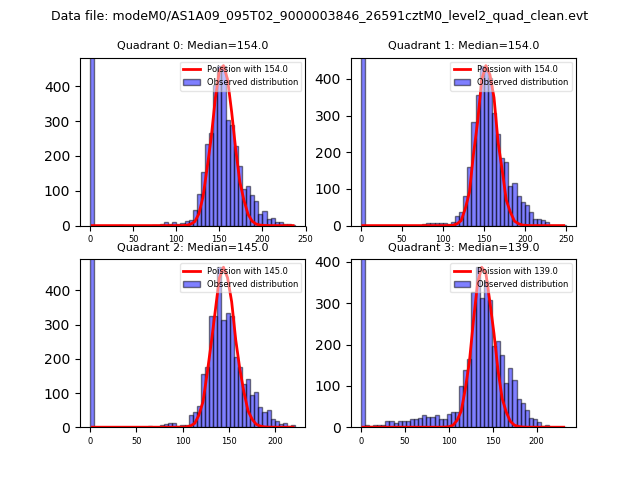 |
 |
| Quadrant-wise count rates Data is divided into 100 sec bins |
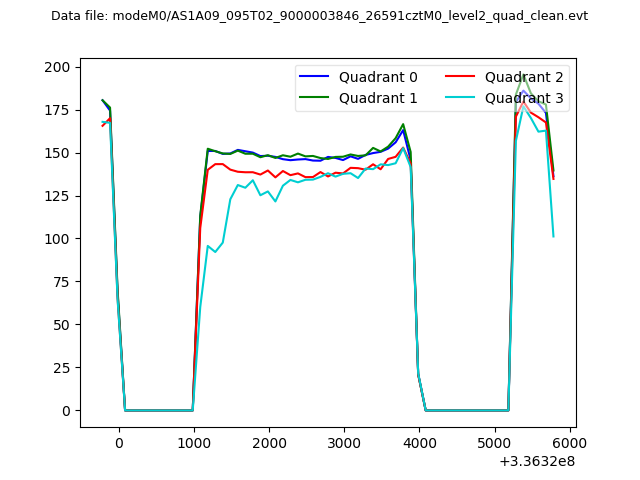 |
|
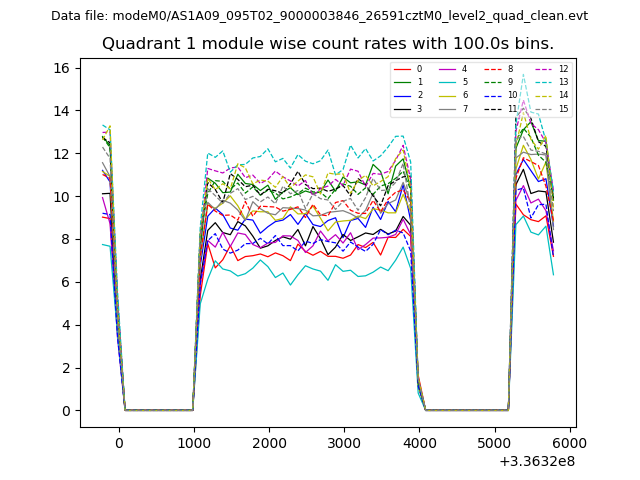
| Module-wise count rates for Quadrant A Data is divided into 100 sec bins |
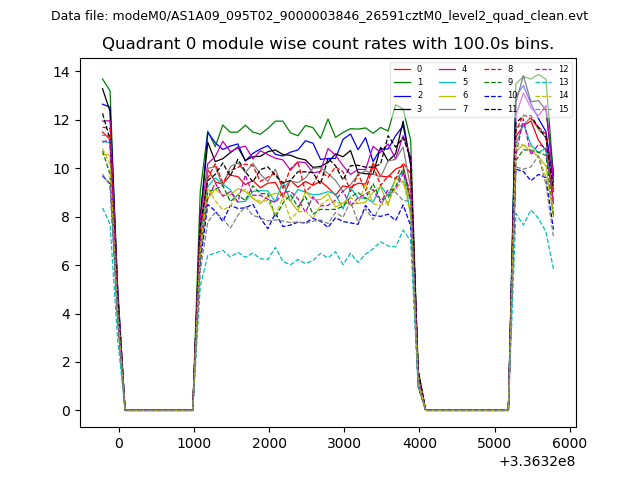 |
 |
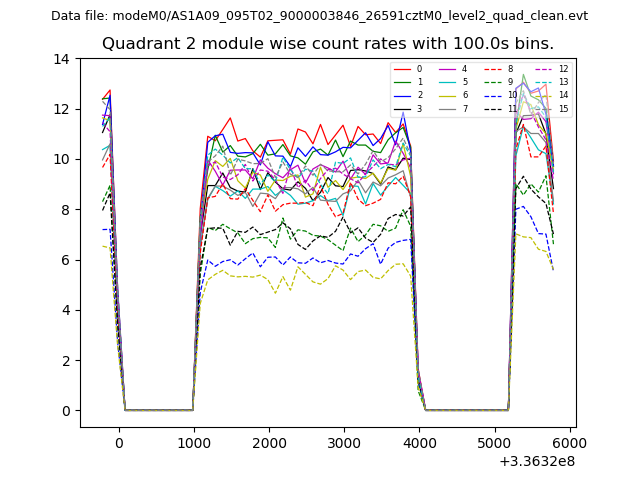
| Module-wise count rates for Quadrant B Data is divided into 100 sec bins |
 |
 |
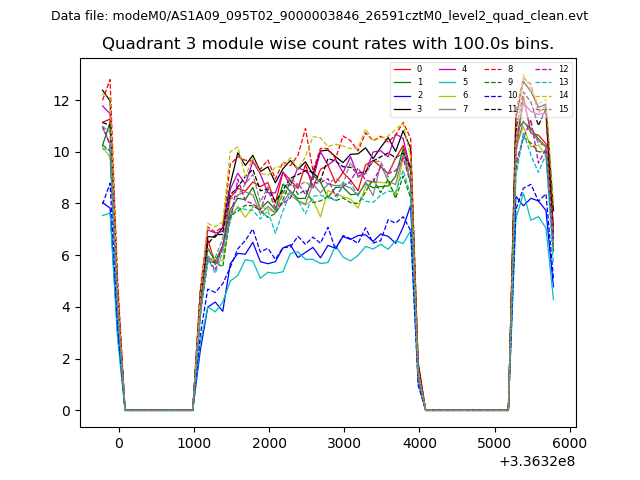
| Module-wise count rates for Quadrant C Data is divided into 100 sec bins |
 |
 |
| Module-wise count rates for Quadrant D Data is divided into 100 sec bins |
 |
 |
| Parameter | Plot |
|---|---|
| CZT HV Monitor |  |
| D_VDD | 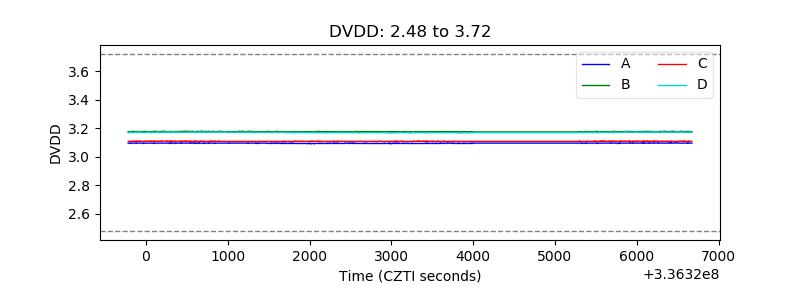 |
| Temperature 1 | 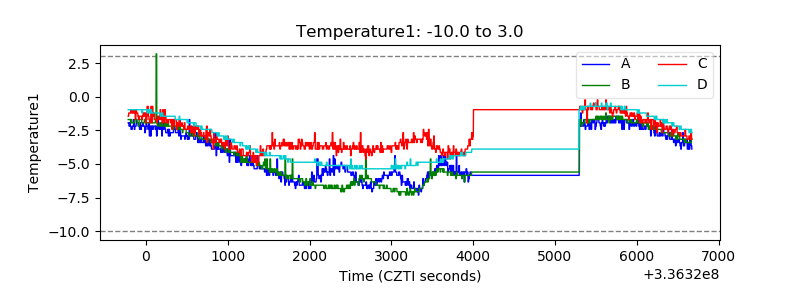 |
| Veto HV Monitor | 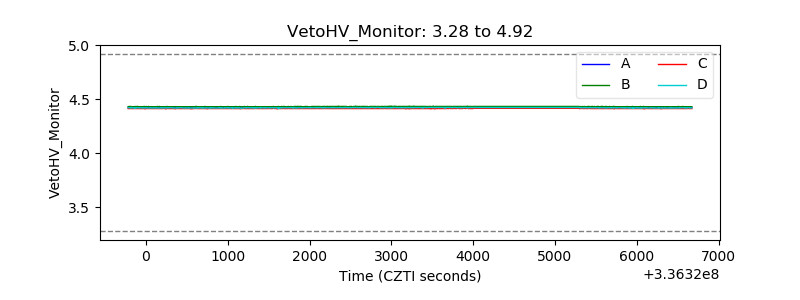 |
| Veto LLD | 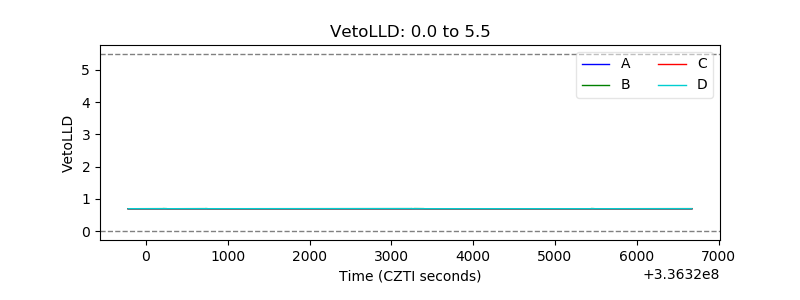 |
| Alpha Counter | 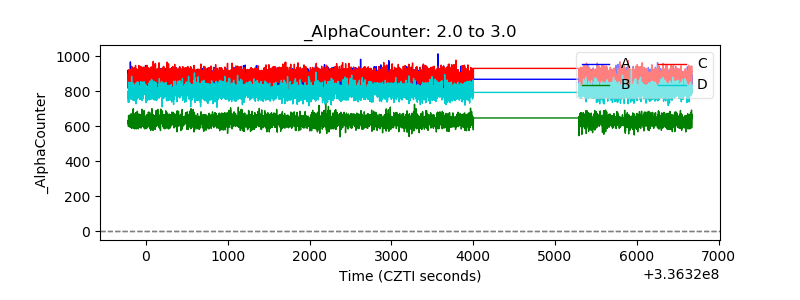 |
| _CPM_Rate |  |
| CZT Counter | 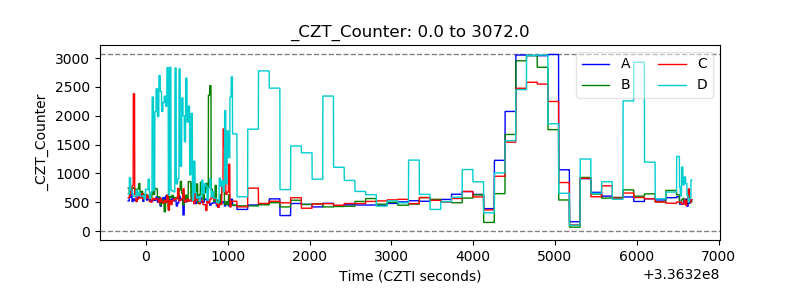 |
| +2.5 Volts monitor | 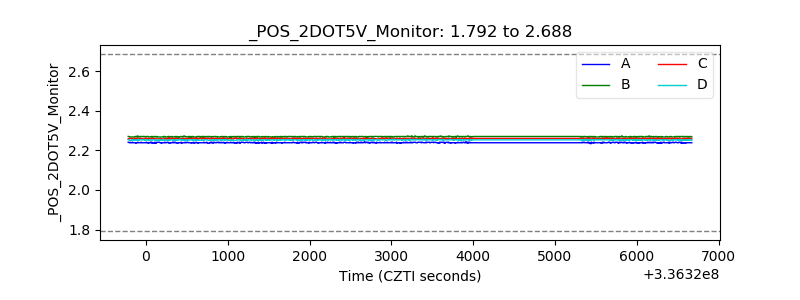 |
| +5 Volts monitor |  |
| _ROLL_ROT | 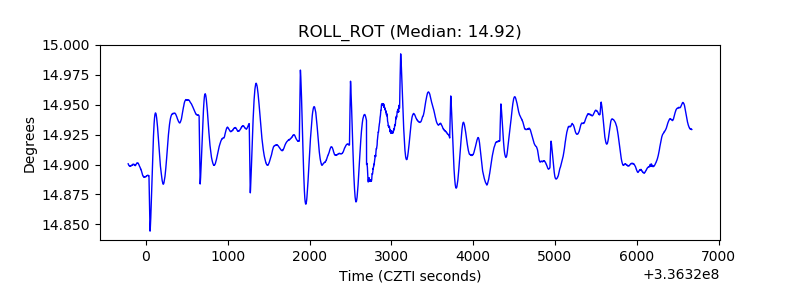 |
| _Roll_DEC | 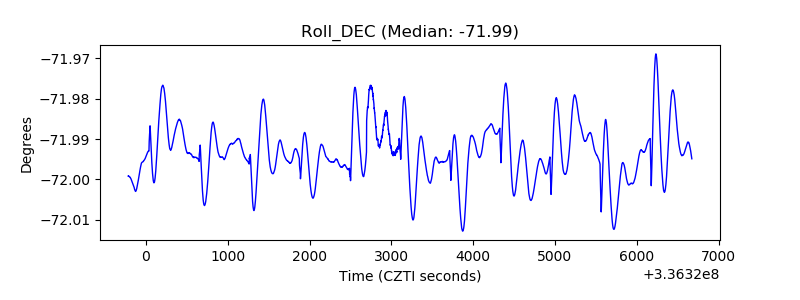 |
| _Roll_RA | 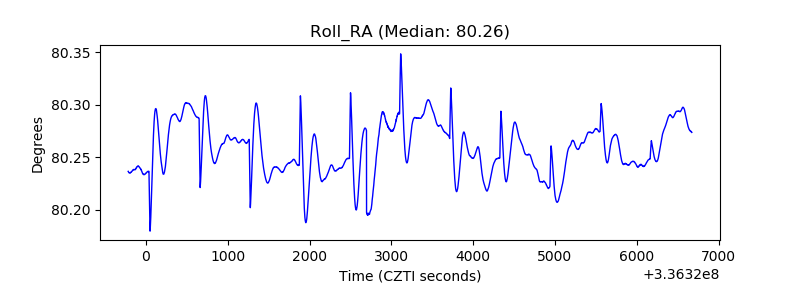 |
| Veto Counter |  |