| Param | Original file | Final file |
|---|---|---|
| Filename | modeM0/AS1A09_095T02_9000003846_26592cztM0_level2.evt | modeM0/AS1A09_095T02_9000003846_26592cztM0_level2_quad_clean.evt |
| Size (bytes) | 611,686,080 | 83,102,400 |
| Size | 583.3 MB | 79.3 MB |
| Events in quadrant A | 3,076,738 | 566,566 |
| Events in quadrant B | 3,596,041 | 573,273 |
| Events in quadrant C | 3,447,136 | 537,463 |
| Events in quadrant D | 7,996,460 | 417,577 |
| Mode M9 | |||
|---|---|---|---|
| Quadrant | BADHDUFLAG | Total packets | Discarded packets |
| A | 0 | 12 | 0 |
| B | 0 | 12 | 0 |
| C | 0 | 12 | 0 |
| D | 0 | 12 | 0 |
| Mode M0 | |||
|---|---|---|---|
| Quadrant | BADHDUFLAG | Total packets | Discarded packets |
| A | 0 | 12808 | 0 |
| B | 0 | 14547 | 0 |
| C | 0 | 13908 | 0 |
| D | 0 | 27891 | 0 |
| Quadrant | Total seconds | Saturated seconds | Saturation percentage |
|---|---|---|---|
| A | 6031 | 79 | 1.309899% |
| B | 6031 | 122 | 2.022882% |
| C | 6031 | 167 | 2.769027% |
| D | 6031 | 1970 | 32.664566% |
Noise dominated data is calculated using 1-second bins in cleaned event files. If a bin has >2000 counts, and if more than 50% of those come from <1% of pixels, then it is considered to be noise-dominated and hence unusable.
| Quadrant | # 1 sec bins | Bins with >0 counts | Bins with >2000 counts | High rate bins dominated by noise | Noise dominated (total time) | Noise dominated (detector-on time) | Marked lightcurve |
|---|---|---|---|---|---|---|---|
| A | 7206 | 6031 | 0 | 0 | 0.00% | 0.00% |  |
| B | 7206 | 6031 | 28 | 28 | 0.39% | 0.46% |  |
| C | 7206 | 6031 | 37 | 37 | 0.51% | 0.61% |  |
| D | 7206 | 6031 | 1557 | 1557 | 21.61% | 25.82% | 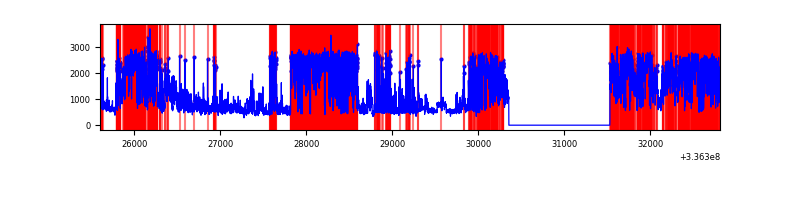 |
Top three noisy pixels from each quadrant. If the there are fewer than three noisy pixels in the level2.evt file, extra rows are filled as -1
| Pixel properties | Quadrant properties | ||||||
|---|---|---|---|---|---|---|---|
| Quadrant | DetID | PixID | Counts | Sigma | Mean | Median | Sigma |
| A | 0 | 13 | 59279 | 382.74 | 780 | 767 | 152.9 |
| A | 13 | 254 | 9009 | 53.91 | 780 | 767 | 152.9 |
| A | 5 | 168 | 7935 | 46.89 | 780 | 767 | 152.9 |
| B | 0 | 189 | 363356 | 2548.5 | 772 | 758 | 142.3 |
| B | 3 | 64 | 98338 | 685.84 | 772 | 758 | 142.3 |
| B | 15 | 33 | 53319 | 369.42 | 772 | 758 | 142.3 |
| C | 15 | 208 | 303995 | 1789.45 | 736 | 743 | 169.5 |
| C | 3 | 233 | 137768 | 808.57 | 736 | 743 | 169.5 |
| C | 14 | 238 | 121228 | 710.97 | 736 | 743 | 169.5 |
| D | 7 | 80 | 4279675 | 28649.32 | 625 | 606 | 149.4 |
| D | 1 | 52 | 1028866 | 6884.43 | 625 | 606 | 149.4 |
| D | 2 | 250 | 194273 | 1296.64 | 625 | 606 | 149.4 |
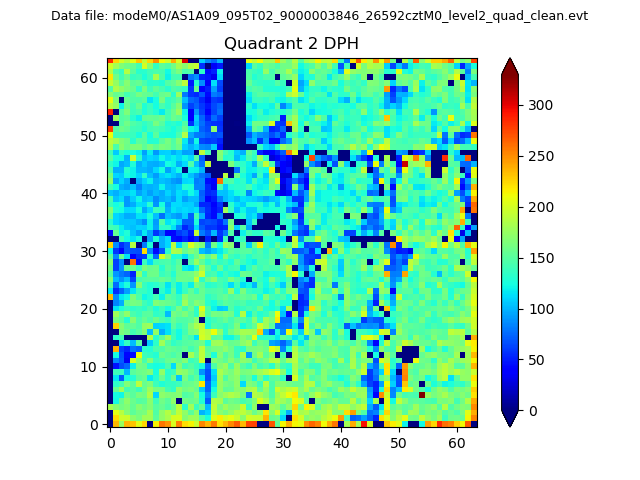
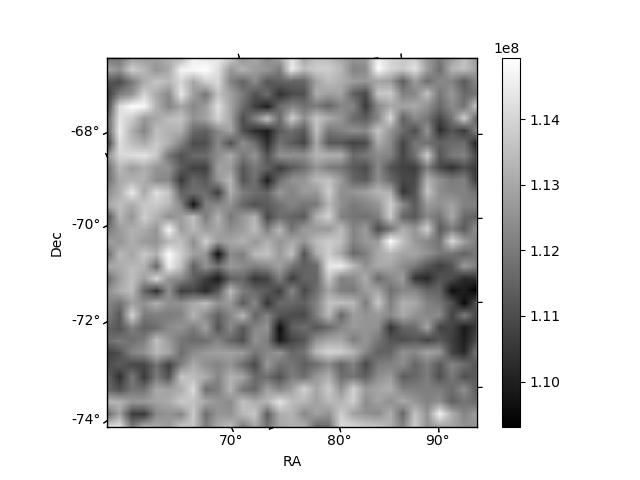
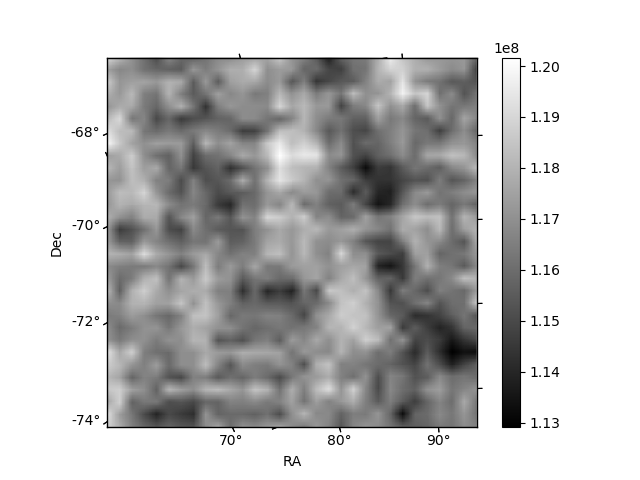
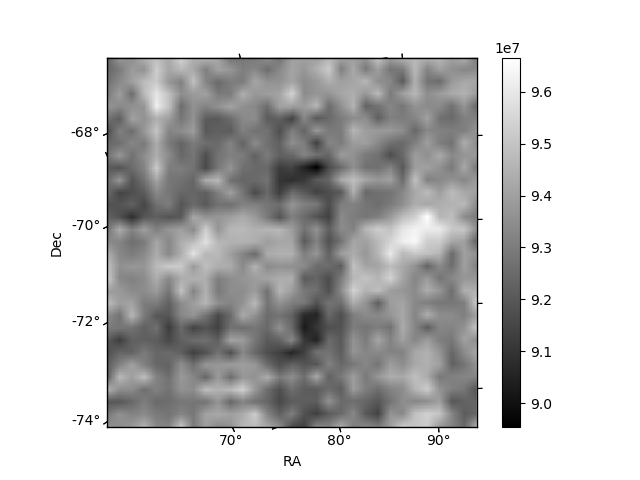
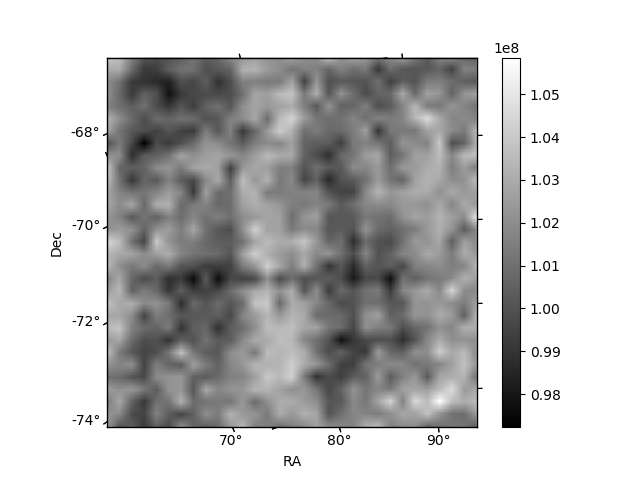
Histogram calculated using DETX and DETY for each event in the final _common_clean file
| Quadrant A | 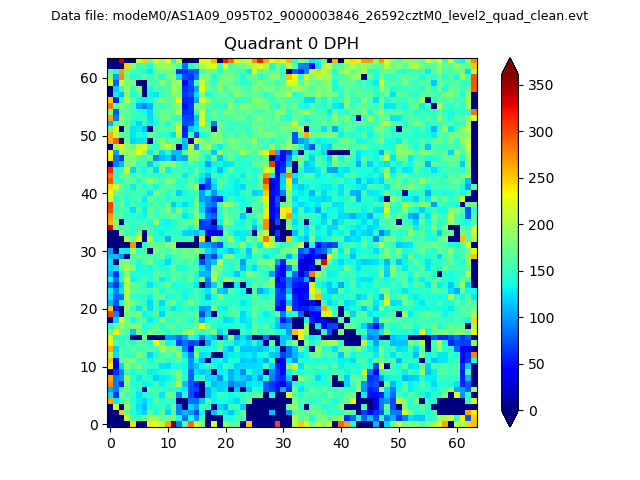 |
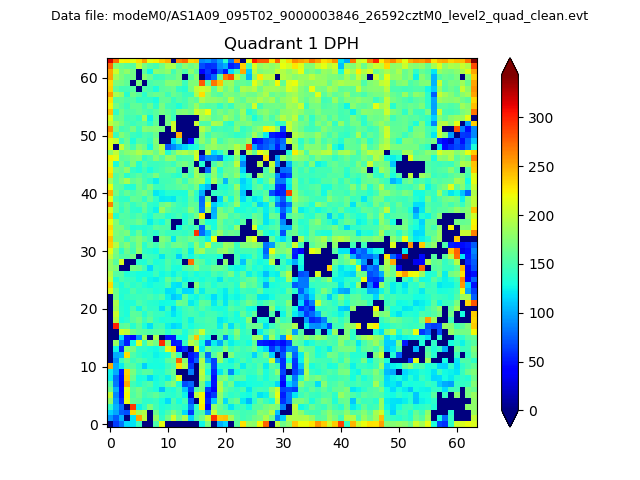 |
Quadrant B |
|---|---|---|---|
| Quadrant D | 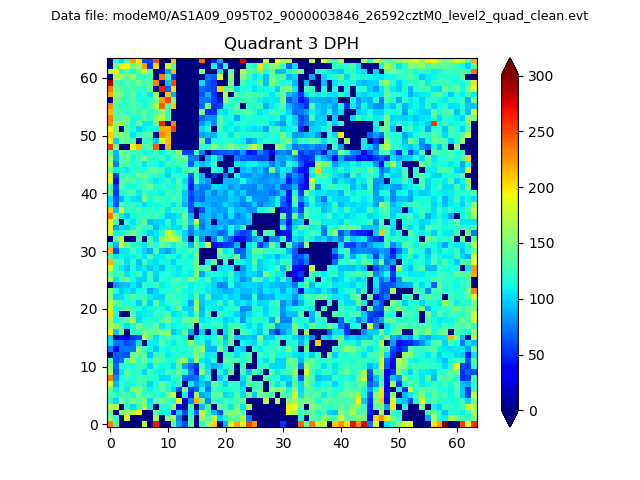 |
 |
Quadrant C |
| Plot type | Count rate plots | Images |
|---|---|---|
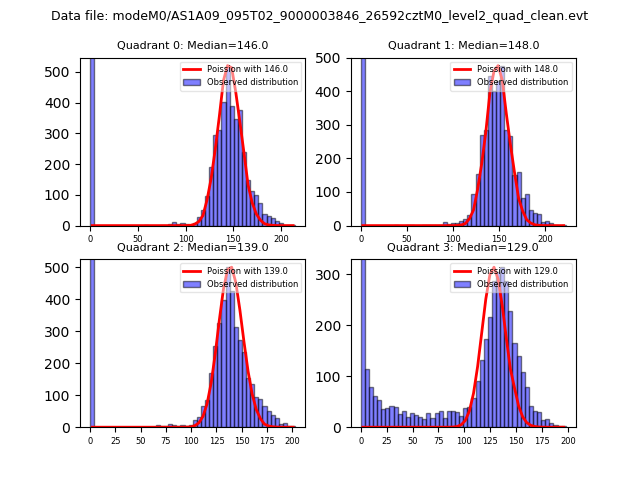
| Comparison with Poisson distribution Blue bars denote a histogram of data divided into 1 sec bins. Red curve is a Poisson curve with rate = median count rate of data. |
 |
 |
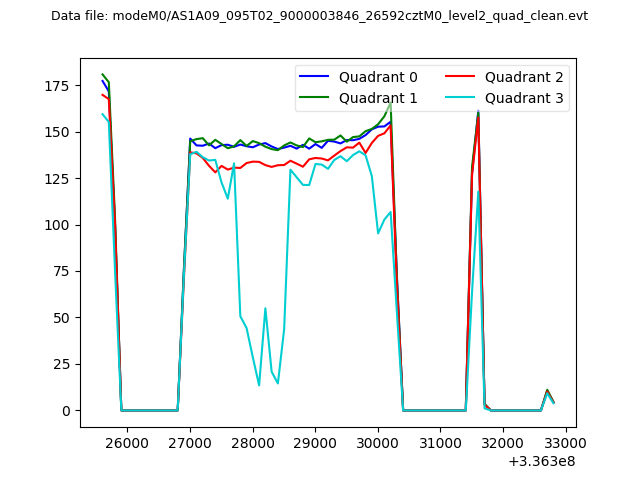
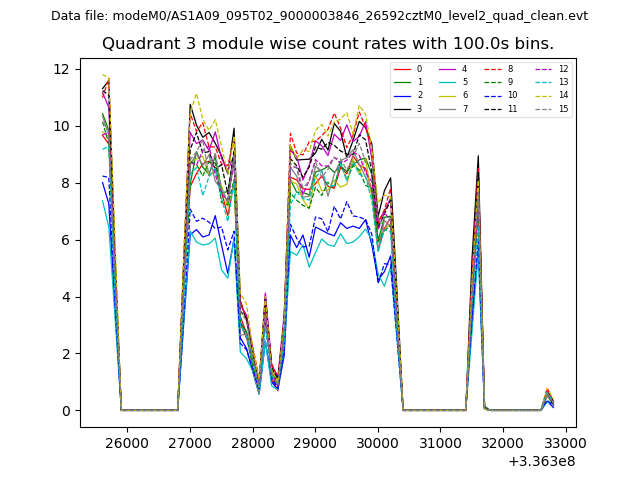
| Quadrant-wise count rates Data is divided into 100 sec bins |
 |
|
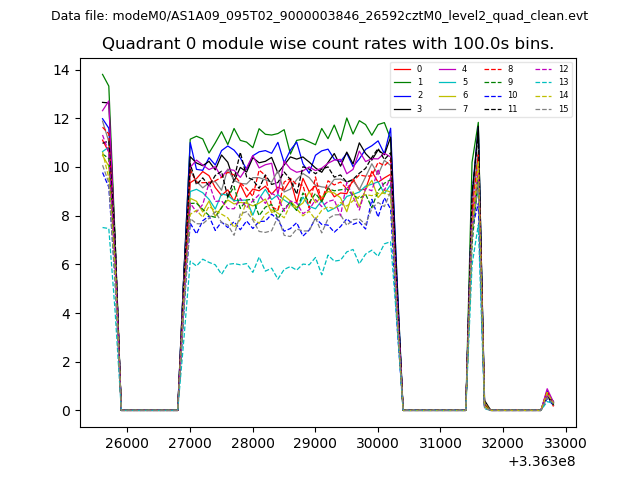
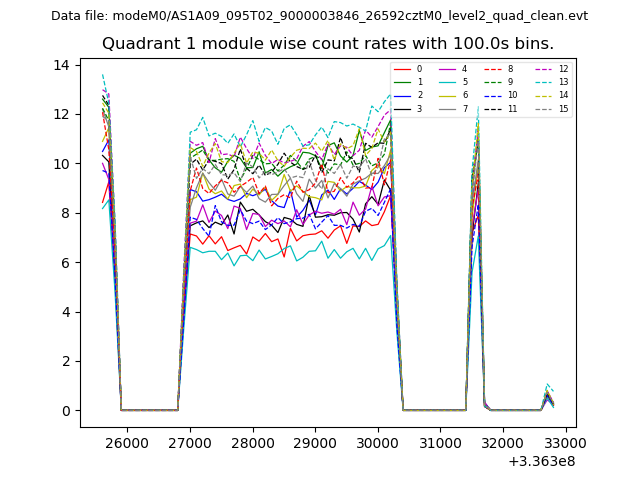
| Module-wise count rates for Quadrant A Data is divided into 100 sec bins |
 |
 |
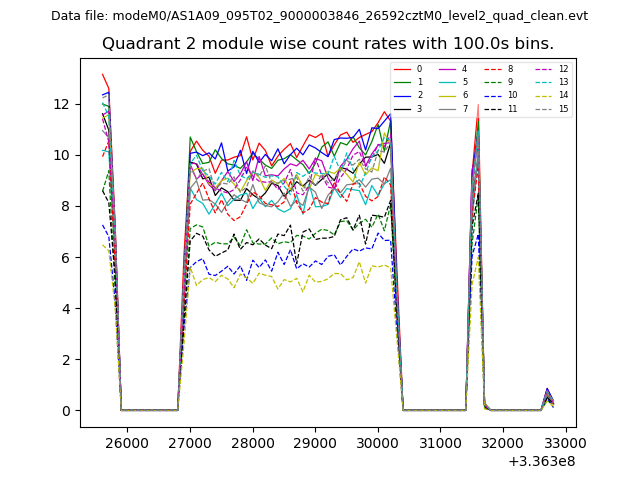
| Module-wise count rates for Quadrant B Data is divided into 100 sec bins |
 |
 |
| Module-wise count rates for Quadrant C Data is divided into 100 sec bins |
 |
 |
| Module-wise count rates for Quadrant D Data is divided into 100 sec bins |
 |
 |
| Parameter | Plot |
|---|---|
| CZT HV Monitor | 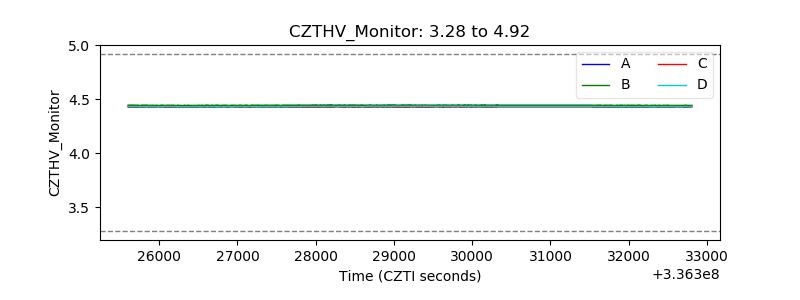 |
| D_VDD | 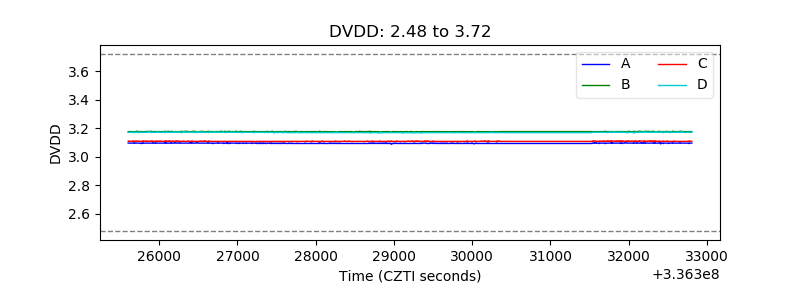 |
| Temperature 1 | 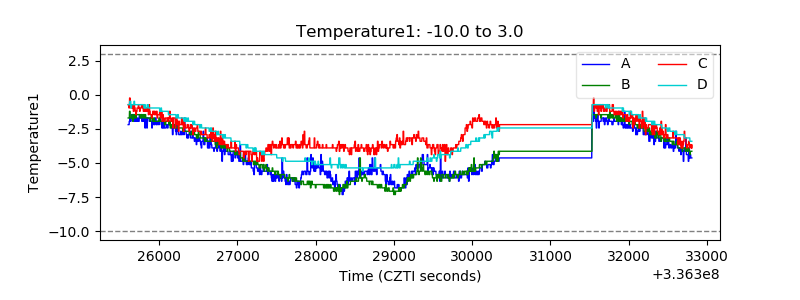 |
| Veto HV Monitor | 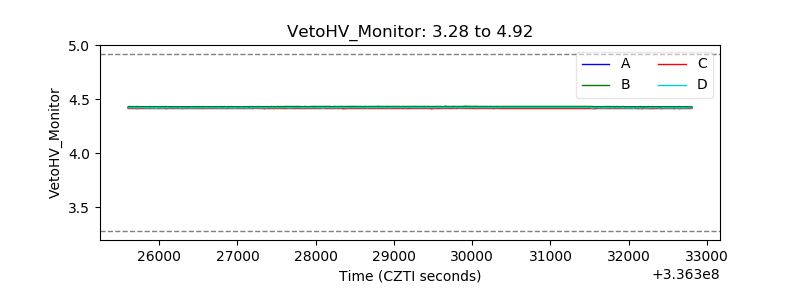 |
| Veto LLD | 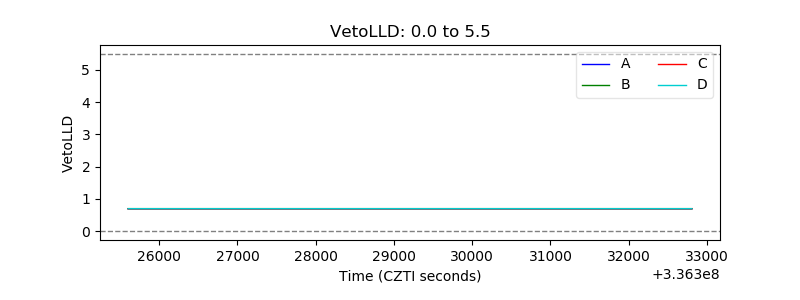 |
| Alpha Counter |  |
| _CPM_Rate |  |
| CZT Counter | 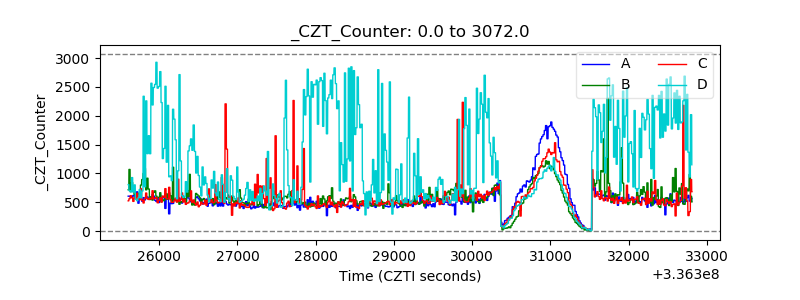 |
| +2.5 Volts monitor | 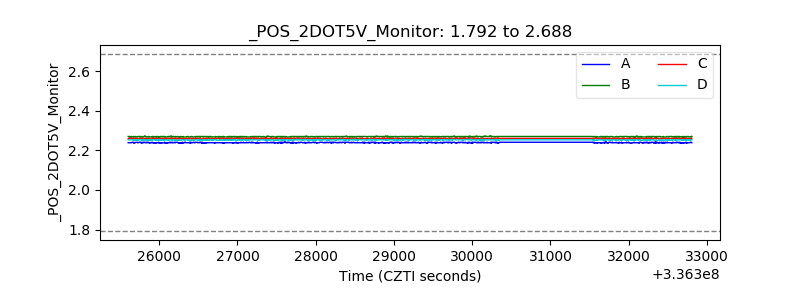 |
| +5 Volts monitor |  |
| _ROLL_ROT | 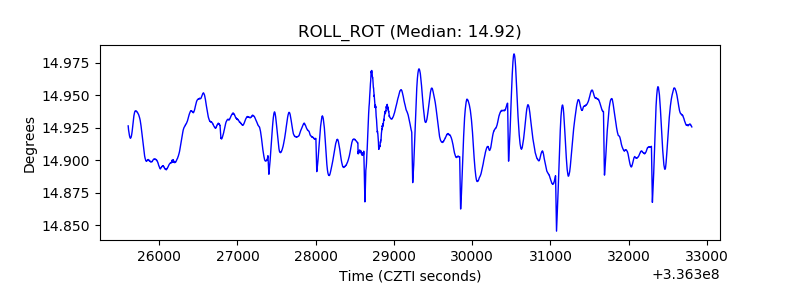 |
| _Roll_DEC | 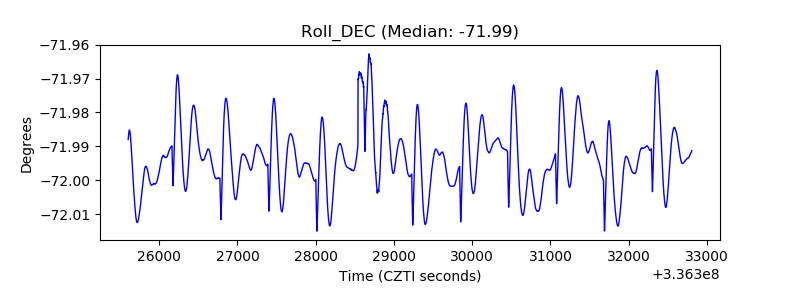 |
| _Roll_RA | 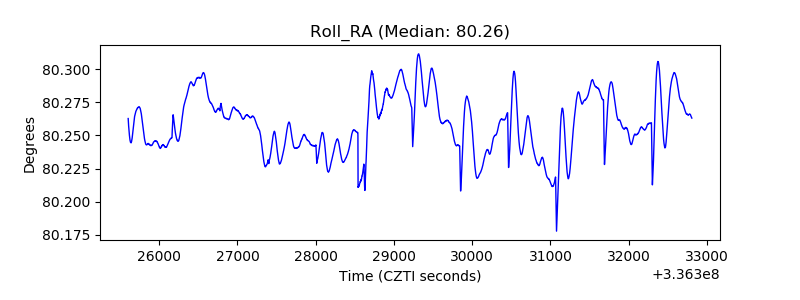 |
| Veto Counter |  |