| Param | Original file | Final file |
|---|---|---|
| Filename | modeM0/AS1A09_095T02_9000003846_26593cztM0_level2.evt | modeM0/AS1A09_095T02_9000003846_26593cztM0_level2_quad_clean.evt |
| Size (bytes) | 793,532,160 | 94,550,400 |
| Size | 756.8 MB | 90.2 MB |
| Events in quadrant A | 3,450,267 | 649,825 |
| Events in quadrant B | 5,266,144 | 614,708 |
| Events in quadrant C | 4,153,053 | 619,453 |
| Events in quadrant D | 10,709,597 | 510,625 |
| Mode M9 | |||
|---|---|---|---|
| Quadrant | BADHDUFLAG | Total packets | Discarded packets |
| A | 0 | 9 | 0 |
| B | 0 | 10 | 0 |
| C | 0 | 10 | 0 |
| D | 0 | 10 | 0 |
| Mode M0 | |||
|---|---|---|---|
| Quadrant | BADHDUFLAG | Total packets | Discarded packets |
| A | 0 | 14396 | 0 |
| B | 0 | 20053 | 0 |
| C | 0 | 16525 | 0 |
| D | 0 | 36434 | 0 |
| Quadrant | Total seconds | Saturated seconds | Saturation percentage |
|---|---|---|---|
| A | 6706 | 77 | 1.148225% |
| B | 6705 | 686 | 10.231171% |
| C | 6705 | 220 | 3.281133% |
| D | 6705 | 2446 | 36.480239% |
Noise dominated data is calculated using 1-second bins in cleaned event files. If a bin has >2000 counts, and if more than 50% of those come from <1% of pixels, then it is considered to be noise-dominated and hence unusable.
| Quadrant | # 1 sec bins | Bins with >0 counts | Bins with >2000 counts | High rate bins dominated by noise | Noise dominated (total time) | Noise dominated (detector-on time) | Marked lightcurve |
|---|---|---|---|---|---|---|---|
| A | 7566 | 6706 | 14 | 14 | 0.19% | 0.21% | 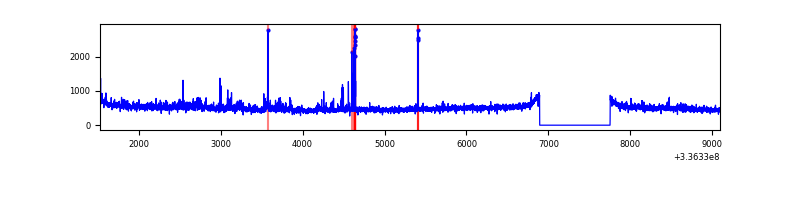 |
| B | 7565 | 6705 | 516 | 516 | 6.82% | 7.70% | 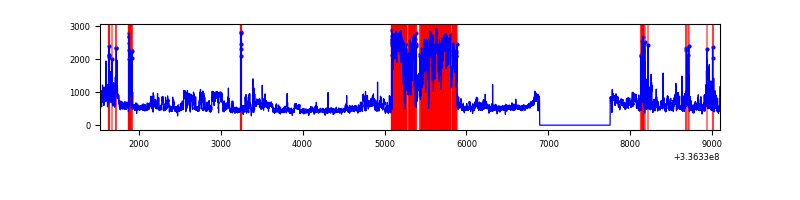 |
| C | 7565 | 6705 | 88 | 88 | 1.16% | 1.31% | 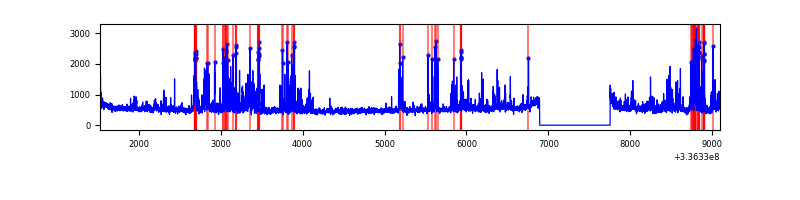 |
| D | 7565 | 6705 | 2319 | 2319 | 30.65% | 34.59% | 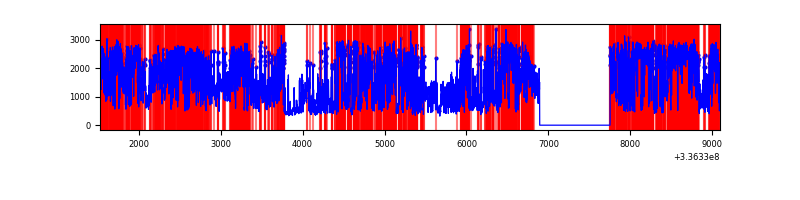 |
Top three noisy pixels from each quadrant. If the there are fewer than three noisy pixels in the level2.evt file, extra rows are filled as -1
| Pixel properties | Quadrant properties | ||||||
|---|---|---|---|---|---|---|---|
| Quadrant | DetID | PixID | Counts | Sigma | Mean | Median | Sigma |
| A | 0 | 13 | 150196 | 907.8 | 832 | 815 | 164.6 |
| A | 12 | 96 | 82307 | 495.23 | 832 | 815 | 164.6 |
| A | 13 | 254 | 10299 | 57.63 | 832 | 815 | 164.6 |
| B | 3 | 64 | 1598904 | 10802.77 | 794 | 778 | 147.9 |
| B | 0 | 189 | 531842 | 3589.81 | 794 | 778 | 147.9 |
| B | 12 | 111 | 17463 | 112.78 | 794 | 778 | 147.9 |
| C | 15 | 208 | 572432 | 3131.73 | 789 | 793 | 182.5 |
| C | 3 | 233 | 355285 | 1942.09 | 789 | 793 | 182.5 |
| C | 14 | 238 | 130204 | 708.98 | 789 | 793 | 182.5 |
| D | 7 | 80 | 5873041 | 36129.14 | 674 | 654 | 162.5 |
| D | 1 | 52 | 1317325 | 8100.66 | 674 | 654 | 162.5 |
| D | 2 | 250 | 846000 | 5200.89 | 674 | 654 | 162.5 |
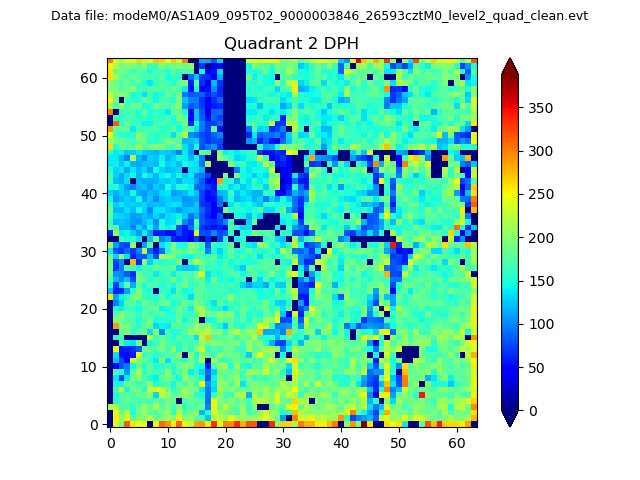
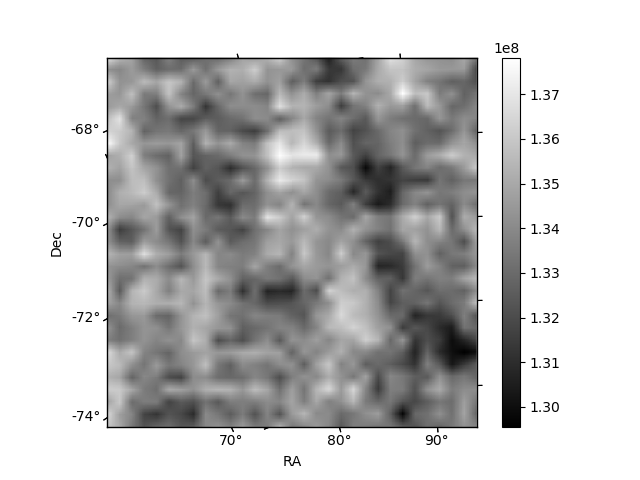
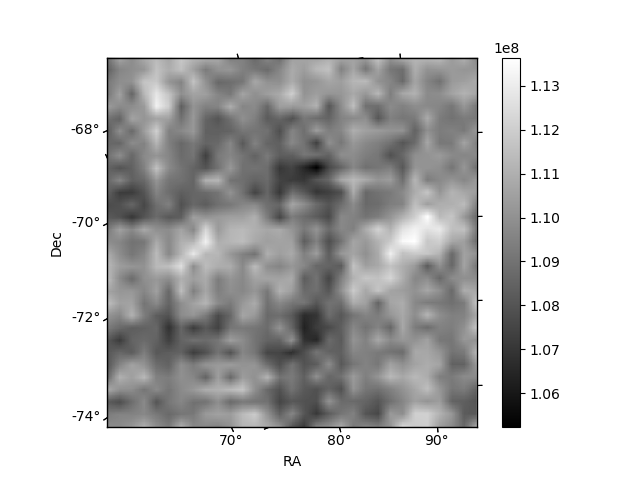
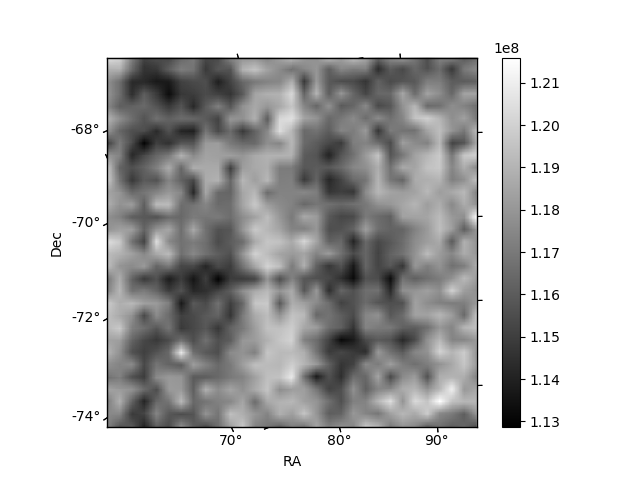
Histogram calculated using DETX and DETY for each event in the final _common_clean file
| Quadrant A | 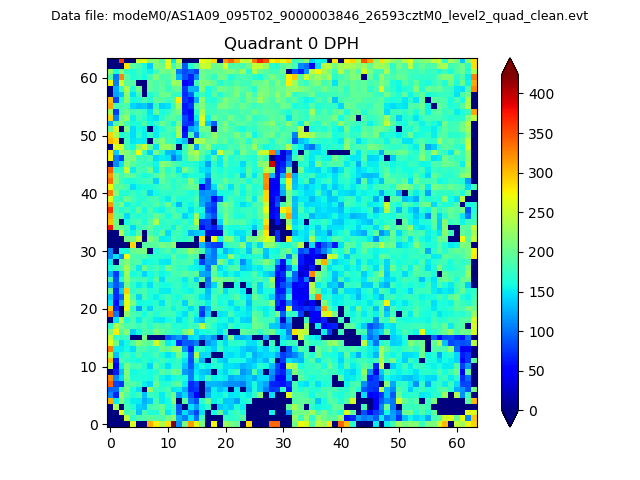 |
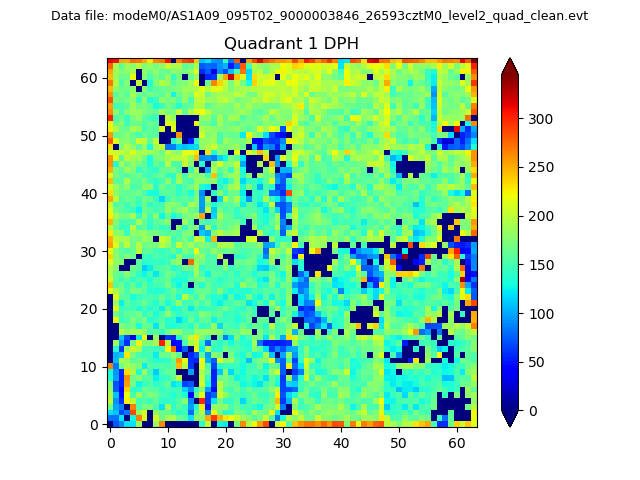 |
Quadrant B |
|---|---|---|---|
| Quadrant D | 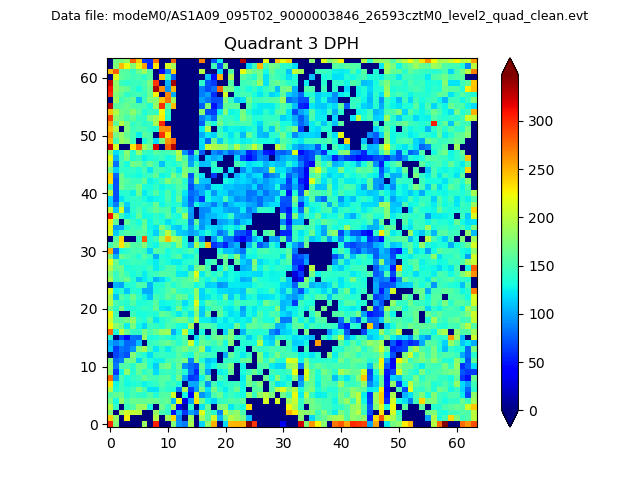 |
 |
Quadrant C |
| Plot type | Count rate plots | Images |
|---|---|---|
| Comparison with Poisson distribution Blue bars denote a histogram of data divided into 1 sec bins. Red curve is a Poisson curve with rate = median count rate of data. |
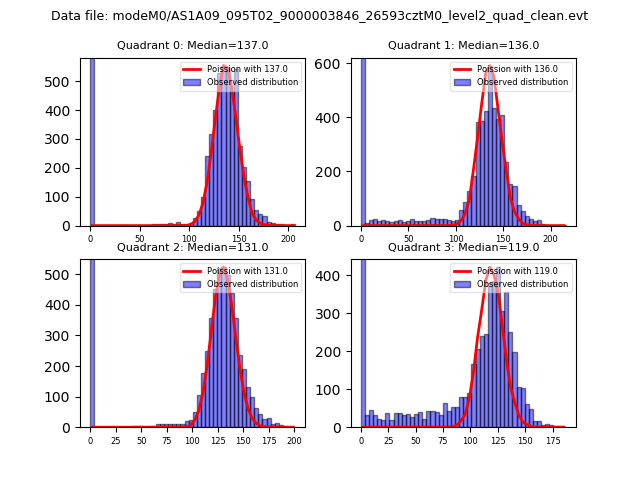 |
 |
| Quadrant-wise count rates Data is divided into 100 sec bins |
 |
|
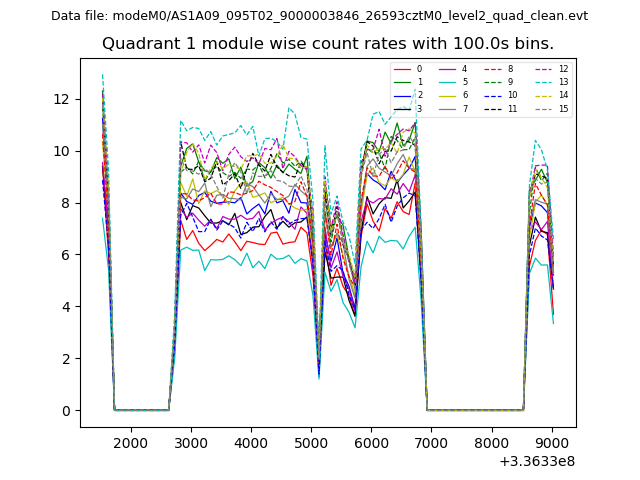
| Module-wise count rates for Quadrant A Data is divided into 100 sec bins |
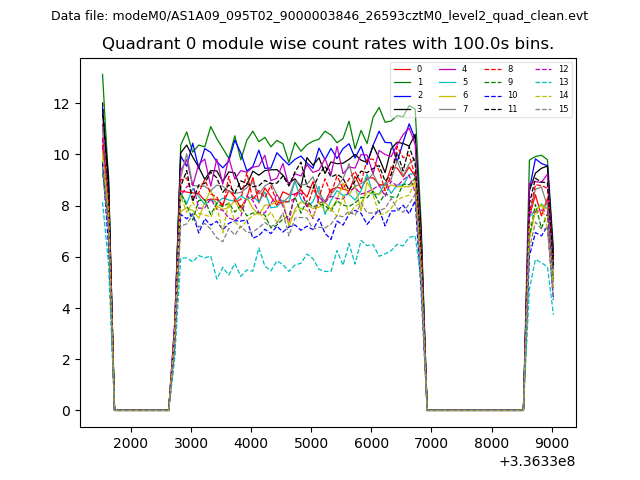 |
 |
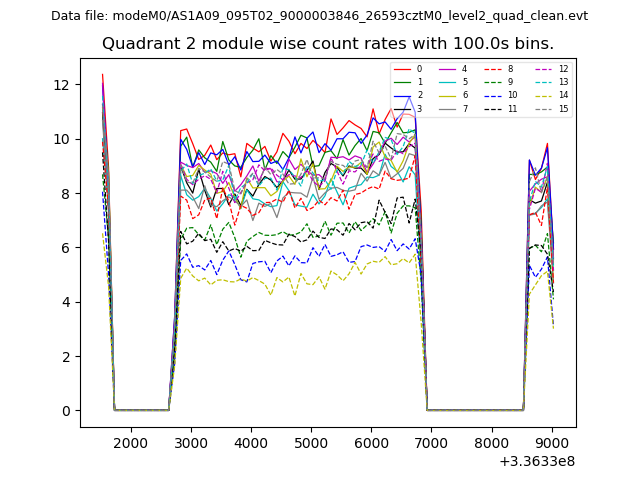
| Module-wise count rates for Quadrant B Data is divided into 100 sec bins |
 |
 |
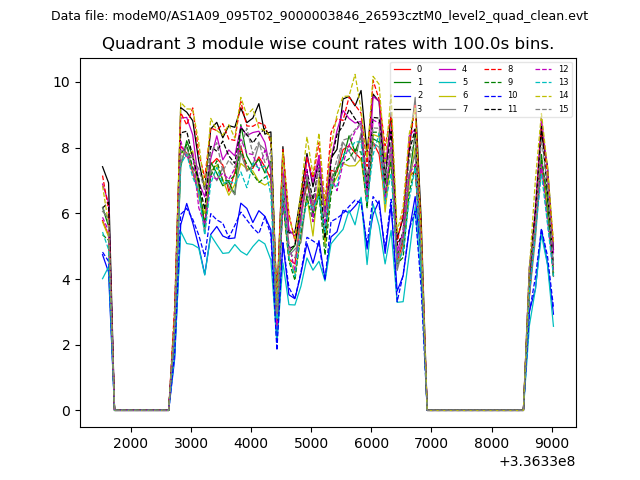
| Module-wise count rates for Quadrant C Data is divided into 100 sec bins |
 |
 |
| Module-wise count rates for Quadrant D Data is divided into 100 sec bins |
 |
 |
| Parameter | Plot |
|---|---|
| CZT HV Monitor | 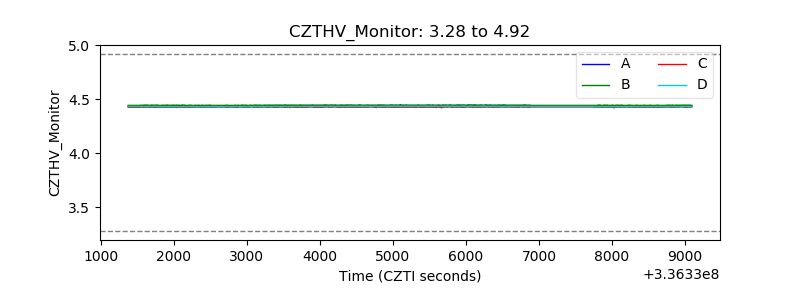 |
| D_VDD | 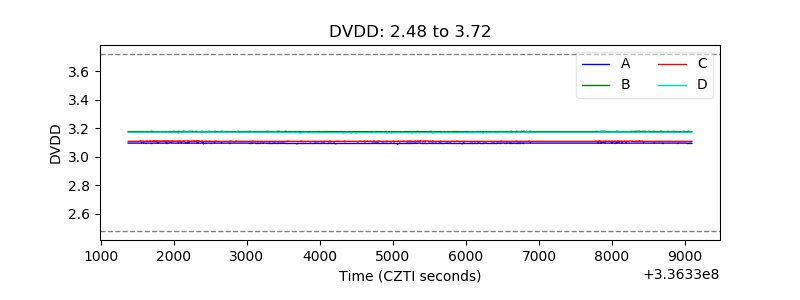 |
| Temperature 1 | 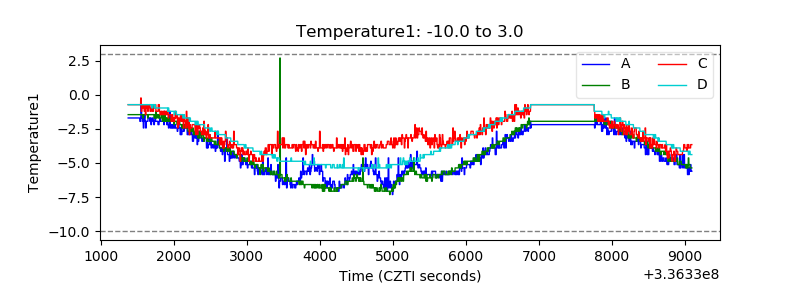 |
| Veto HV Monitor | 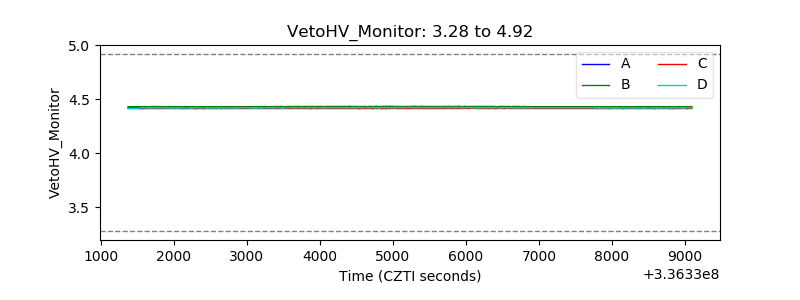 |
| Veto LLD | 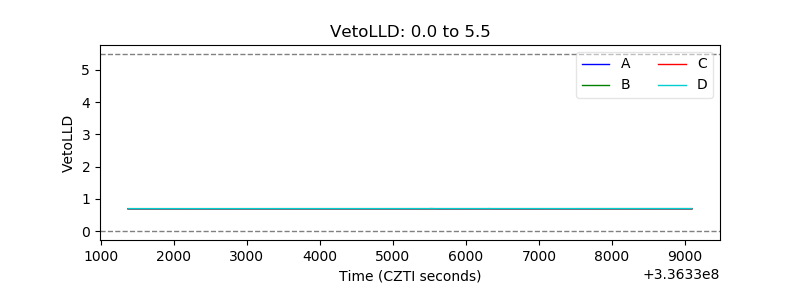 |
| Alpha Counter |  |
| _CPM_Rate | 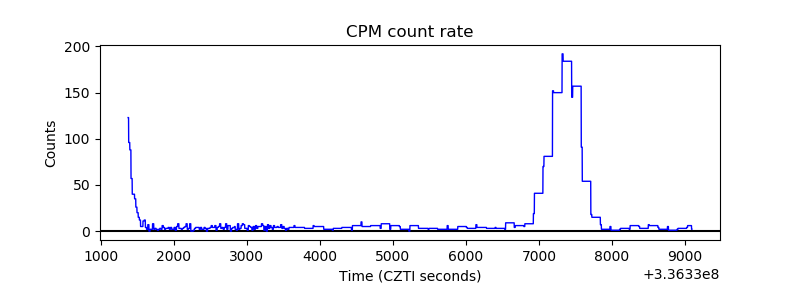 |
| CZT Counter | 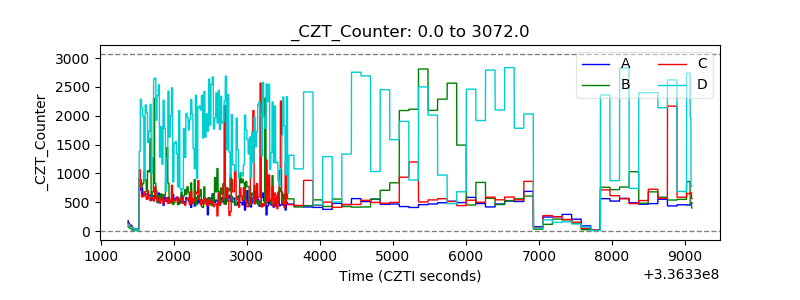 |
| +2.5 Volts monitor | 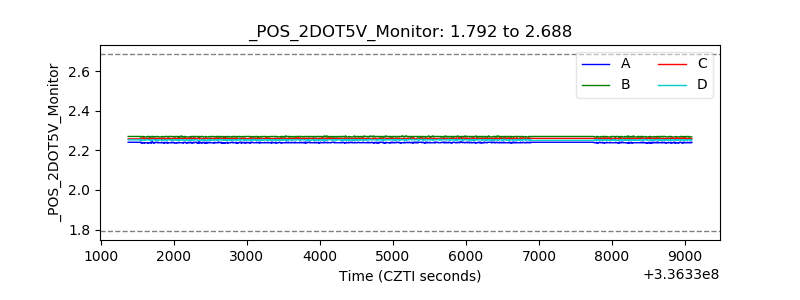 |
| +5 Volts monitor |  |
| _ROLL_ROT | 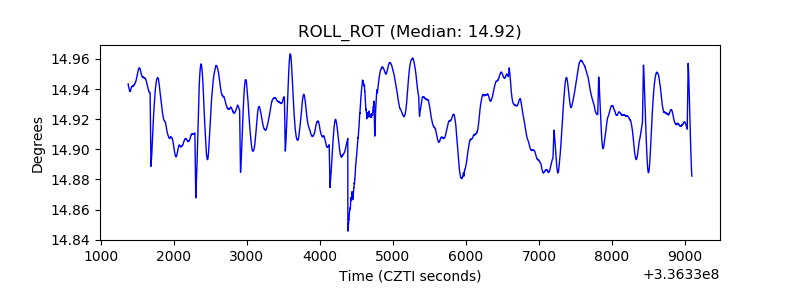 |
| _Roll_DEC | 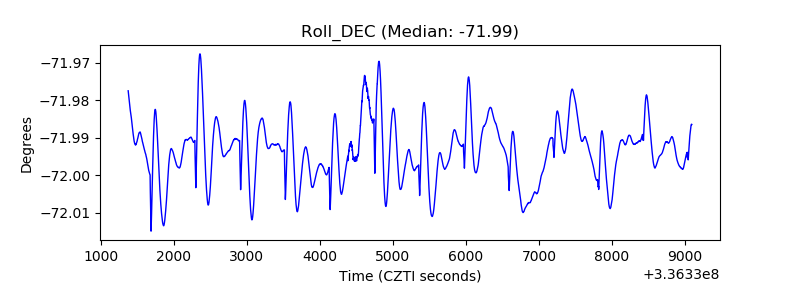 |
| _Roll_RA | 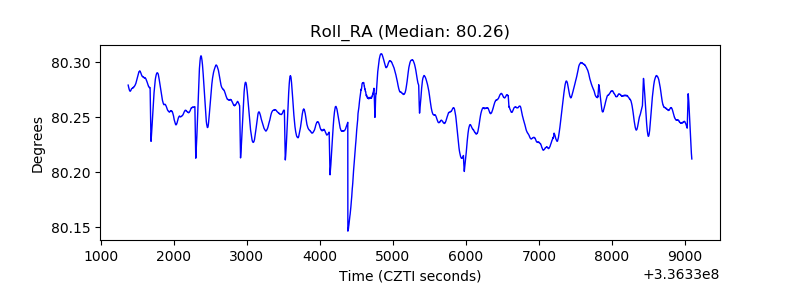 |
| Veto Counter | 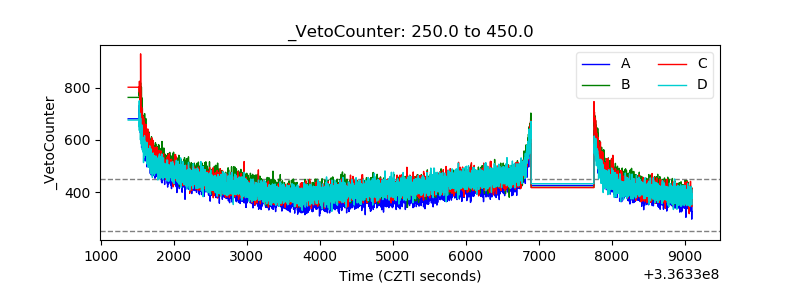 |