| Param | Original file | Final file |
|---|---|---|
| Filename | modeM0/AS1A09_095T02_9000003846_26594cztM0_level2.evt | modeM0/AS1A09_095T02_9000003846_26594cztM0_level2_quad_clean.evt |
| Size (bytes) | 763,701,120 | 109,869,120 |
| Size | 728.3 MB | 104.8 MB |
| Events in quadrant A | 3,626,252 | 750,394 |
| Events in quadrant B | 5,288,871 | 737,574 |
| Events in quadrant C | 4,238,432 | 726,040 |
| Events in quadrant D | 9,486,505 | 609,348 |
| Mode M9 | |||
|---|---|---|---|
| Quadrant | BADHDUFLAG | Total packets | Discarded packets |
| A | 0 | 8 | 0 |
| B | 0 | 9 | 0 |
| C | 0 | 9 | 0 |
| D | 0 | 9 | 0 |
| Mode M0 | |||
|---|---|---|---|
| Quadrant | BADHDUFLAG | Total packets | Discarded packets |
| A | 0 | 15421 | 0 |
| B | 0 | 20670 | 0 |
| C | 0 | 17247 | 0 |
| D | 0 | 33140 | 0 |
| Quadrant | Total seconds | Saturated seconds | Saturation percentage |
|---|---|---|---|
| A | 7229 | 58 | 0.802324% |
| B | 7229 | 476 | 6.584590% |
| C | 7229 | 174 | 2.406972% |
| D | 7229 | 2298 | 31.788629% |
Noise dominated data is calculated using 1-second bins in cleaned event files. If a bin has >2000 counts, and if more than 50% of those come from <1% of pixels, then it is considered to be noise-dominated and hence unusable.
| Quadrant | # 1 sec bins | Bins with >0 counts | Bins with >2000 counts | High rate bins dominated by noise | Noise dominated (total time) | Noise dominated (detector-on time) | Marked lightcurve |
|---|---|---|---|---|---|---|---|
| A | 7719 | 7229 | 11 | 11 | 0.14% | 0.15% | 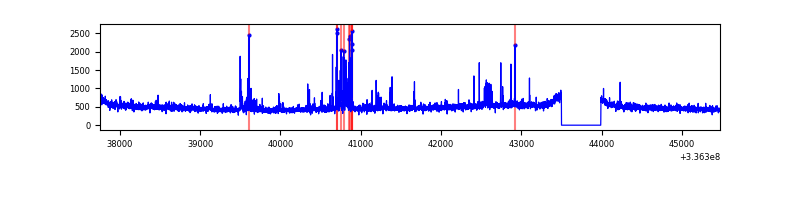 |
| B | 7719 | 7229 | 278 | 278 | 3.60% | 3.85% | 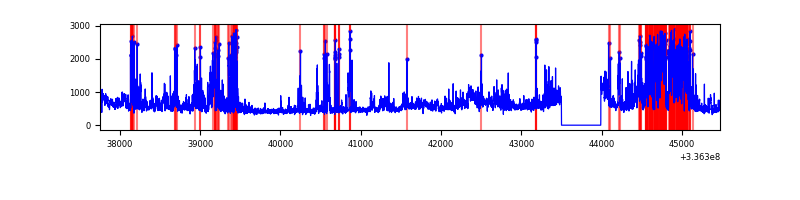 |
| C | 7719 | 7229 | 52 | 52 | 0.67% | 0.72% | 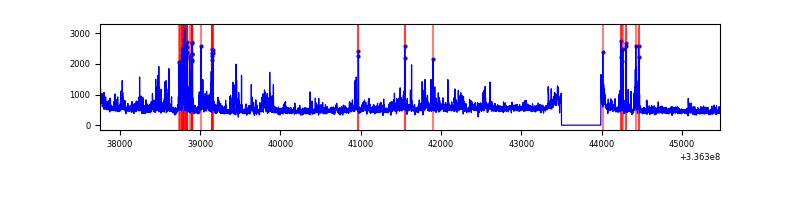 |
| D | 7719 | 7229 | 2128 | 2128 | 27.57% | 29.44% | 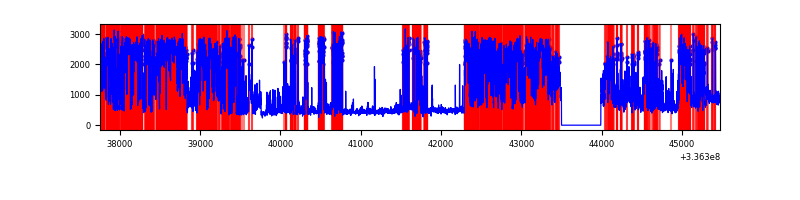 |
Top three noisy pixels from each quadrant. If the there are fewer than three noisy pixels in the level2.evt file, extra rows are filled as -1
| Pixel properties | Quadrant properties | ||||||
|---|---|---|---|---|---|---|---|
| Quadrant | DetID | PixID | Counts | Sigma | Mean | Median | Sigma |
| A | 12 | 96 | 202727 | 1148.73 | 874 | 854 | 175.7 |
| A | 0 | 13 | 49990 | 279.6 | 874 | 854 | 175.7 |
| A | 13 | 254 | 11270 | 59.27 | 874 | 854 | 175.7 |
| B | 3 | 64 | 1423554 | 8850.2 | 853 | 831 | 160.8 |
| B | 0 | 189 | 480637 | 2984.69 | 853 | 831 | 160.8 |
| B | 12 | 111 | 19195 | 114.24 | 853 | 831 | 160.8 |
| C | 3 | 233 | 548138 | 2869.37 | 828 | 833 | 190.7 |
| C | 15 | 208 | 301215 | 1574.82 | 828 | 833 | 190.7 |
| C | 14 | 238 | 135308 | 705.02 | 828 | 833 | 190.7 |
| D | 7 | 80 | 3485669 | 18505.04 | 710 | 696 | 188.3 |
| D | 1 | 52 | 2251181 | 11949.97 | 710 | 696 | 188.3 |
| D | 2 | 250 | 981834 | 5209.8 | 710 | 696 | 188.3 |
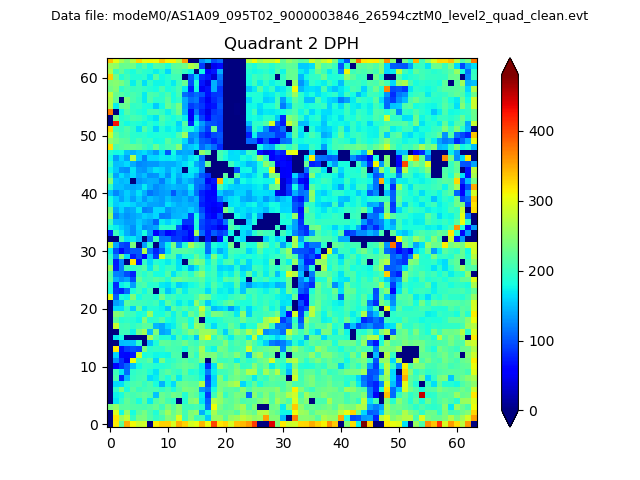
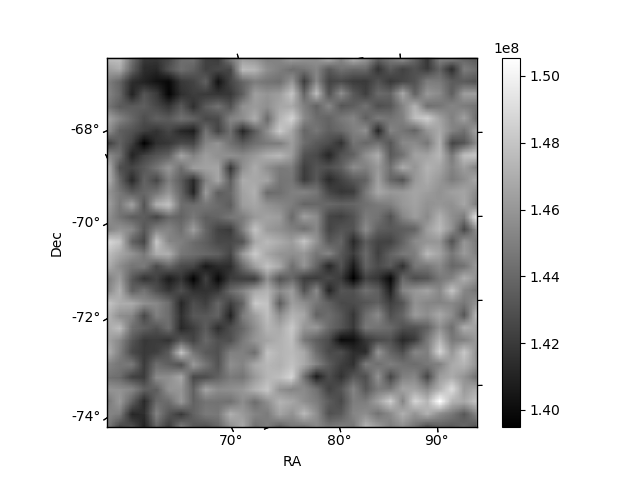
Histogram calculated using DETX and DETY for each event in the final _common_clean file
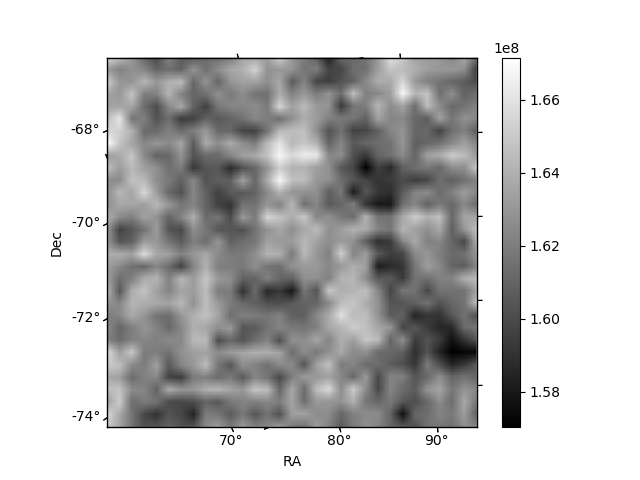
| Quadrant A | 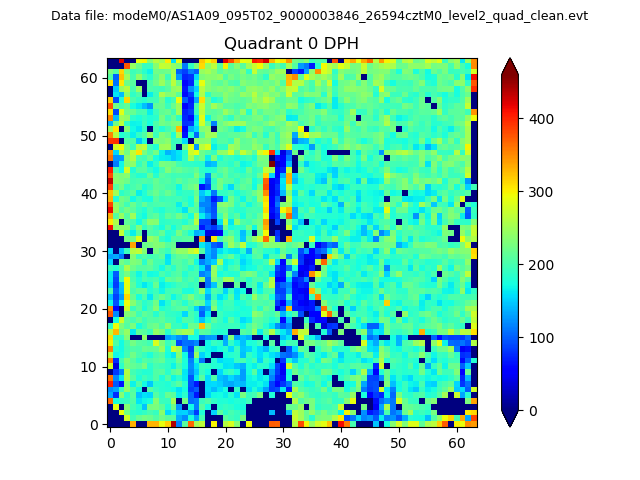 |
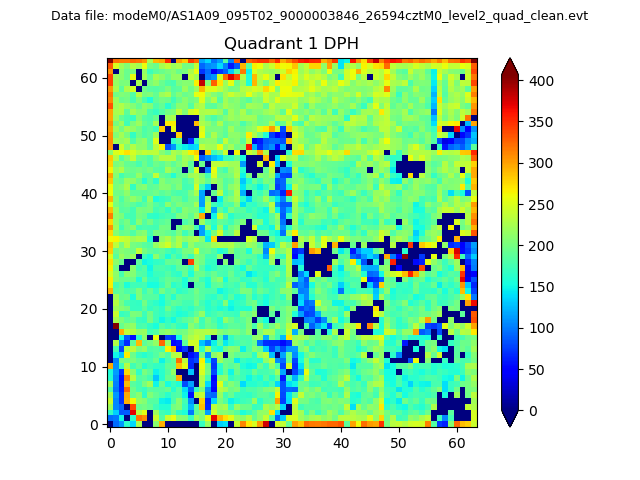 |
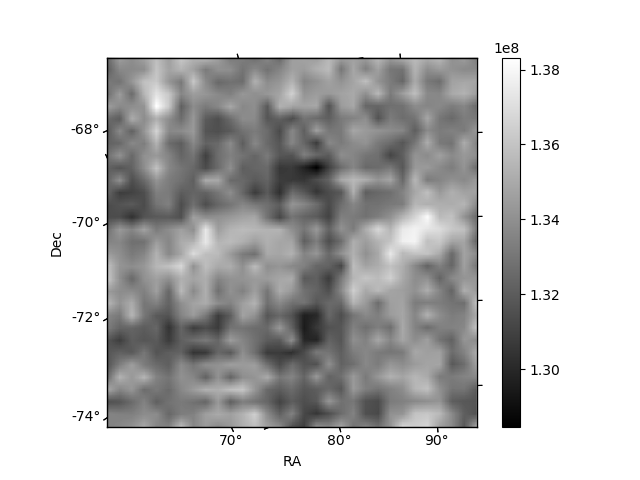
Quadrant B |
|---|---|---|---|
| Quadrant D | 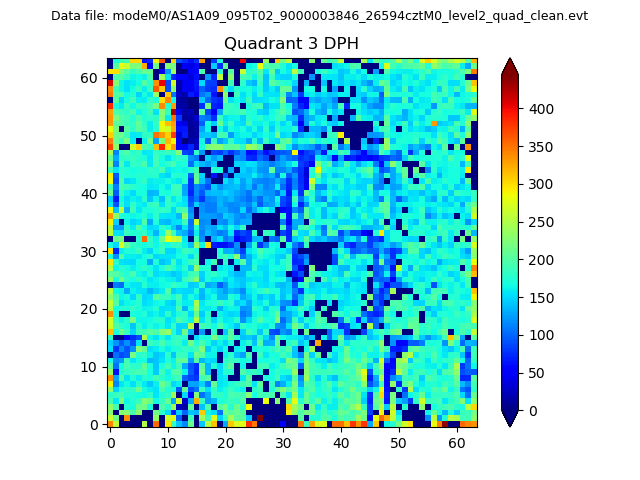 |
 |
Quadrant C |
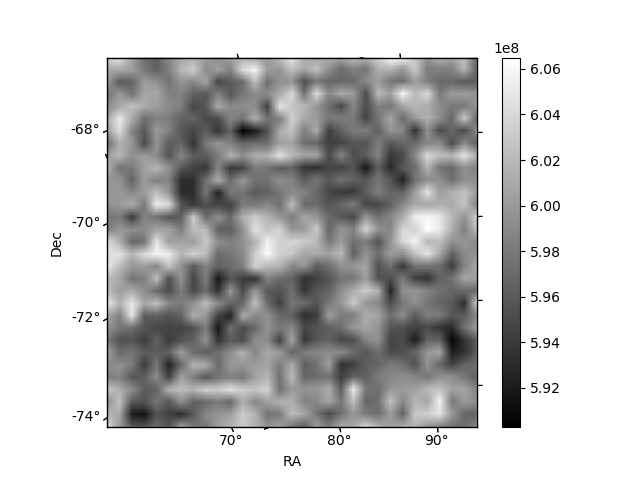
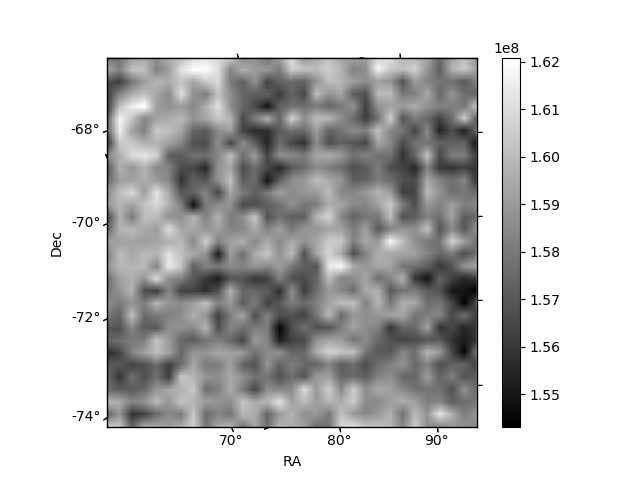
| Plot type | Count rate plots | Images |
|---|---|---|
| Comparison with Poisson distribution Blue bars denote a histogram of data divided into 1 sec bins. Red curve is a Poisson curve with rate = median count rate of data. |
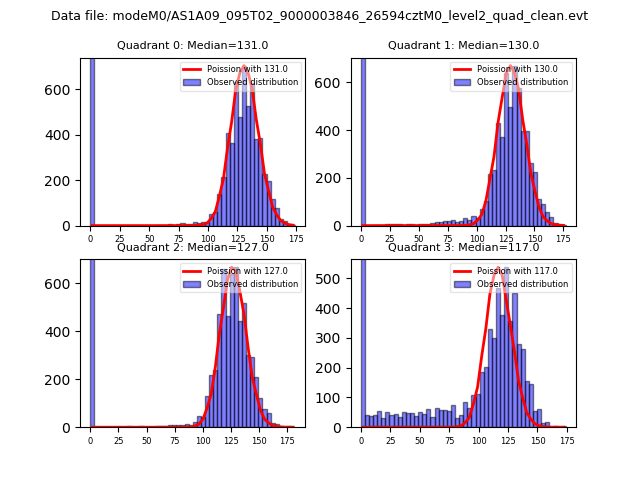 |
 |
| Quadrant-wise count rates Data is divided into 100 sec bins |
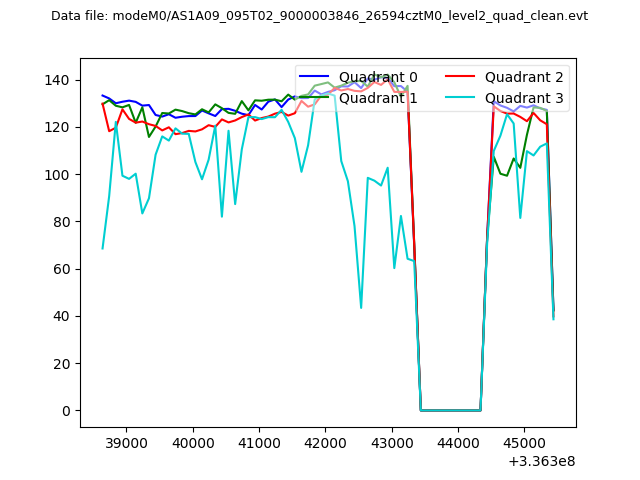 |
|
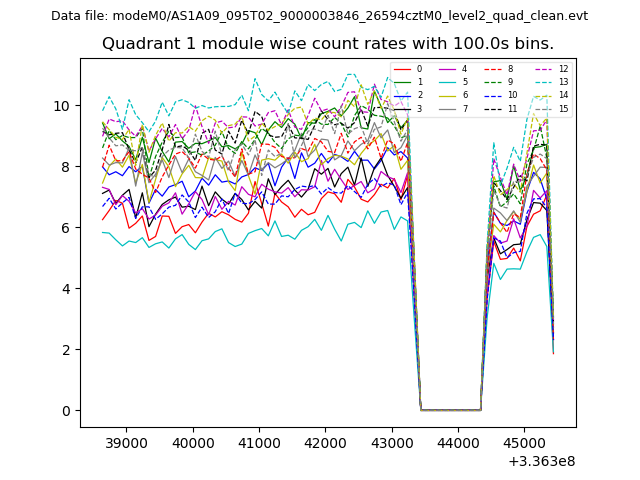
| Module-wise count rates for Quadrant A Data is divided into 100 sec bins |
 |
 |
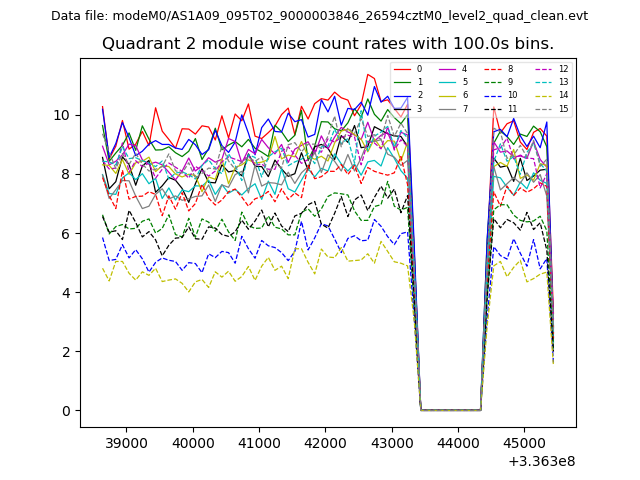
| Module-wise count rates for Quadrant B Data is divided into 100 sec bins |
 |
 |
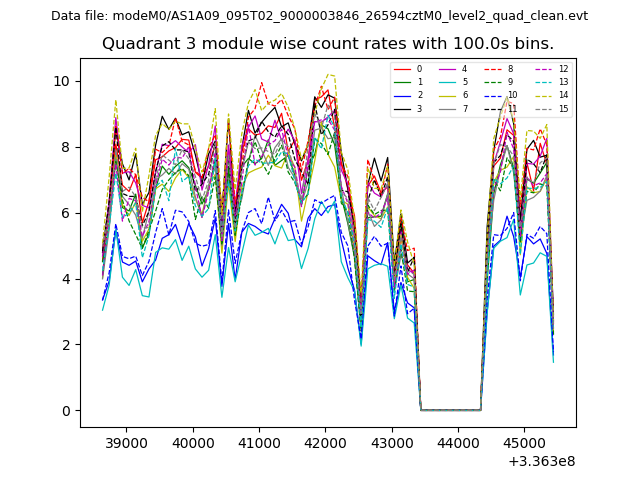
| Module-wise count rates for Quadrant C Data is divided into 100 sec bins |
 |
 |
| Module-wise count rates for Quadrant D Data is divided into 100 sec bins |
 |
 |
| Parameter | Plot |
|---|---|
| CZT HV Monitor |  |
| D_VDD | 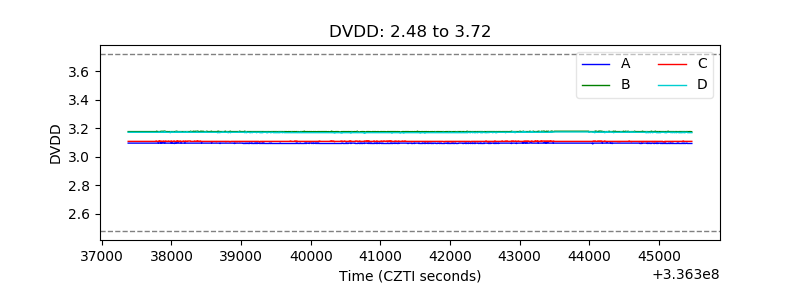 |
| Temperature 1 | 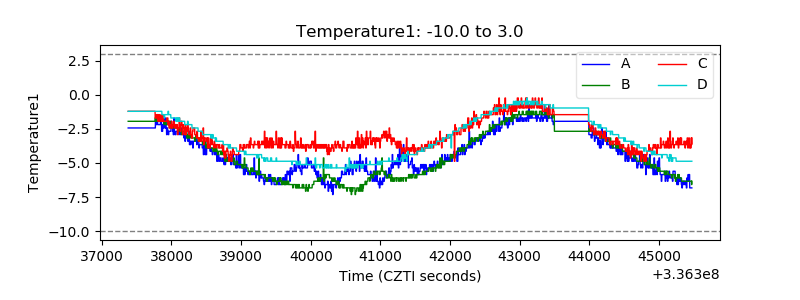 |
| Veto HV Monitor | 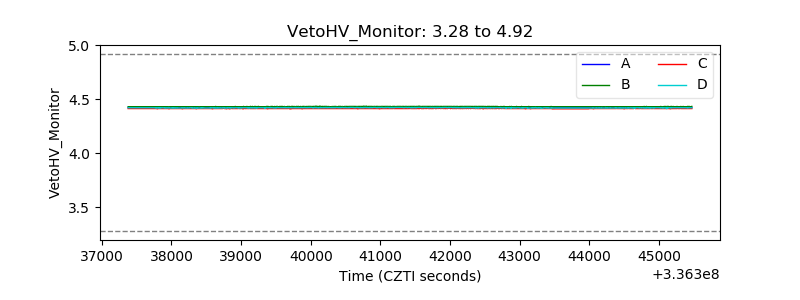 |
| Veto LLD | 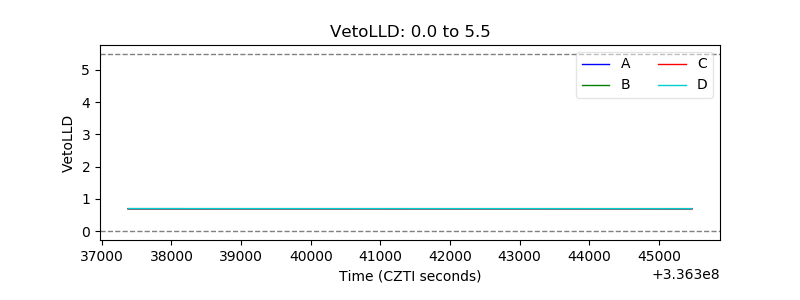 |
| Alpha Counter | 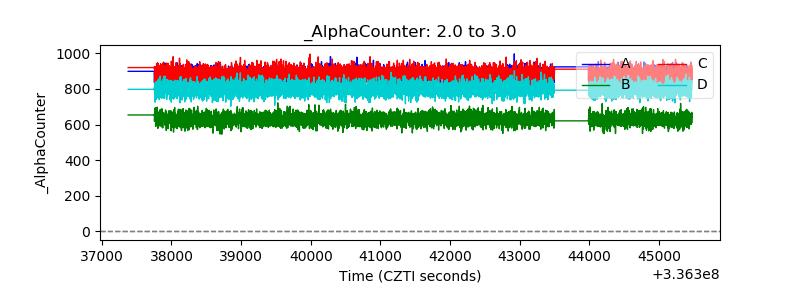 |
| _CPM_Rate |  |
| CZT Counter | 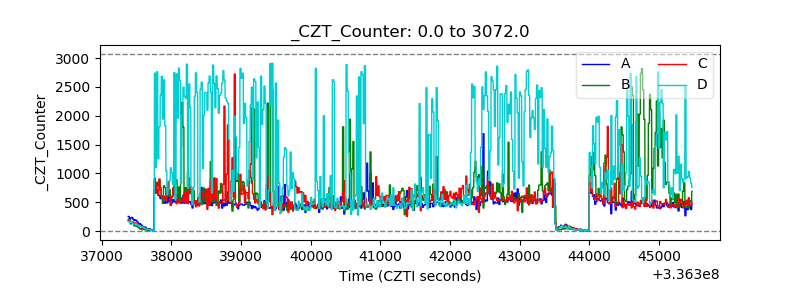 |
| +2.5 Volts monitor |  |
| +5 Volts monitor |  |
| _ROLL_ROT | 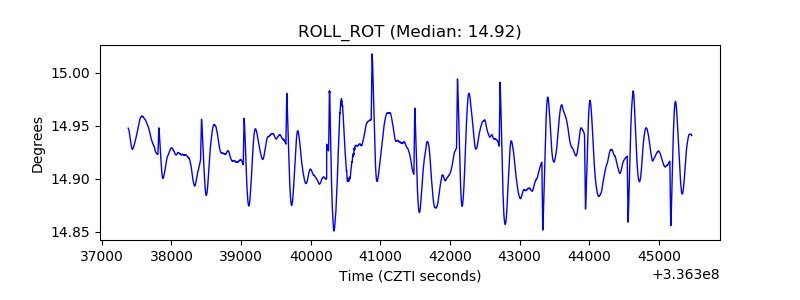 |
| _Roll_DEC | 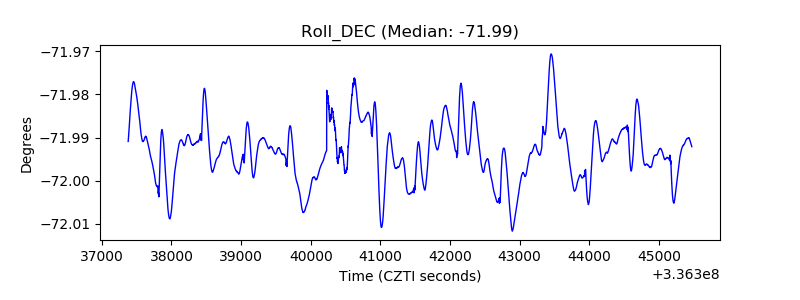 |
| _Roll_RA | 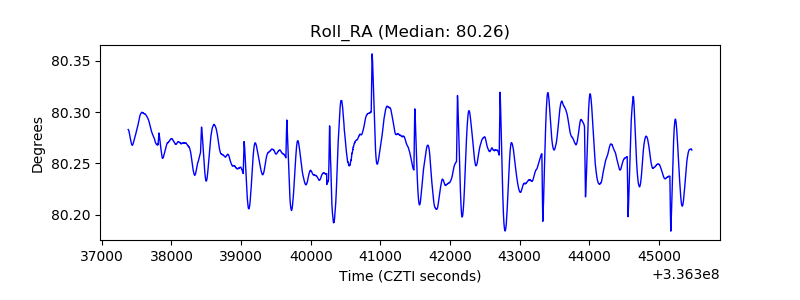 |
| Veto Counter | 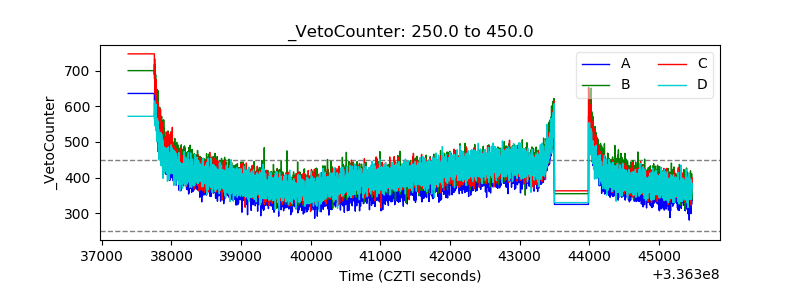 |