| Param | Original file | Final file |
|---|---|---|
| Filename | modeM0/AS1A09_095T02_9000003846_26595cztM0_level2.evt | modeM0/AS1A09_095T02_9000003846_26595cztM0_level2_quad_clean.evt |
| Size (bytes) | 736,369,920 | 114,583,680 |
| Size | 702.3 MB | 109.3 MB |
| Events in quadrant A | 3,344,073 | 784,369 |
| Events in quadrant B | 5,958,678 | 751,743 |
| Events in quadrant C | 4,374,043 | 758,625 |
| Events in quadrant D | 8,140,882 | 676,946 |
| Mode M9 | |||
|---|---|---|---|
| Quadrant | BADHDUFLAG | Total packets | Discarded packets |
| A | 0 | 3 | 0 |
| B | 0 | 3 | 0 |
| C | 0 | 3 | 0 |
| D | 0 | 3 | 0 |
| Mode M0 | |||
|---|---|---|---|
| Quadrant | BADHDUFLAG | Total packets | Discarded packets |
| A | 0 | 14650 | 0 |
| B | 0 | 22452 | 0 |
| C | 0 | 17707 | 0 |
| D | 0 | 29028 | 0 |
| Quadrant | Total seconds | Saturated seconds | Saturation percentage |
|---|---|---|---|
| A | 7147 | 12 | 0.167903% |
| B | 7148 | 699 | 9.778959% |
| C | 7147 | 164 | 2.294669% |
| D | 7147 | 1547 | 21.645446% |
Noise dominated data is calculated using 1-second bins in cleaned event files. If a bin has >2000 counts, and if more than 50% of those come from <1% of pixels, then it is considered to be noise-dominated and hence unusable.
| Quadrant | # 1 sec bins | Bins with >0 counts | Bins with >2000 counts | High rate bins dominated by noise | Noise dominated (total time) | Noise dominated (detector-on time) | Marked lightcurve |
|---|---|---|---|---|---|---|---|
| A | 7507 | 7148 | 0 | 0 | 0.00% | 0.00% | 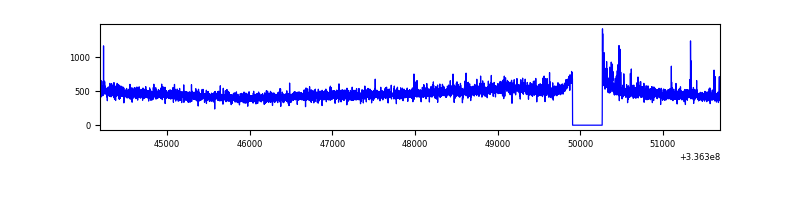 |
| B | 7508 | 7149 | 558 | 558 | 7.43% | 7.81% | 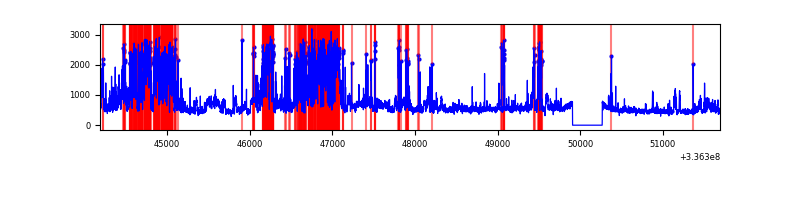 |
| C | 7507 | 7148 | 36 | 36 | 0.48% | 0.50% | 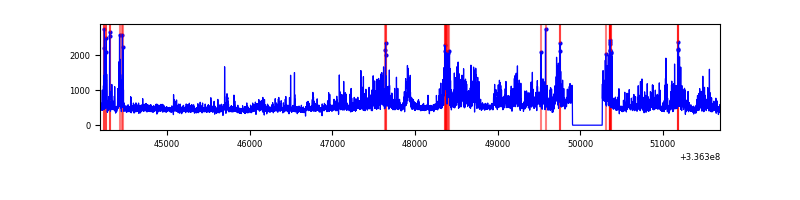 |
| D | 7507 | 7147 | 1464 | 1464 | 19.50% | 20.48% | 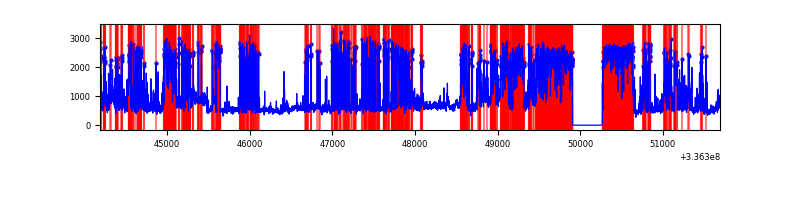 |
Top three noisy pixels from each quadrant. If the there are fewer than three noisy pixels in the level2.evt file, extra rows are filled as -1
| Pixel properties | Quadrant properties | ||||||
|---|---|---|---|---|---|---|---|
| Quadrant | DetID | PixID | Counts | Sigma | Mean | Median | Sigma |
| A | 0 | 13 | 78902 | 459.25 | 844 | 826 | 170.0 |
| A | 13 | 254 | 10231 | 55.32 | 844 | 826 | 170.0 |
| A | 3 | 137 | 7898 | 41.6 | 844 | 826 | 170.0 |
| B | 3 | 64 | 2019117 | 13051.13 | 815 | 795 | 154.6 |
| B | 0 | 189 | 715950 | 4624.43 | 815 | 795 | 154.6 |
| B | 12 | 111 | 18852 | 116.76 | 815 | 795 | 154.6 |
| C | 3 | 233 | 925897 | 4933.47 | 804 | 809 | 187.5 |
| C | 15 | 208 | 175331 | 930.72 | 804 | 809 | 187.5 |
| C | 14 | 238 | 130030 | 689.13 | 804 | 809 | 187.5 |
| D | 7 | 80 | 2350399 | 13323.42 | 725 | 704 | 176.4 |
| D | 2 | 250 | 1180168 | 6687.89 | 725 | 704 | 176.4 |
| D | 12 | 1 | 935051 | 5298.0 | 725 | 704 | 176.4 |
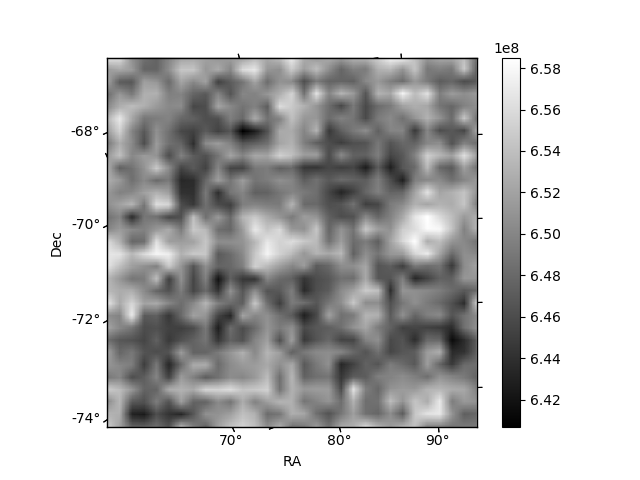
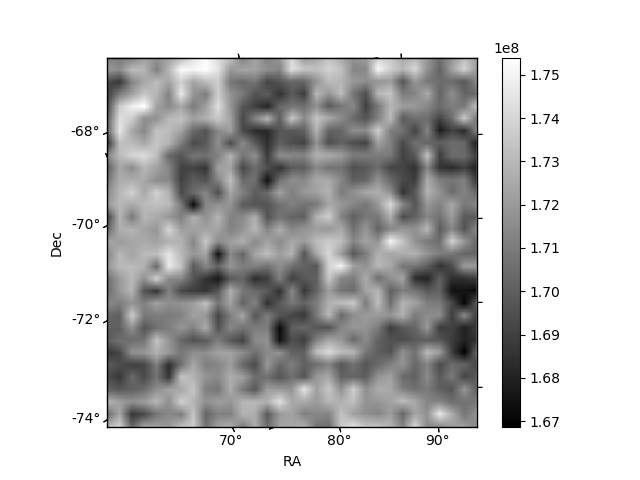
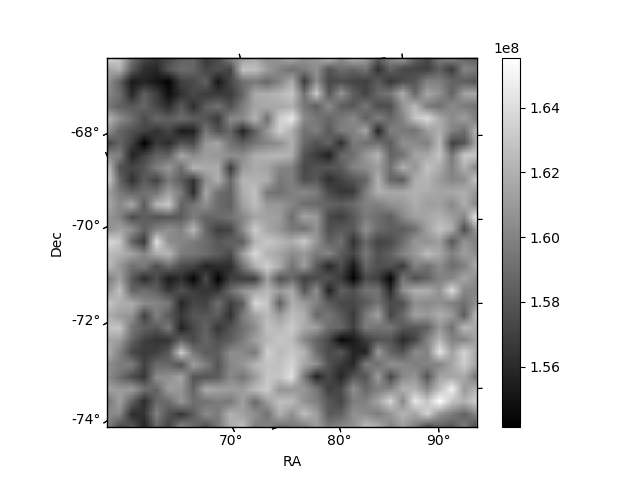
Histogram calculated using DETX and DETY for each event in the final _common_clean file
| Quadrant A | 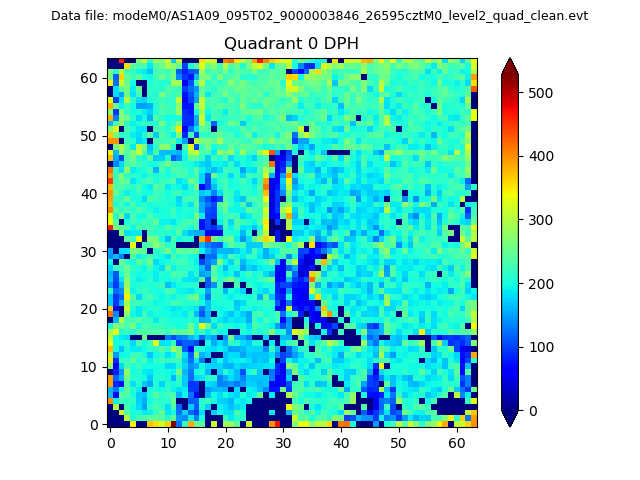 |
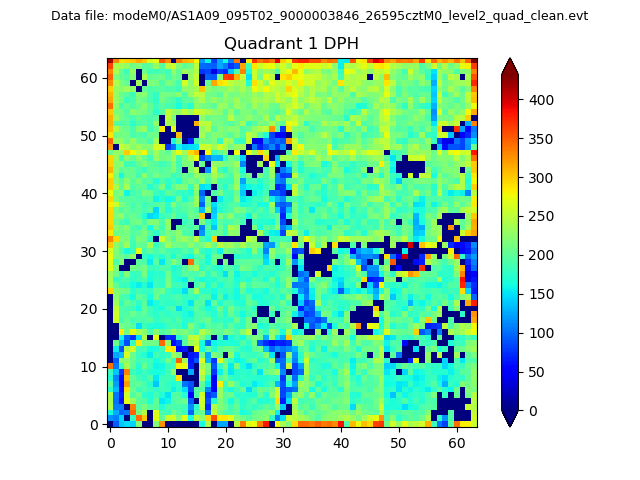 |
Quadrant B |
|---|---|---|---|
| Quadrant D | 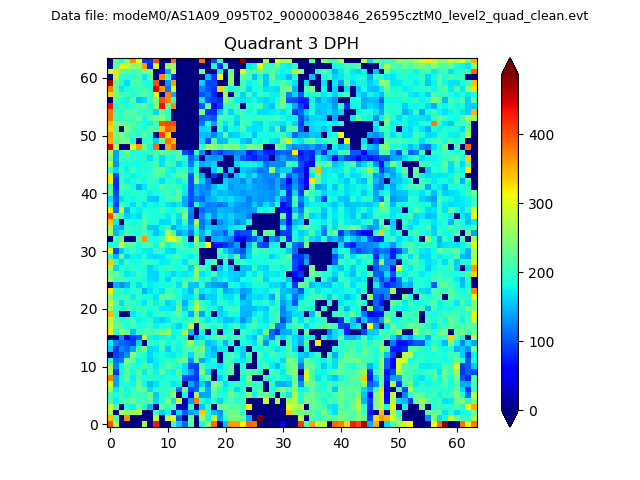 |
 |
Quadrant C |
| Plot type | Count rate plots | Images |
|---|---|---|
| Comparison with Poisson distribution Blue bars denote a histogram of data divided into 1 sec bins. Red curve is a Poisson curve with rate = median count rate of data. |
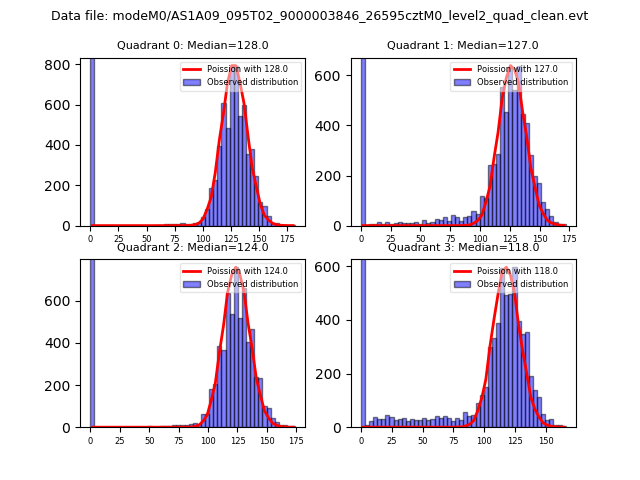 |
 |
| Quadrant-wise count rates Data is divided into 100 sec bins |
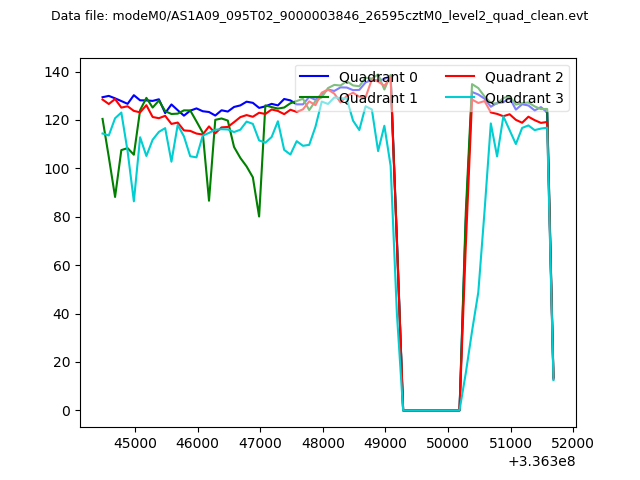 |
|
| Module-wise count rates for Quadrant A Data is divided into 100 sec bins |
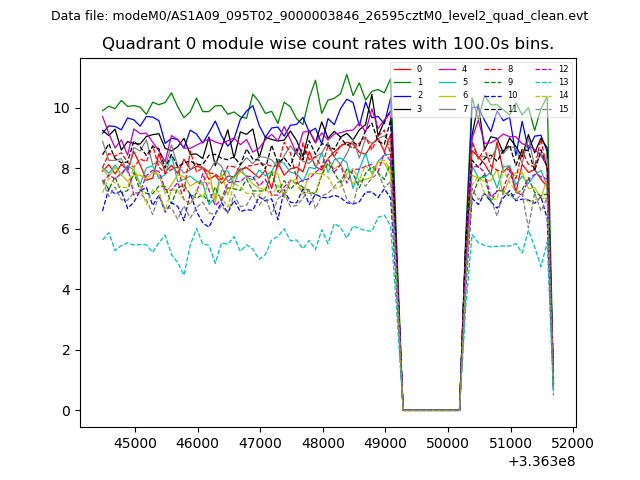 |
 |
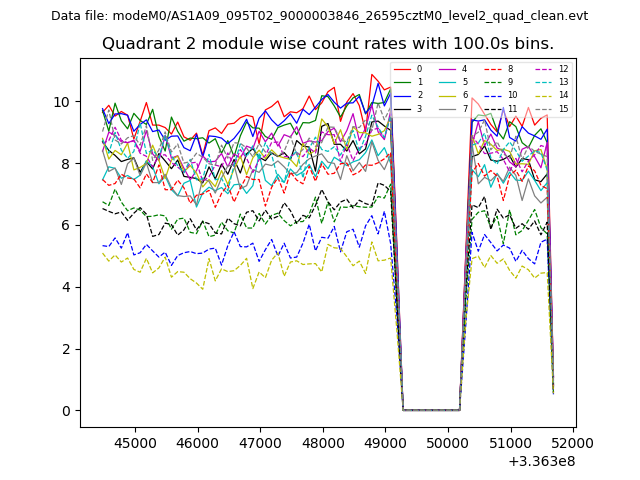
| Module-wise count rates for Quadrant B Data is divided into 100 sec bins |
 |
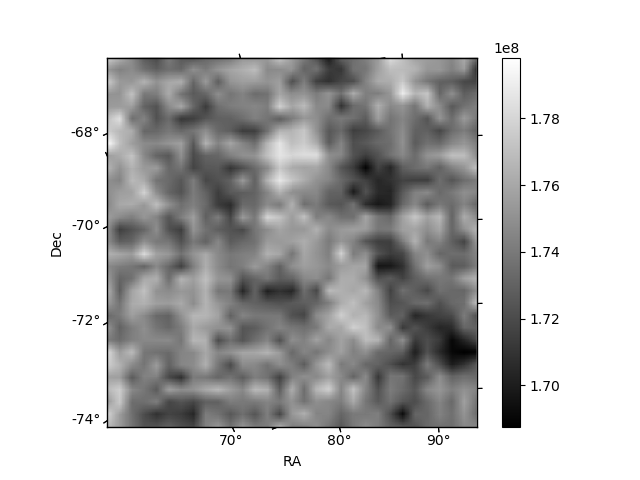 |
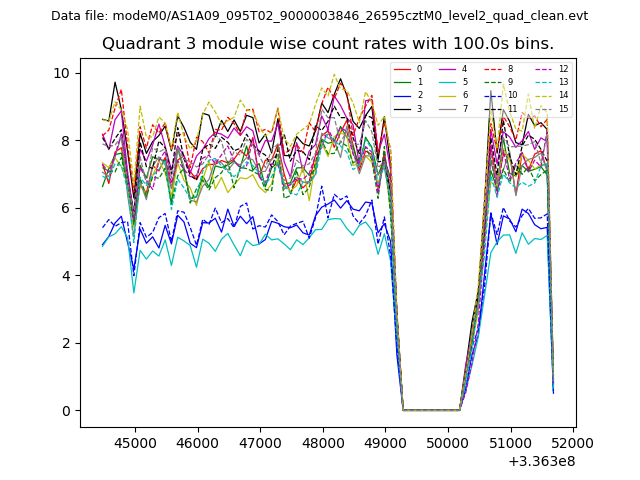
| Module-wise count rates for Quadrant C Data is divided into 100 sec bins |
 |
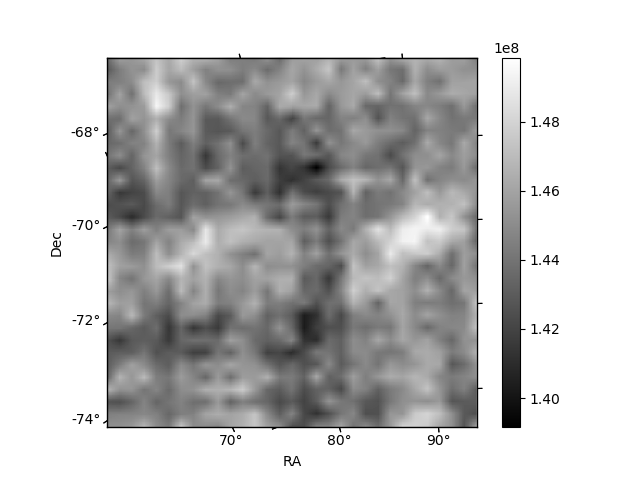 |
| Module-wise count rates for Quadrant D Data is divided into 100 sec bins |
 |
 |
| Parameter | Plot |
|---|---|
| CZT HV Monitor |  |
| D_VDD | 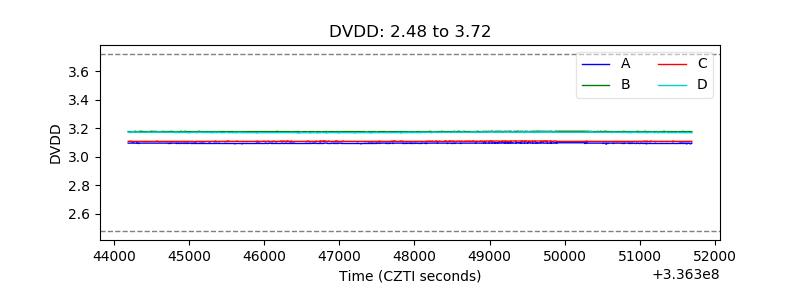 |
| Temperature 1 | 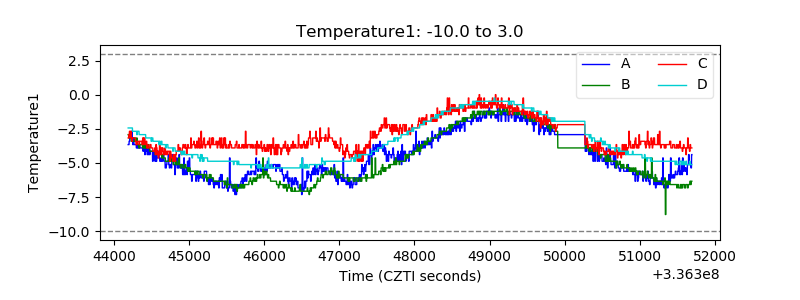 |
| Veto HV Monitor |  |
| Veto LLD | 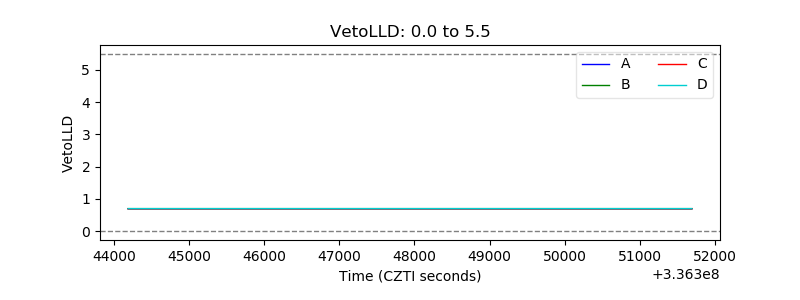 |
| Alpha Counter | 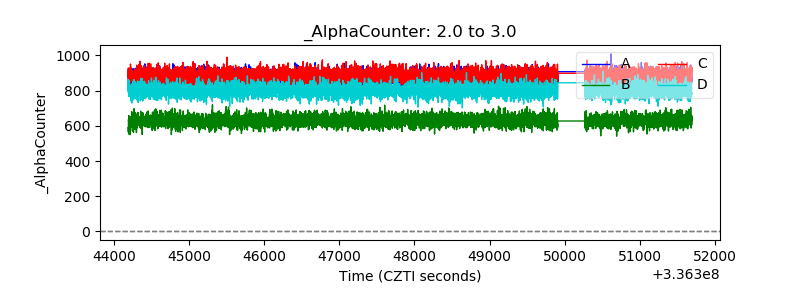 |
| _CPM_Rate | 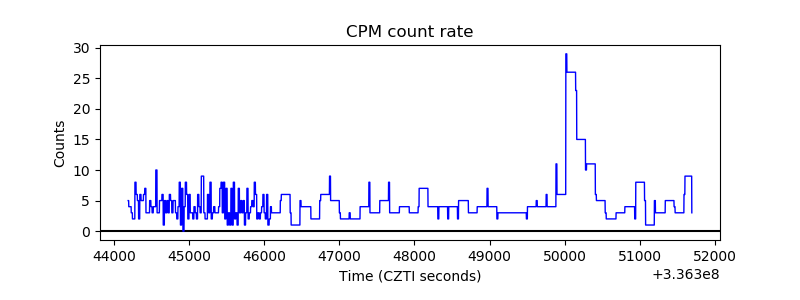 |
| CZT Counter | 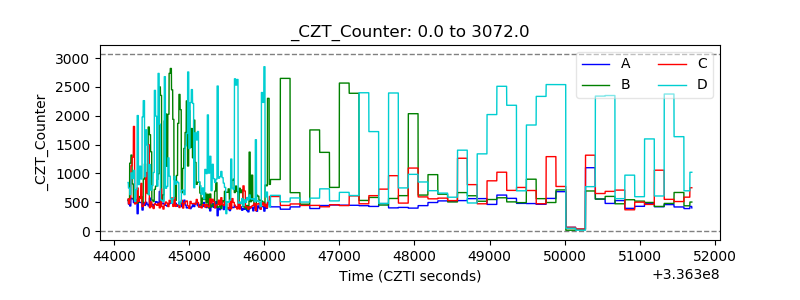 |
| +2.5 Volts monitor | 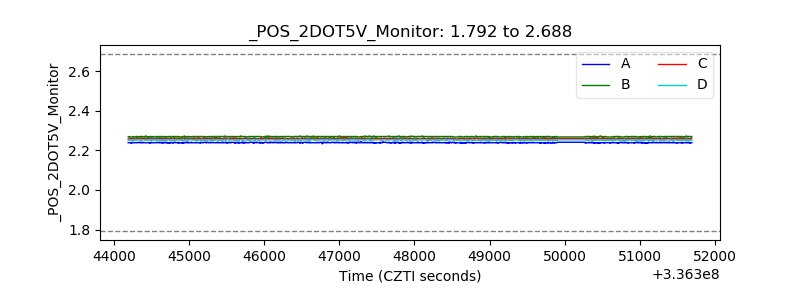 |
| +5 Volts monitor |  |
| _ROLL_ROT |  |
| _Roll_DEC | 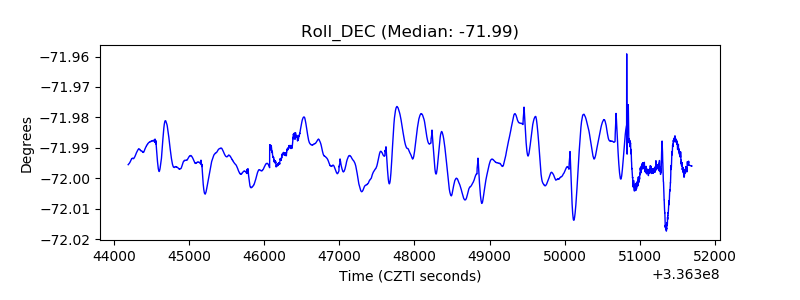 |
| _Roll_RA | 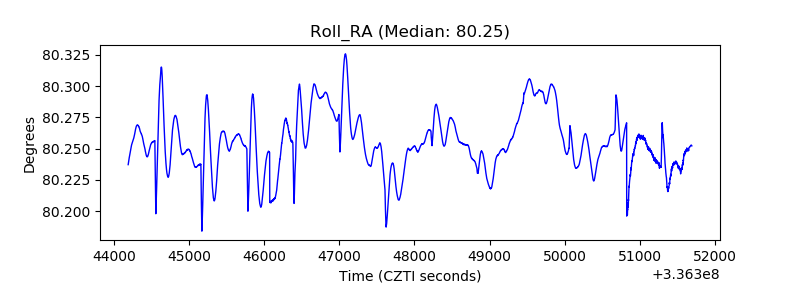 |
| Veto Counter |  |