| Param | Original file | Final file |
|---|---|---|
| Filename | modeM0/AS1A09_095T02_9000003846_26596cztM0_level2.evt | modeM0/AS1A09_095T02_9000003846_26596cztM0_level2_quad_clean.evt |
| Size (bytes) | 750,556,800 | 119,721,600 |
| Size | 715.8 MB | 114.2 MB |
| Events in quadrant A | 3,780,640 | 801,737 |
| Events in quadrant B | 4,938,590 | 810,100 |
| Events in quadrant C | 5,150,726 | 775,253 |
| Events in quadrant D | 8,351,406 | 713,892 |
| Mode M9 | |||
|---|---|---|---|
| Quadrant | BADHDUFLAG | Total packets | Discarded packets |
| A | 0 | 5 | 0 |
| B | 0 | 6 | 0 |
| C | 0 | 6 | 0 |
| D | 0 | 6 | 0 |
| Mode M0 | |||
|---|---|---|---|
| Quadrant | BADHDUFLAG | Total packets | Discarded packets |
| A | 0 | 16317 | 0 |
| B | 0 | 19966 | 0 |
| C | 0 | 20321 | 0 |
| D | 0 | 29944 | 0 |
| Quadrant | Total seconds | Saturated seconds | Saturation percentage |
|---|---|---|---|
| A | 7535 | 87 | 1.154612% |
| B | 7535 | 176 | 2.335766% |
| C | 7535 | 355 | 4.711347% |
| D | 7535 | 1388 | 18.420703% |
Noise dominated data is calculated using 1-second bins in cleaned event files. If a bin has >2000 counts, and if more than 50% of those come from <1% of pixels, then it is considered to be noise-dominated and hence unusable.
| Quadrant | # 1 sec bins | Bins with >0 counts | Bins with >2000 counts | High rate bins dominated by noise | Noise dominated (total time) | Noise dominated (detector-on time) | Marked lightcurve |
|---|---|---|---|---|---|---|---|
| A | 7945 | 7536 | 40 | 40 | 0.50% | 0.53% |  |
| B | 7945 | 7535 | 61 | 61 | 0.77% | 0.81% |  |
| C | 7945 | 7535 | 105 | 105 | 1.32% | 1.39% |  |
| D | 7945 | 7535 | 1300 | 1300 | 16.36% | 17.25% |  |
Top three noisy pixels from each quadrant. If the there are fewer than three noisy pixels in the level2.evt file, extra rows are filled as -1
| Pixel properties | Quadrant properties | ||||||
|---|---|---|---|---|---|---|---|
| Quadrant | DetID | PixID | Counts | Sigma | Mean | Median | Sigma |
| A | 12 | 96 | 260035 | 1450.88 | 885 | 865 | 178.6 |
| A | 0 | 13 | 99105 | 549.96 | 885 | 865 | 178.6 |
| A | 13 | 254 | 11295 | 58.39 | 885 | 865 | 178.6 |
| B | 0 | 189 | 951497 | 5707.69 | 882 | 857 | 166.6 |
| B | 3 | 64 | 472615 | 2832.46 | 882 | 857 | 166.6 |
| B | 5 | 172 | 23778 | 137.62 | 882 | 857 | 166.6 |
| C | 3 | 233 | 1292773 | 6493.09 | 847 | 851 | 199.0 |
| C | 15 | 208 | 413282 | 2072.84 | 847 | 851 | 199.0 |
| C | 14 | 238 | 135792 | 678.2 | 847 | 851 | 199.0 |
| D | 7 | 80 | 2862758 | 15098.12 | 780 | 757 | 189.6 |
| D | 2 | 250 | 1214639 | 6403.68 | 780 | 757 | 189.6 |
| D | 1 | 52 | 581053 | 3061.28 | 780 | 757 | 189.6 |
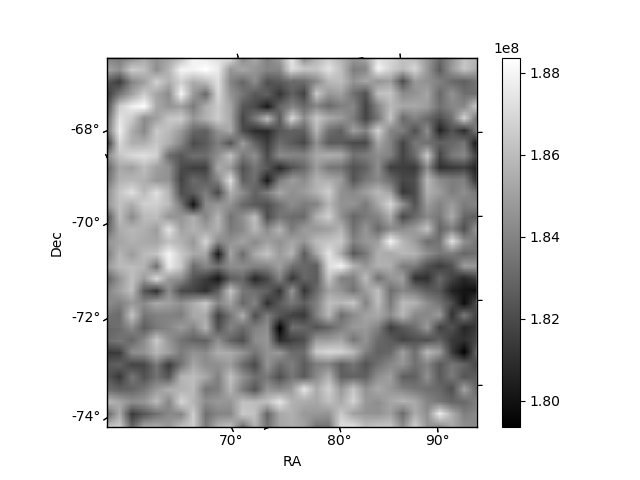
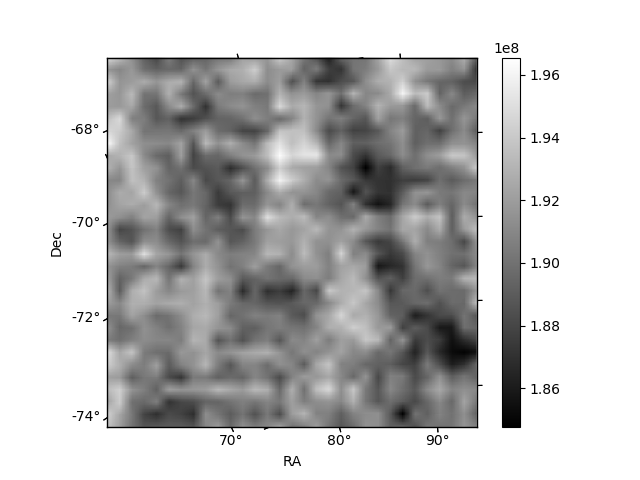
Histogram calculated using DETX and DETY for each event in the final _common_clean file
| Quadrant A | 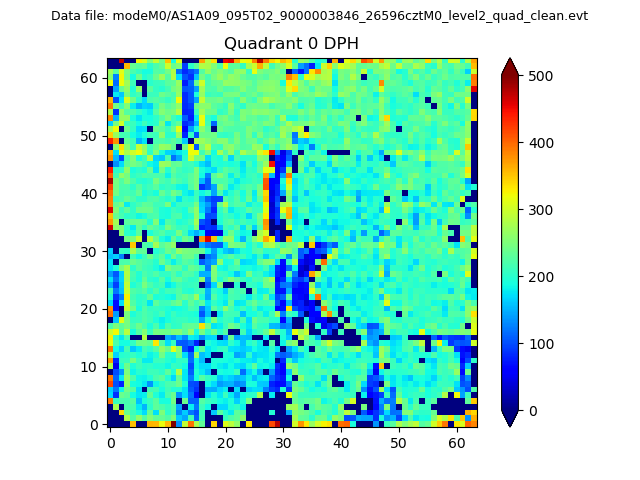 |
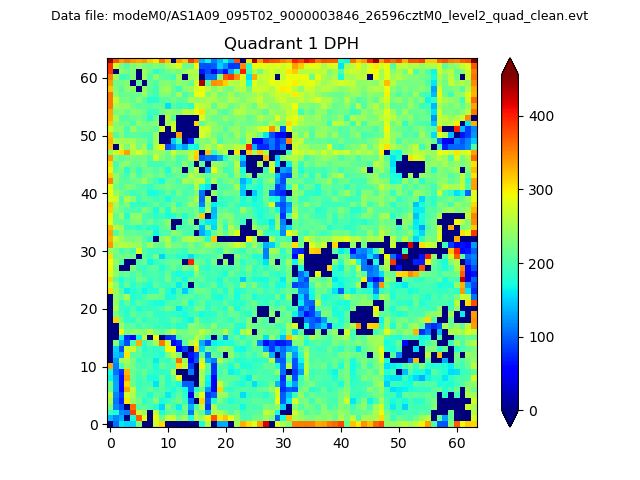 |
Quadrant B |
|---|---|---|---|
| Quadrant D | 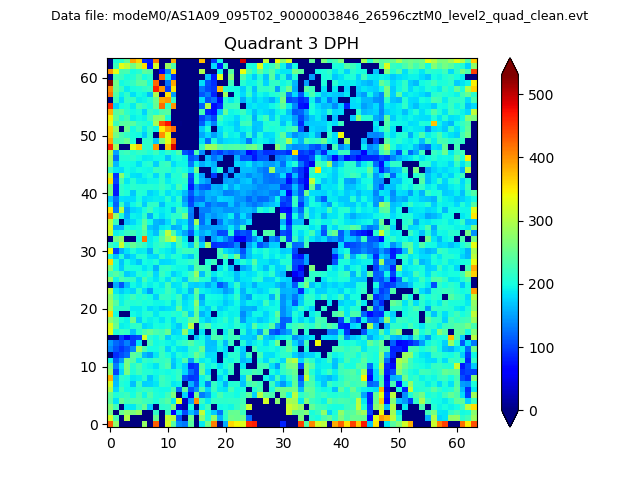 |
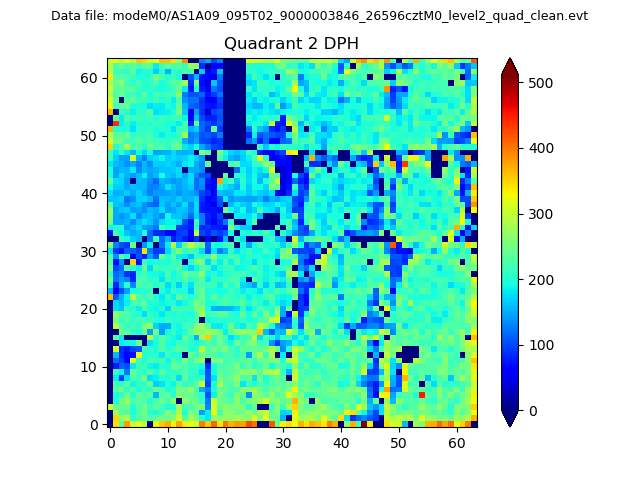 |
Quadrant C |
| Plot type | Count rate plots | Images |
|---|---|---|
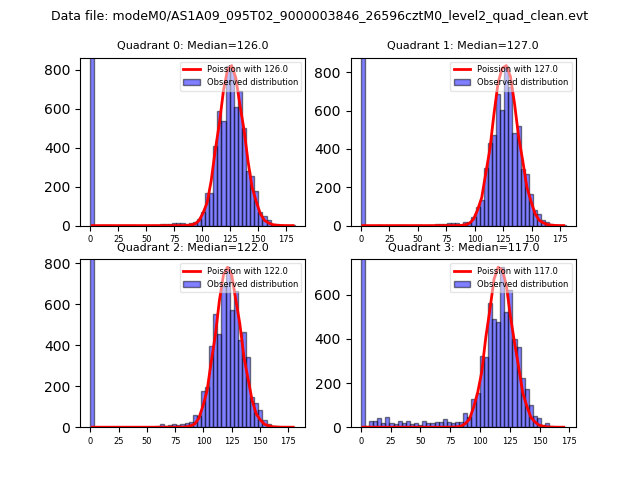
| Comparison with Poisson distribution Blue bars denote a histogram of data divided into 1 sec bins. Red curve is a Poisson curve with rate = median count rate of data. |
 |
 |
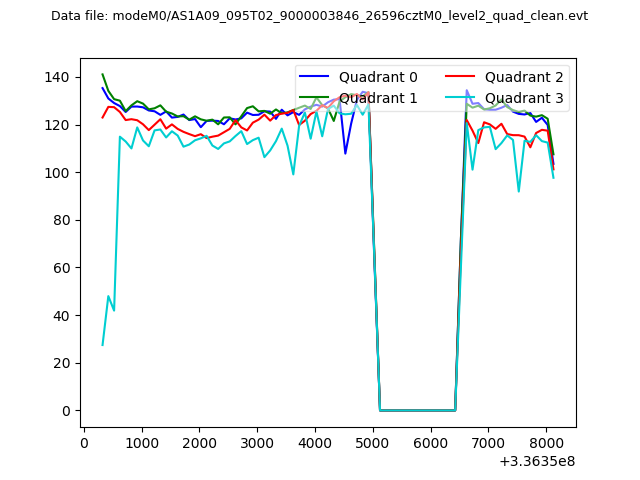
| Quadrant-wise count rates Data is divided into 100 sec bins |
 |
|
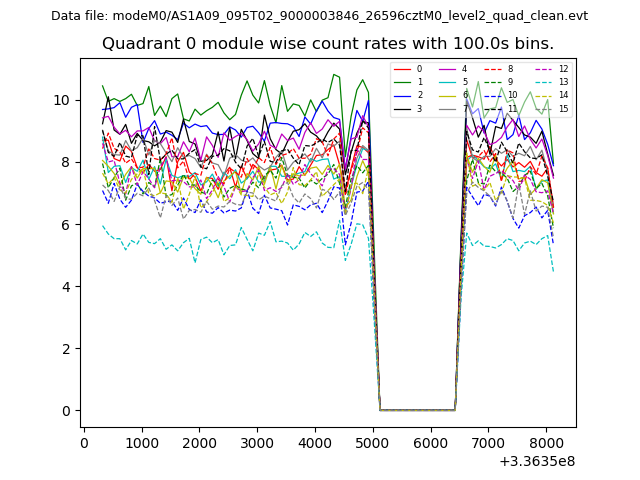
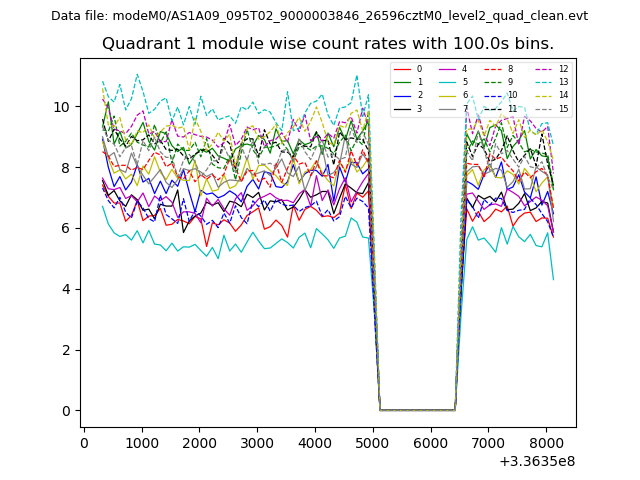
| Module-wise count rates for Quadrant A Data is divided into 100 sec bins |
 |
 |
| Module-wise count rates for Quadrant B Data is divided into 100 sec bins |
 |
 |
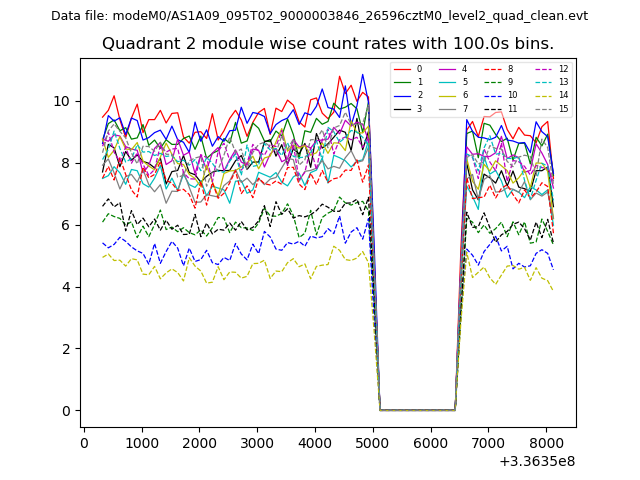
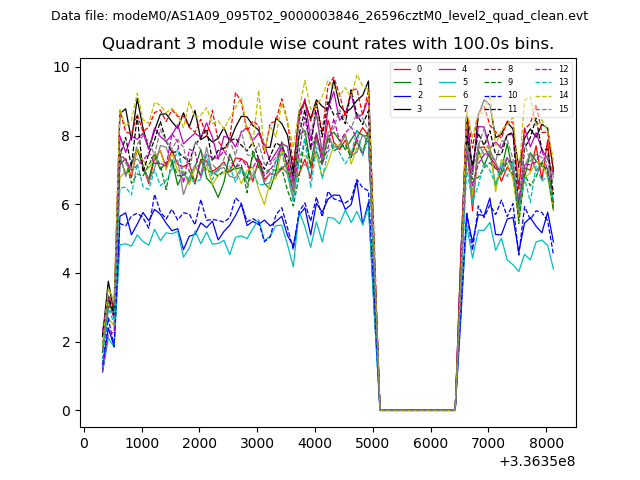
| Module-wise count rates for Quadrant C Data is divided into 100 sec bins |
 |
 |
| Module-wise count rates for Quadrant D Data is divided into 100 sec bins |
 |
 |
| Parameter | Plot |
|---|---|
| CZT HV Monitor | 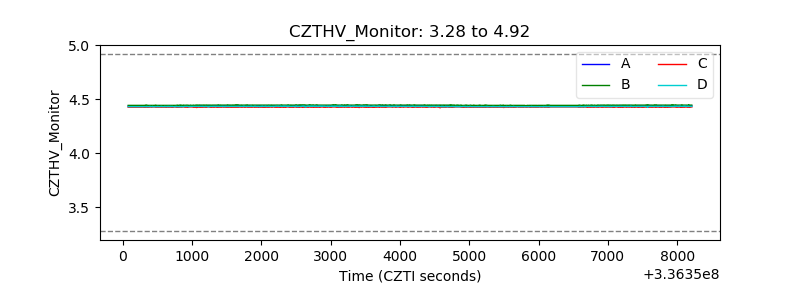 |
| D_VDD | 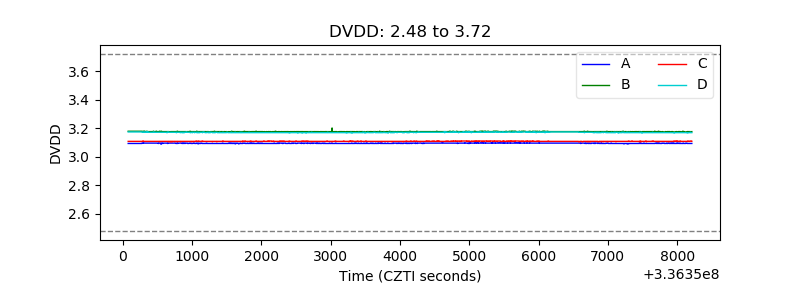 |
| Temperature 1 | 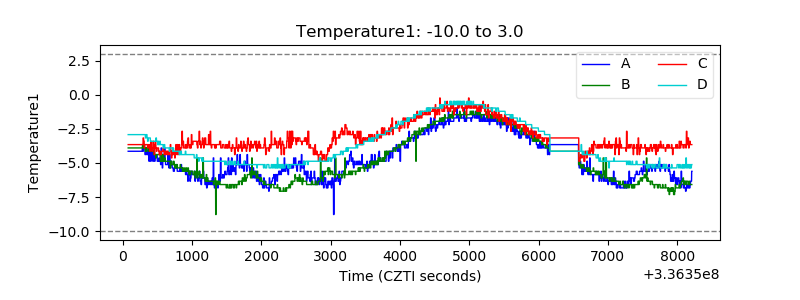 |
| Veto HV Monitor | 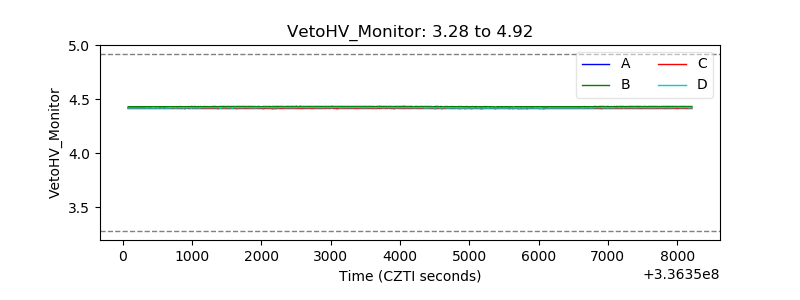 |
| Veto LLD | 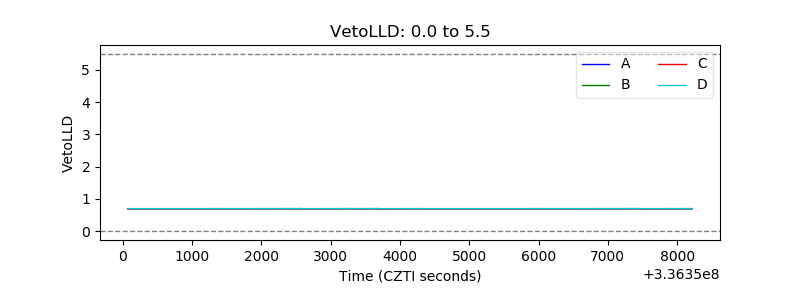 |
| Alpha Counter | 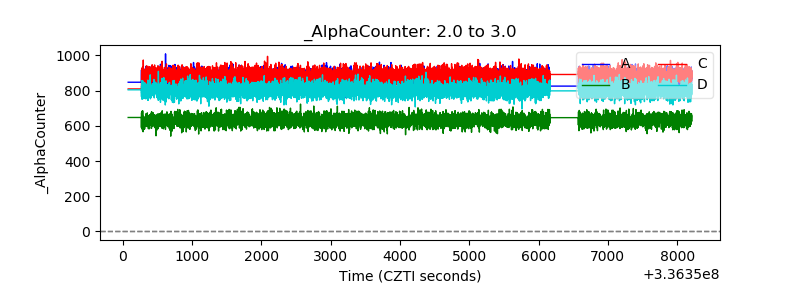 |
| _CPM_Rate | 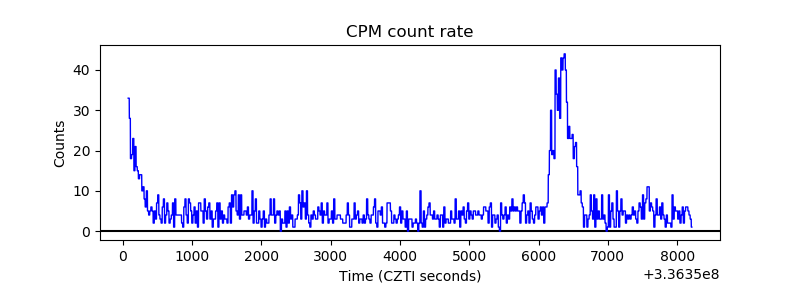 |
| CZT Counter | 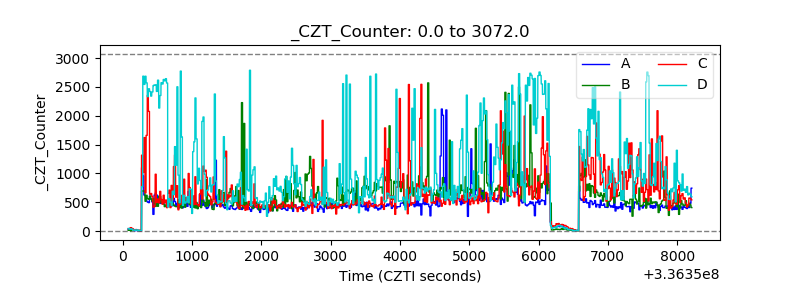 |
| +2.5 Volts monitor |  |
| +5 Volts monitor | 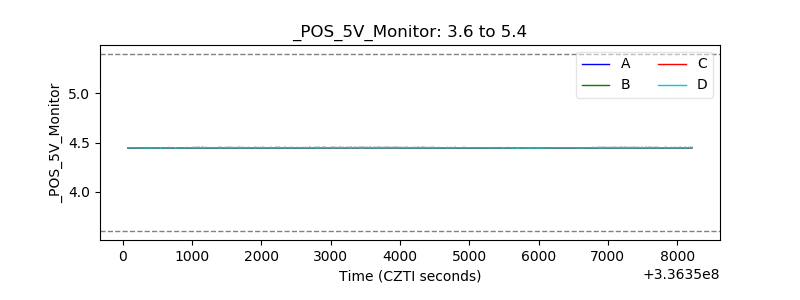 |
| _ROLL_ROT | 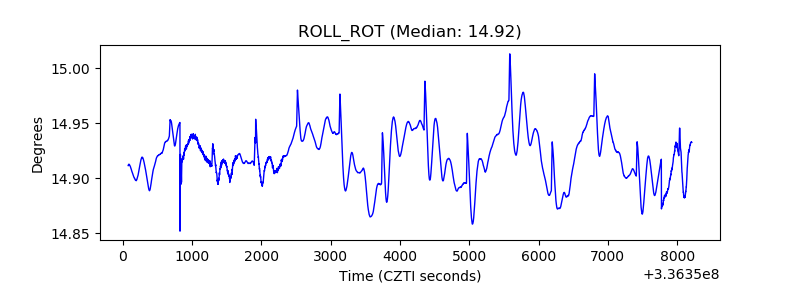 |
| _Roll_DEC | 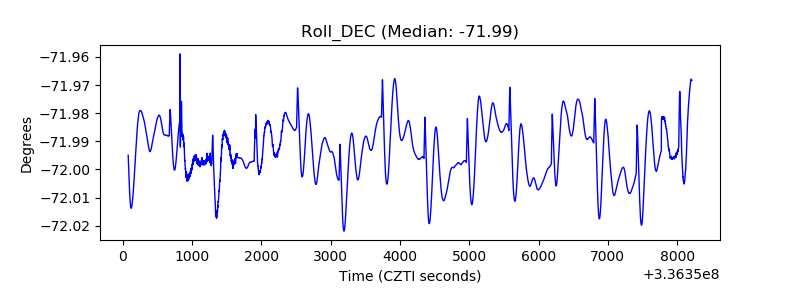 |
| _Roll_RA | 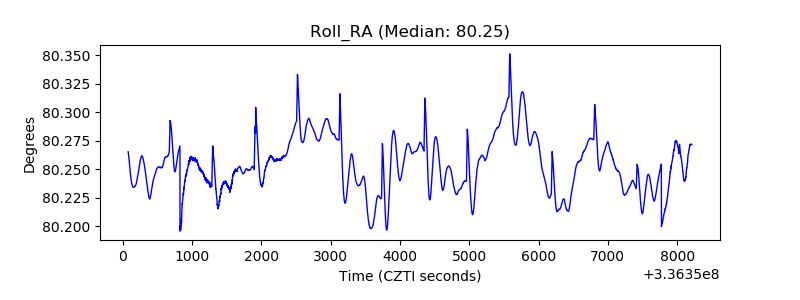 |
| Veto Counter | 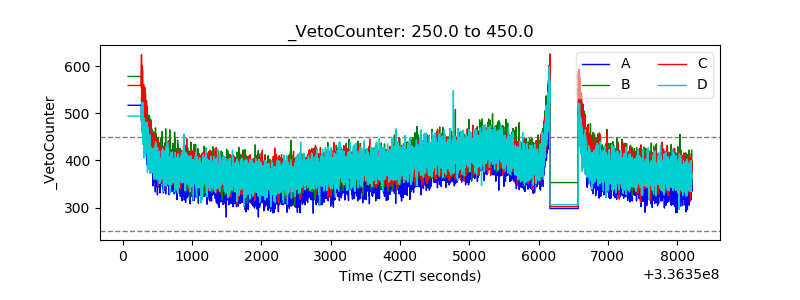 |