| Param | Original file | Final file |
|---|---|---|
| Filename | modeM0/AS1A09_095T02_9000003846_26600cztM0_level2.evt | modeM0/AS1A09_095T02_9000003846_26600cztM0_level2_quad_clean.evt |
| Size (bytes) | 958,705,920 | 140,662,080 |
| Size | 914.3 MB | 134.1 MB |
| Events in quadrant A | 4,084,595 | 957,914 |
| Events in quadrant B | 7,818,513 | 936,689 |
| Events in quadrant C | 5,501,453 | 931,524 |
| Events in quadrant D | 11,030,241 | 815,666 |
| Mode M9 | |||
|---|---|---|---|
| Quadrant | BADHDUFLAG | Total packets | Discarded packets |
| A | 0 | 9 | 0 |
| B | 0 | 9 | 0 |
| C | 0 | 9 | 0 |
| D | 0 | 9 | 0 |
| Mode M0 | |||
|---|---|---|---|
| Quadrant | BADHDUFLAG | Total packets | Discarded packets |
| A | 0 | 18135 | 0 |
| B | 0 | 29189 | 0 |
| C | 0 | 21994 | 0 |
| D | 0 | 39293 | 0 |
| Quadrant | Total seconds | Saturated seconds | Saturation percentage |
|---|---|---|---|
| A | 8889 | 44 | 0.494994% |
| B | 8890 | 1146 | 12.890889% |
| C | 8890 | 271 | 3.048369% |
| D | 8889 | 1656 | 18.629767% |
Noise dominated data is calculated using 1-second bins in cleaned event files. If a bin has >2000 counts, and if more than 50% of those come from <1% of pixels, then it is considered to be noise-dominated and hence unusable.
| Quadrant | # 1 sec bins | Bins with >0 counts | Bins with >2000 counts | High rate bins dominated by noise | Noise dominated (total time) | Noise dominated (detector-on time) | Marked lightcurve |
|---|---|---|---|---|---|---|---|
| A | 9839 | 8891 | 3 | 3 | 0.03% | 0.03% | 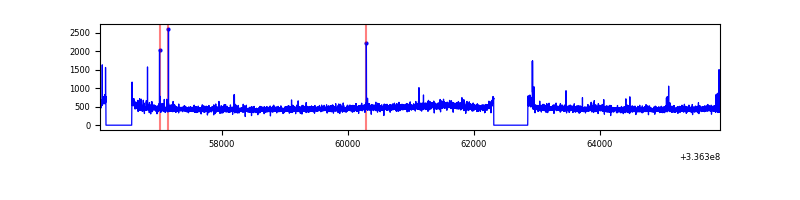 |
| B | 9840 | 8891 | 654 | 654 | 6.65% | 7.36% | 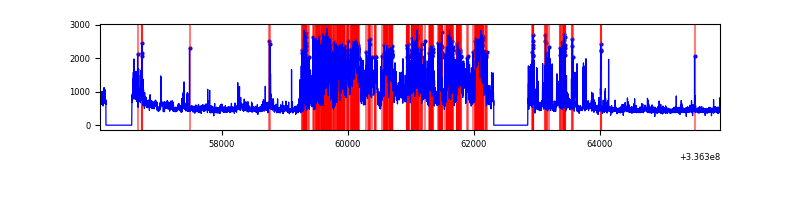 |
| C | 9840 | 8890 | 48 | 48 | 0.49% | 0.54% | 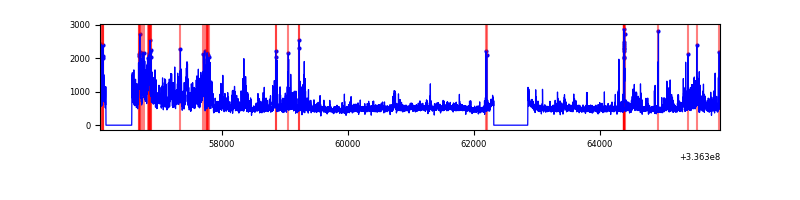 |
| D | 9838 | 8888 | 1591 | 1591 | 16.17% | 17.90% | 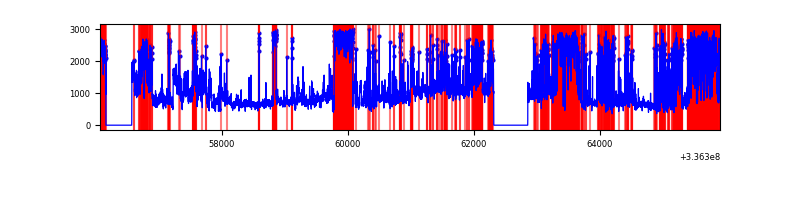 |
Top three noisy pixels from each quadrant. If the there are fewer than three noisy pixels in the level2.evt file, extra rows are filled as -1
| Pixel properties | Quadrant properties | ||||||
|---|---|---|---|---|---|---|---|
| Quadrant | DetID | PixID | Counts | Sigma | Mean | Median | Sigma |
| A | 12 | 96 | 55095 | 258.86 | 1040 | 1016 | 208.9 |
| A | 13 | 254 | 13871 | 61.53 | 1040 | 1016 | 208.9 |
| A | 12 | 189 | 13789 | 61.14 | 1040 | 1016 | 208.9 |
| B | 3 | 64 | 3225150 | 16962.3 | 996 | 969 | 190.1 |
| B | 0 | 189 | 608054 | 3193.85 | 996 | 969 | 190.1 |
| B | 15 | 222 | 31301 | 159.58 | 996 | 969 | 190.1 |
| C | 3 | 233 | 1253816 | 5362.7 | 1004 | 1008 | 233.6 |
| C | 14 | 238 | 161049 | 685.06 | 1004 | 1008 | 233.6 |
| C | 15 | 208 | 151649 | 644.83 | 1004 | 1008 | 233.6 |
| D | 7 | 80 | 5418974 | 22368.95 | 922 | 901 | 242.2 |
| D | 1 | 52 | 1743813 | 7195.75 | 922 | 901 | 242.2 |
| D | 2 | 250 | 309908 | 1275.76 | 922 | 901 | 242.2 |
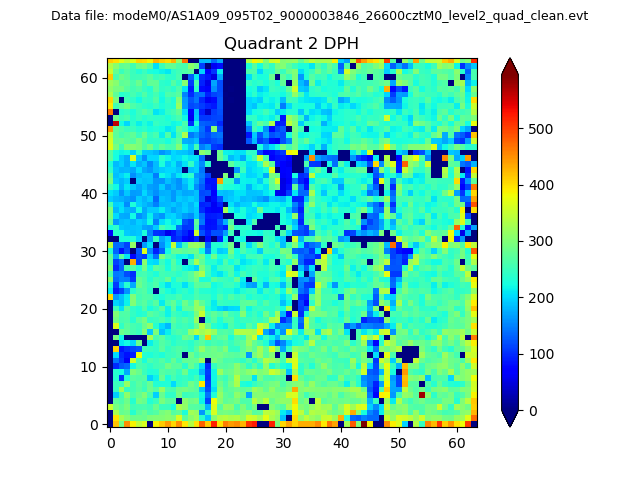
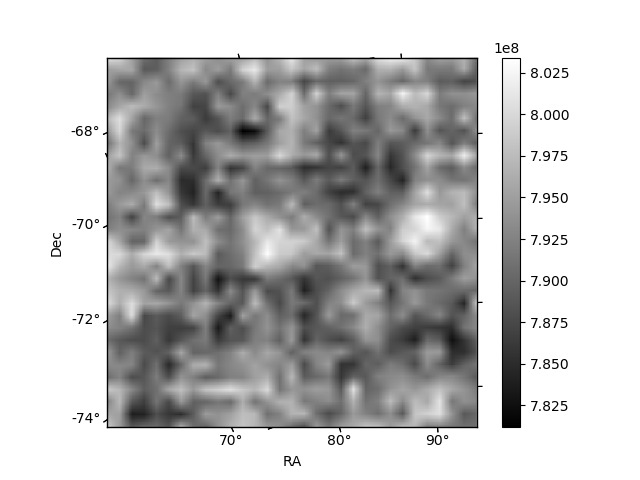
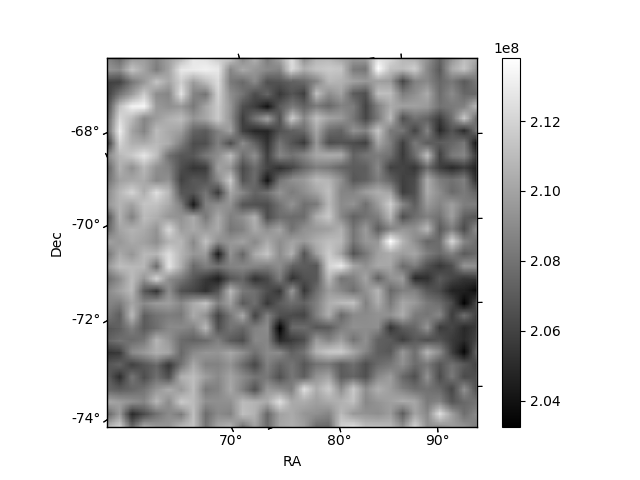
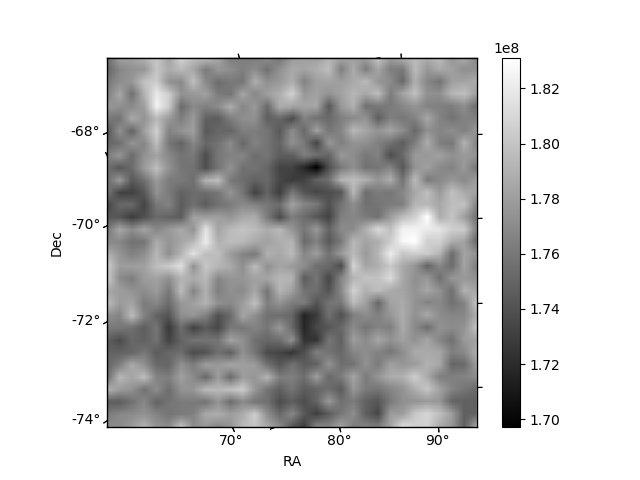
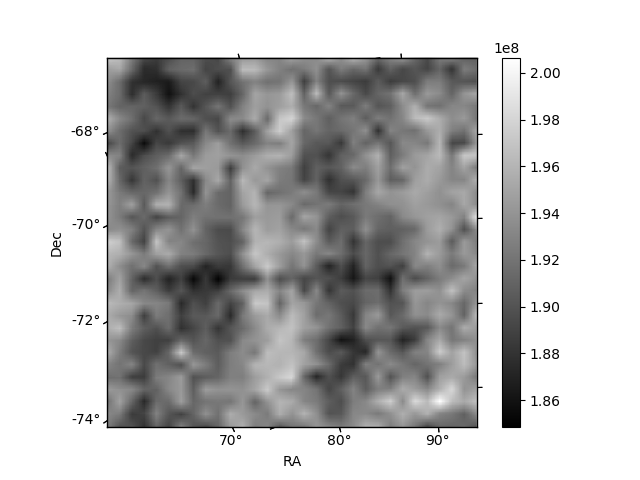
Histogram calculated using DETX and DETY for each event in the final _common_clean file
| Quadrant A | 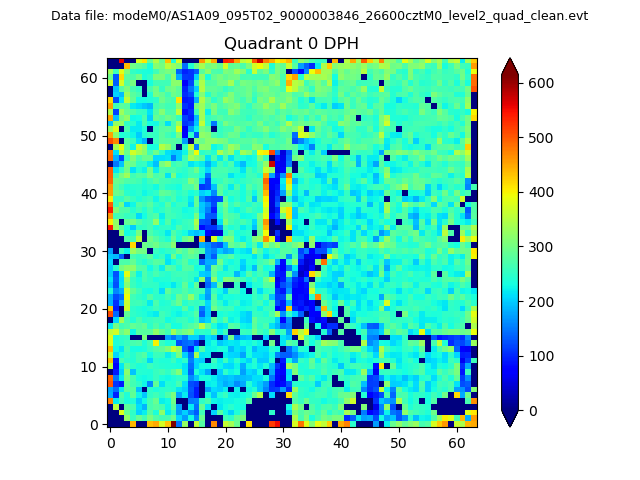 |
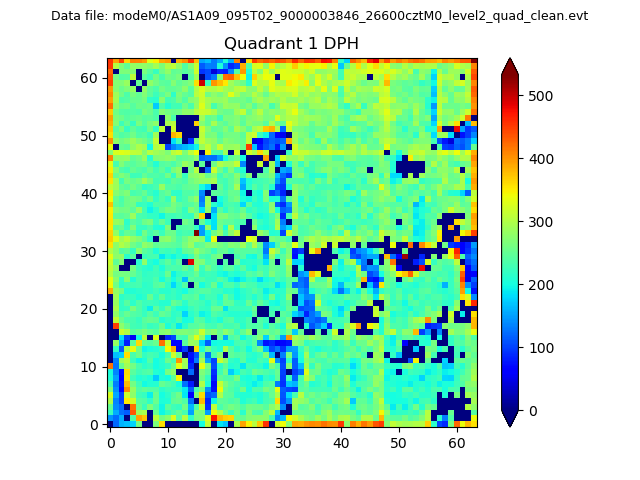 |
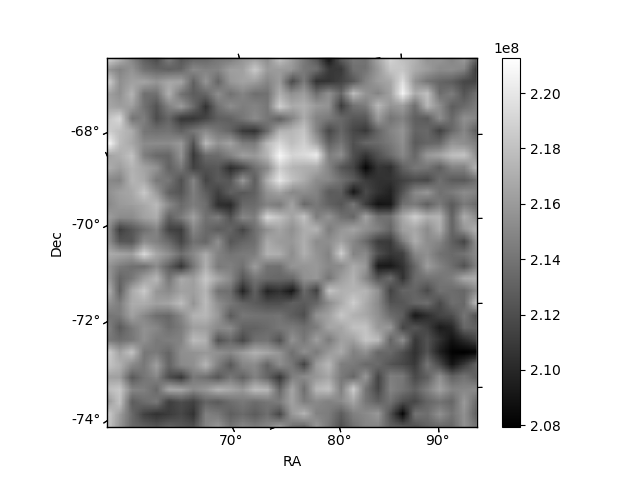
Quadrant B |
|---|---|---|---|
| Quadrant D | 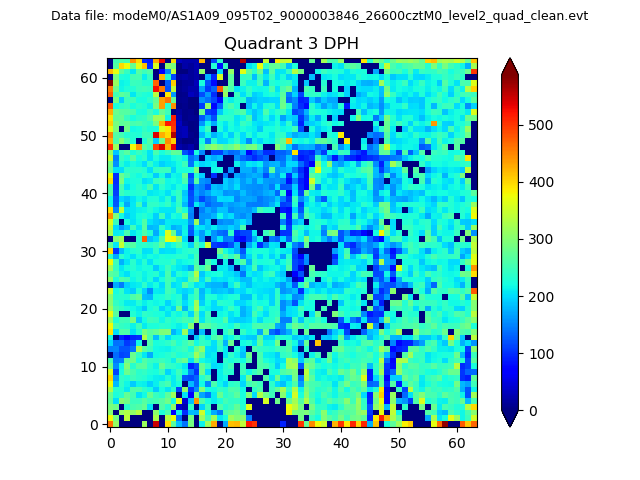 |
 |
Quadrant C |
| Plot type | Count rate plots | Images |
|---|---|---|
| Comparison with Poisson distribution Blue bars denote a histogram of data divided into 1 sec bins. Red curve is a Poisson curve with rate = median count rate of data. |
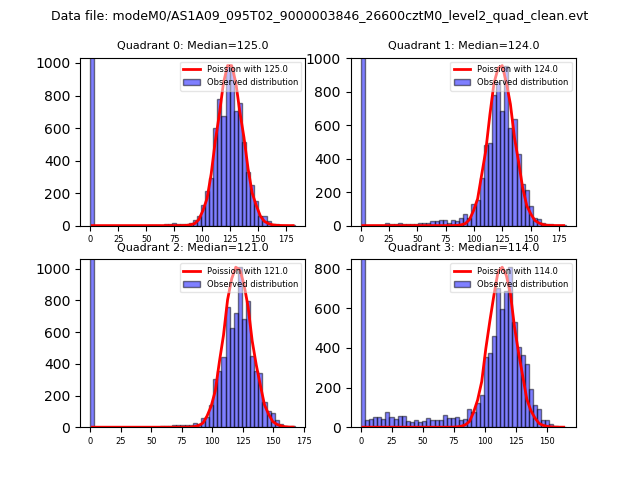 |
 |
| Quadrant-wise count rates Data is divided into 100 sec bins |
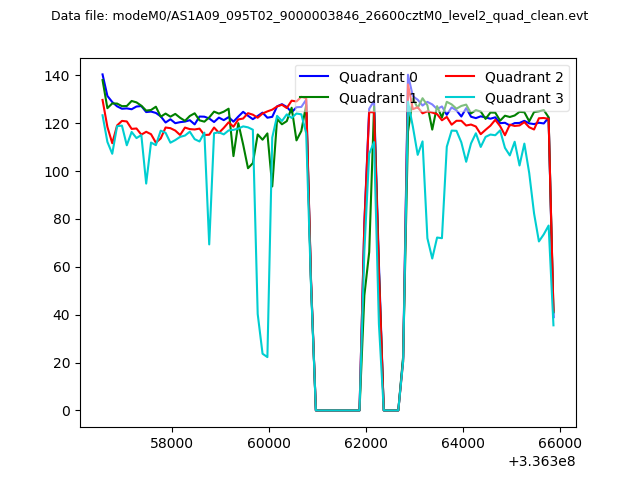 |
|
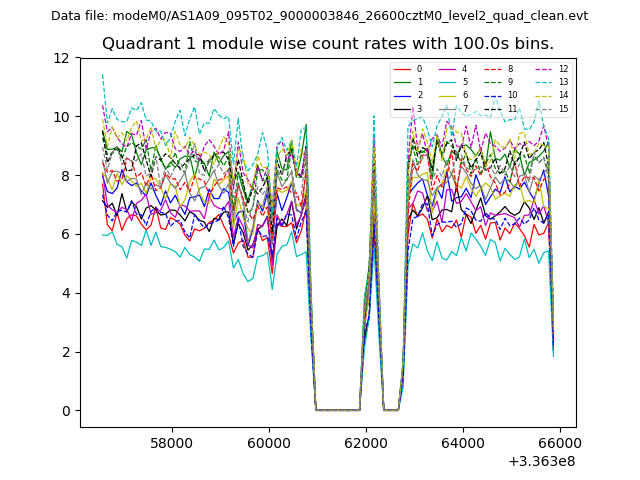
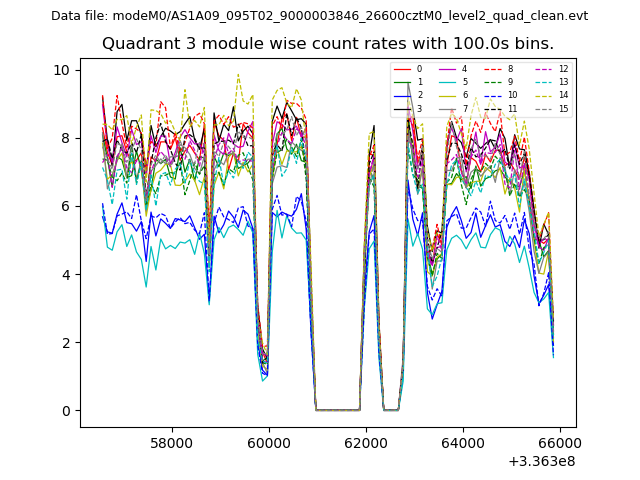
| Module-wise count rates for Quadrant A Data is divided into 100 sec bins |
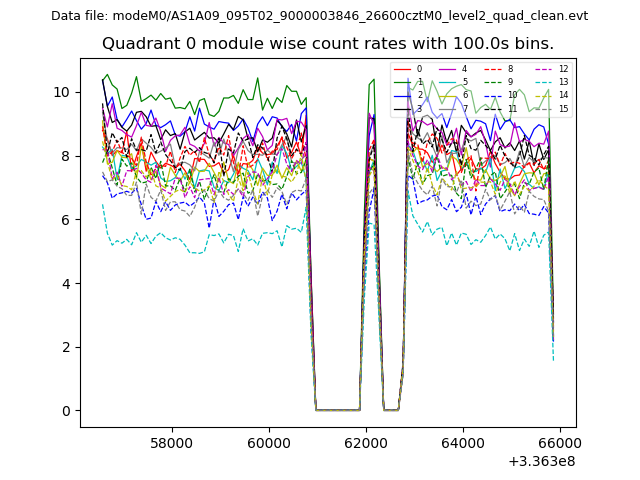 |
 |
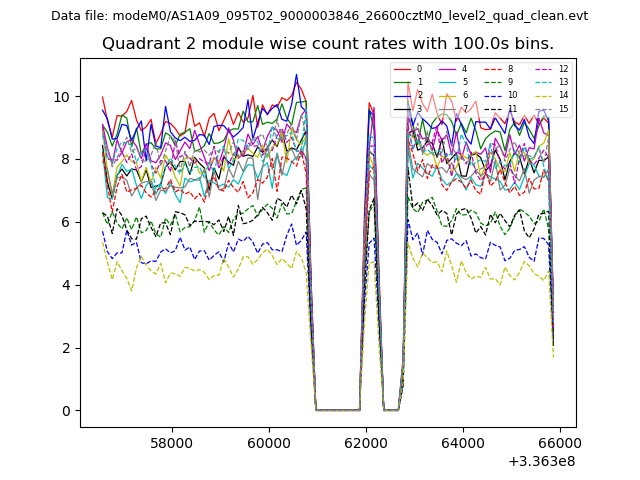
| Module-wise count rates for Quadrant B Data is divided into 100 sec bins |
 |
 |
| Module-wise count rates for Quadrant C Data is divided into 100 sec bins |
 |
 |
| Module-wise count rates for Quadrant D Data is divided into 100 sec bins |
 |
 |
| Parameter | Plot |
|---|---|
| CZT HV Monitor | 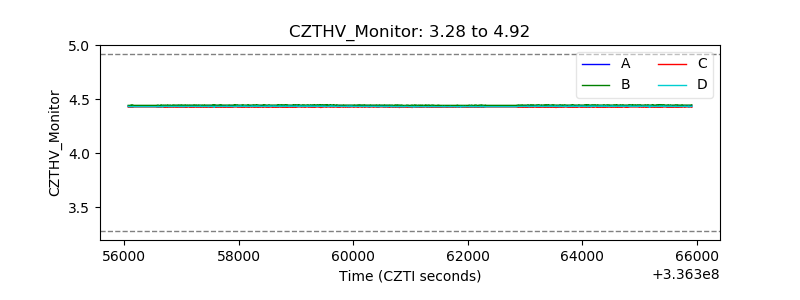 |
| D_VDD | 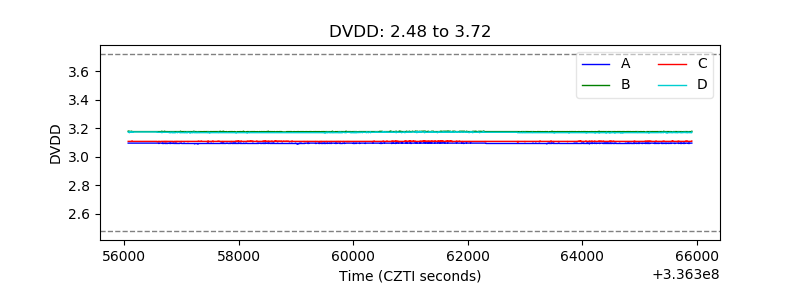 |
| Temperature 1 | 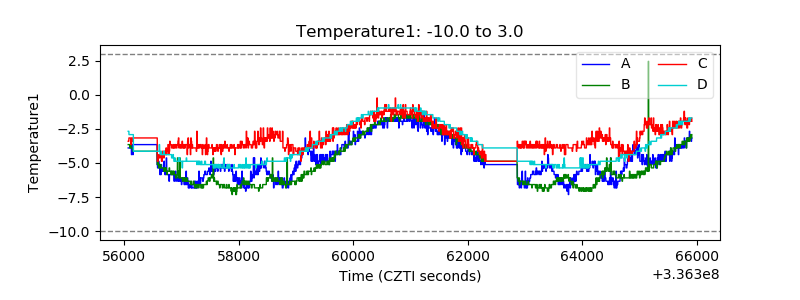 |
| Veto HV Monitor | 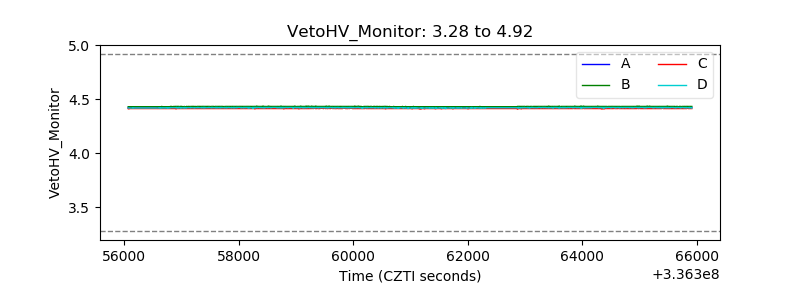 |
| Veto LLD | 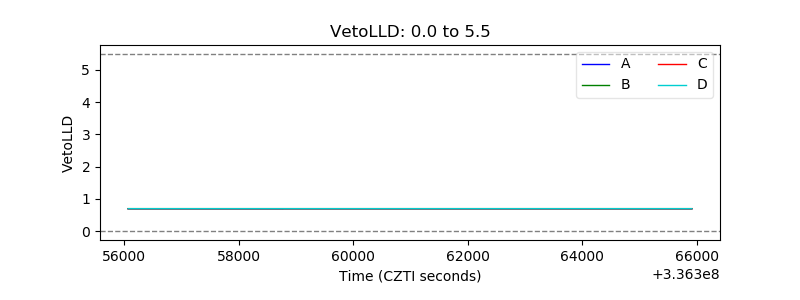 |
| Alpha Counter | 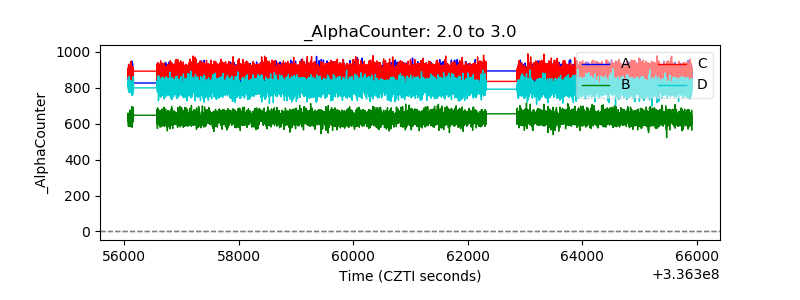 |
| _CPM_Rate | 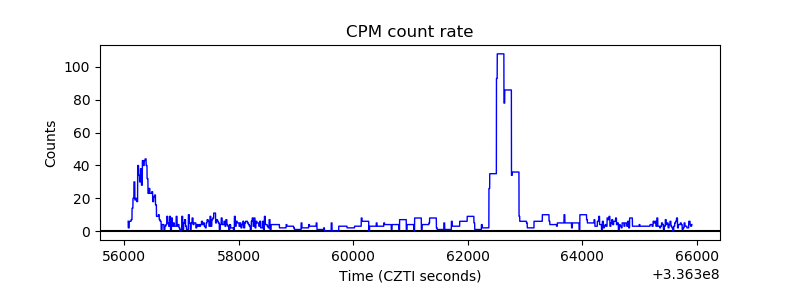 |
| CZT Counter | 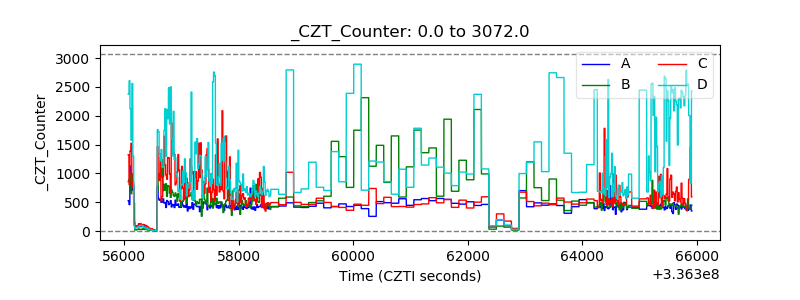 |
| +2.5 Volts monitor |  |
| +5 Volts monitor |  |
| _ROLL_ROT | 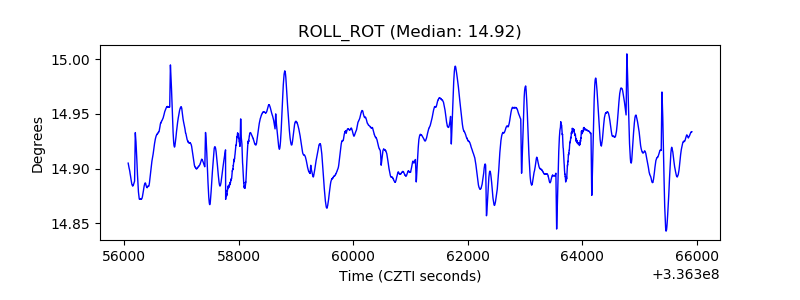 |
| _Roll_DEC | 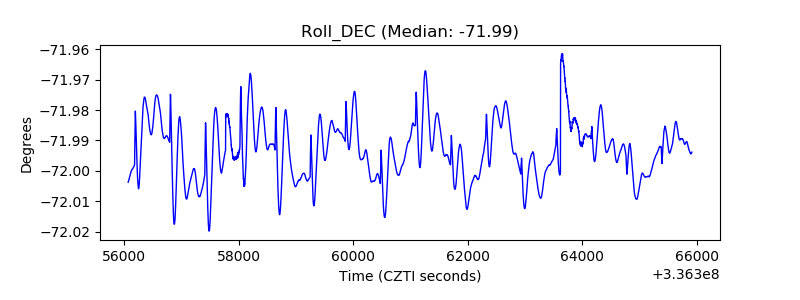 |
| _Roll_RA | 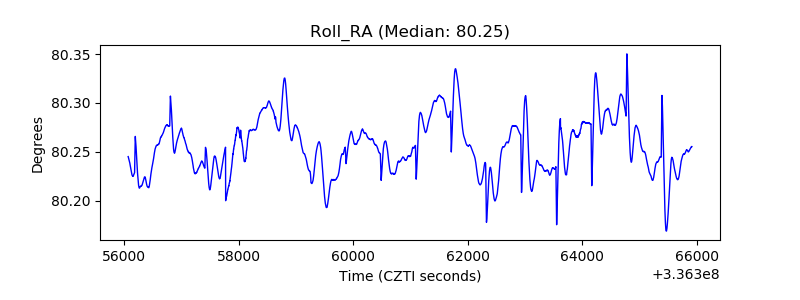 |
| Veto Counter | 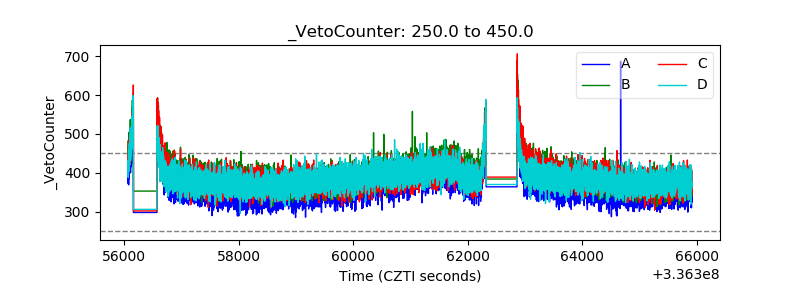 |