| Param | Original file | Final file |
|---|---|---|
| Filename | modeM0/AS1A09_095T02_9000003846_26602cztM0_level2.evt | modeM0/AS1A09_095T02_9000003846_26602cztM0_level2_quad_clean.evt |
| Size (bytes) | 2,656,054,080 | 298,252,800 |
| Size | 2.5 GB | 284.4 MB |
| Events in quadrant A | 9,875,459 | 2,144,246 |
| Events in quadrant B | 13,839,235 | 2,157,434 |
| Events in quadrant C | 12,185,784 | 2,103,082 |
| Events in quadrant D | 43,180,583 | 1,231,915 |
| Mode M9 | |||
|---|---|---|---|
| Quadrant | BADHDUFLAG | Total packets | Discarded packets |
| A | 0 | 38 | 0 |
| B | 0 | 38 | 0 |
| C | 0 | 38 | 0 |
| D | 0 | 38 | 0 |
| Mode M0 | |||
|---|---|---|---|
| Quadrant | BADHDUFLAG | Total packets | Discarded packets |
| A | 0 | 42203 | 0 |
| B | 0 | 54588 | 0 |
| C | 0 | 49165 | 0 |
| D | 0 | 141966 | 0 |
| Quadrant | Total seconds | Saturated seconds | Saturation percentage |
|---|---|---|---|
| A | 20214 | 152 | 0.751954% |
| B | 20215 | 883 | 4.368044% |
| C | 20215 | 618 | 3.057136% |
| D | 20215 | 14585 | 72.149394% |
Noise dominated data is calculated using 1-second bins in cleaned event files. If a bin has >2000 counts, and if more than 50% of those come from <1% of pixels, then it is considered to be noise-dominated and hence unusable.
| Quadrant | # 1 sec bins | Bins with >0 counts | Bins with >2000 counts | High rate bins dominated by noise | Noise dominated (total time) | Noise dominated (detector-on time) | Marked lightcurve |
|---|---|---|---|---|---|---|---|
| A | 23923 | 20213 | 37 | 37 | 0.15% | 0.18% | 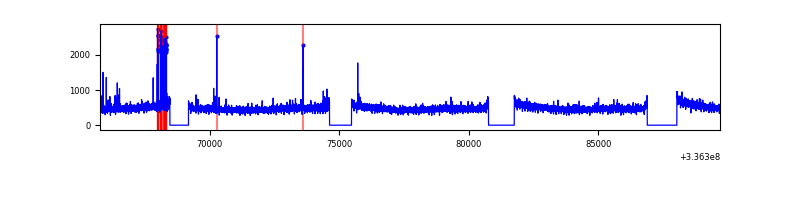 |
| B | 23924 | 20215 | 441 | 441 | 1.84% | 2.18% | 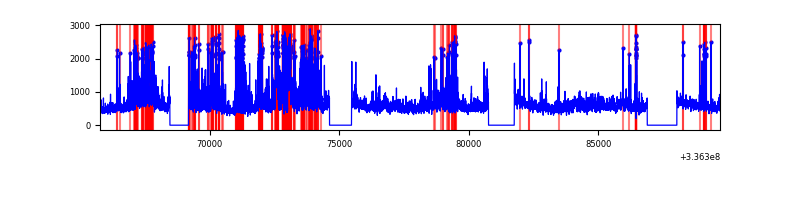 |
| C | 23924 | 20214 | 157 | 157 | 0.66% | 0.78% | 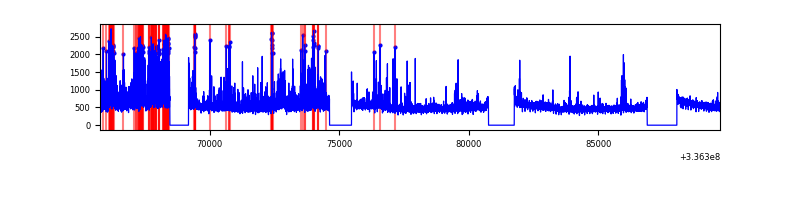 |
| D | 23924 | 20214 | 14188 | 14188 | 59.30% | 70.19% | 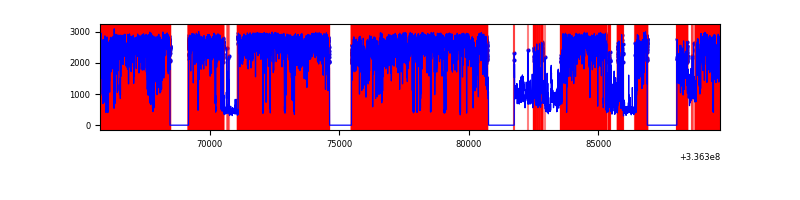 |
Top three noisy pixels from each quadrant. If the there are fewer than three noisy pixels in the level2.evt file, extra rows are filled as -1
| Pixel properties | Quadrant properties | ||||||
|---|---|---|---|---|---|---|---|
| Quadrant | DetID | PixID | Counts | Sigma | Mean | Median | Sigma |
| A | 12 | 96 | 209855 | 418.25 | 2490 | 2436 | 495.9 |
| A | 5 | 168 | 47306 | 90.48 | 2490 | 2436 | 495.9 |
| A | 13 | 254 | 32297 | 60.21 | 2490 | 2436 | 495.9 |
| B | 3 | 64 | 2667251 | 5893.22 | 2432 | 2378 | 452.2 |
| B | 0 | 189 | 1494276 | 3299.25 | 2432 | 2378 | 452.2 |
| B | 5 | 172 | 69321 | 148.04 | 2432 | 2378 | 452.2 |
| C | 3 | 233 | 2124128 | 3863.21 | 2386 | 2404 | 549.2 |
| C | 14 | 238 | 384375 | 695.49 | 2386 | 2404 | 549.2 |
| C | 15 | 208 | 363047 | 656.65 | 2386 | 2404 | 549.2 |
| D | 1 | 52 | 33620880 | 99131.38 | 1450 | 1417 | 339.1 |
| D | 7 | 80 | 3448881 | 10165.3 | 1450 | 1417 | 339.1 |
| D | 2 | 250 | 391670 | 1150.71 | 1450 | 1417 | 339.1 |
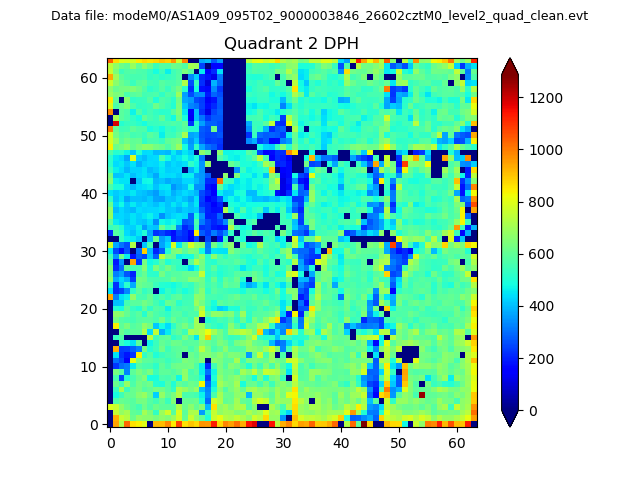
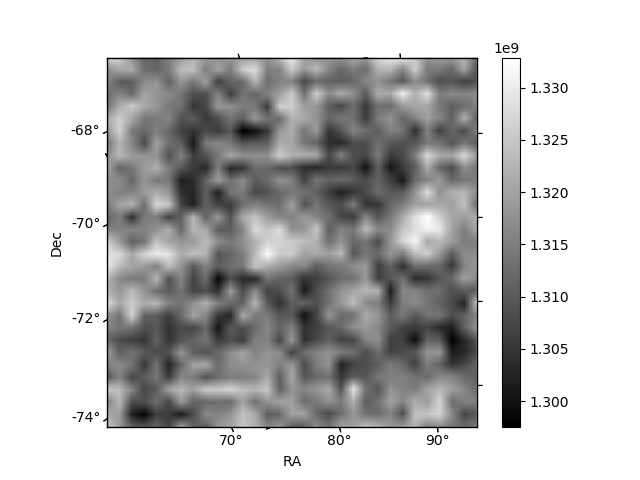
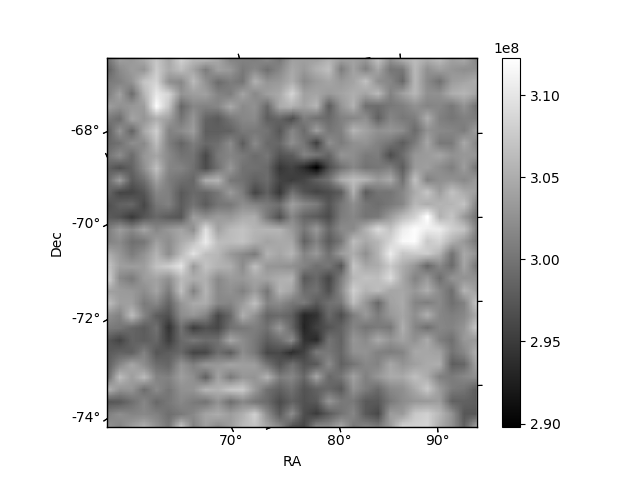
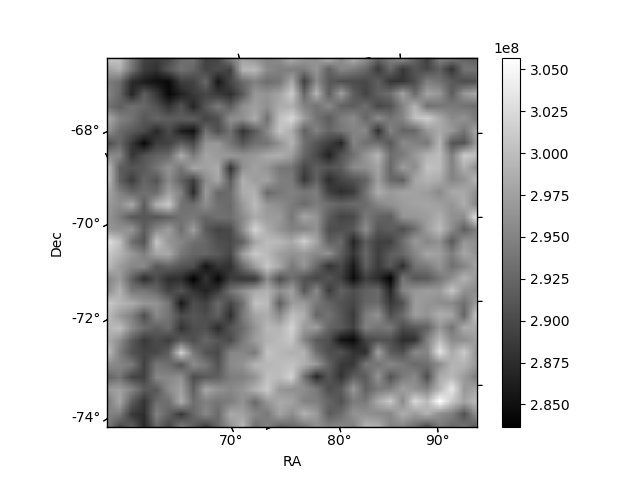
Histogram calculated using DETX and DETY for each event in the final _common_clean file
| Quadrant A | 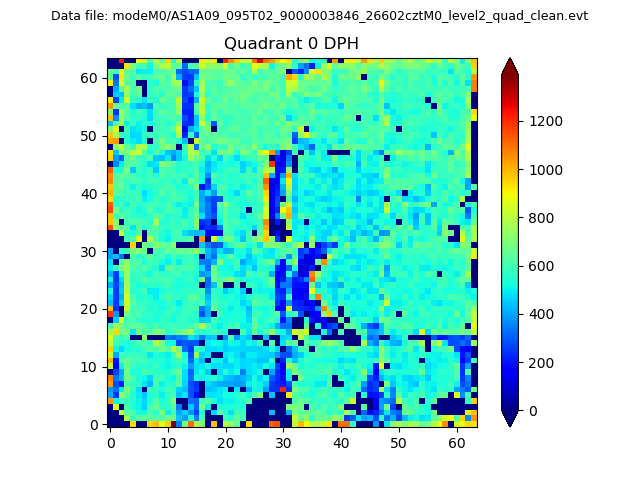 |
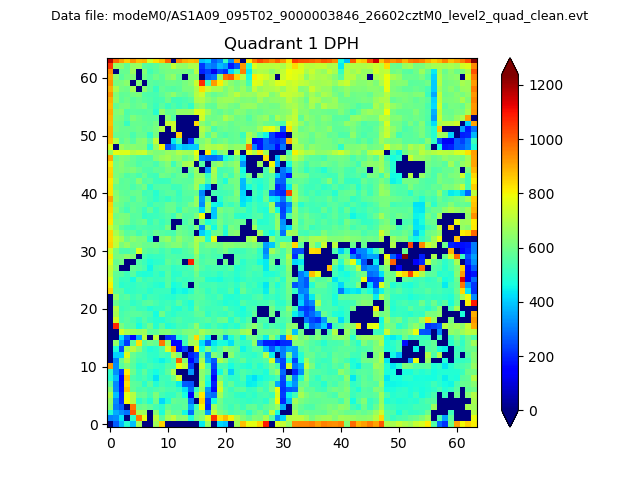 |
Quadrant B |
|---|---|---|---|
| Quadrant D | 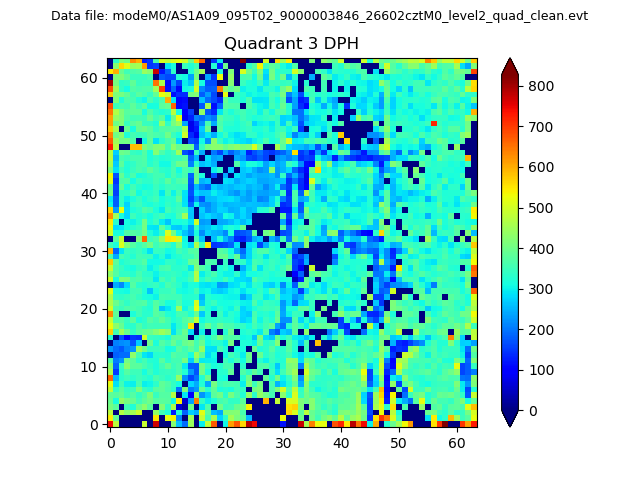 |
 |
Quadrant C |
| Plot type | Count rate plots | Images |
|---|---|---|
| Comparison with Poisson distribution Blue bars denote a histogram of data divided into 1 sec bins. Red curve is a Poisson curve with rate = median count rate of data. |
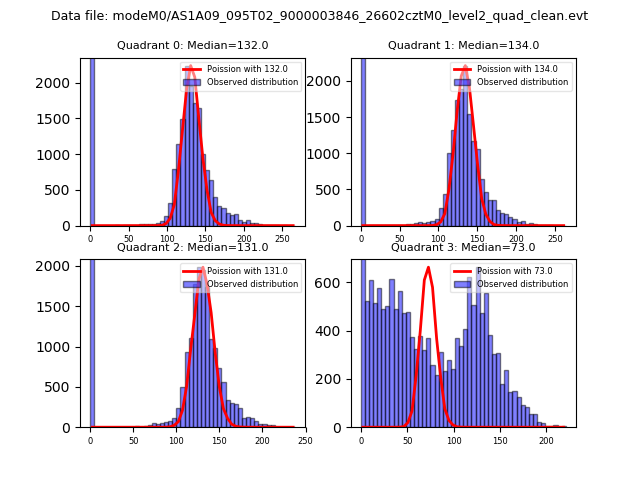 |
 |
| Quadrant-wise count rates Data is divided into 100 sec bins |
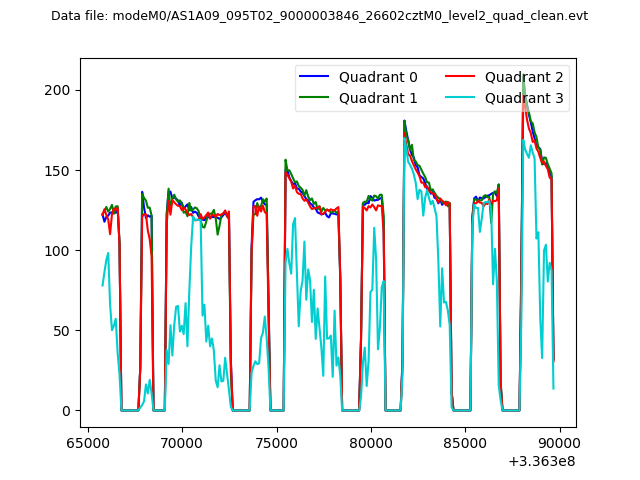 |
|
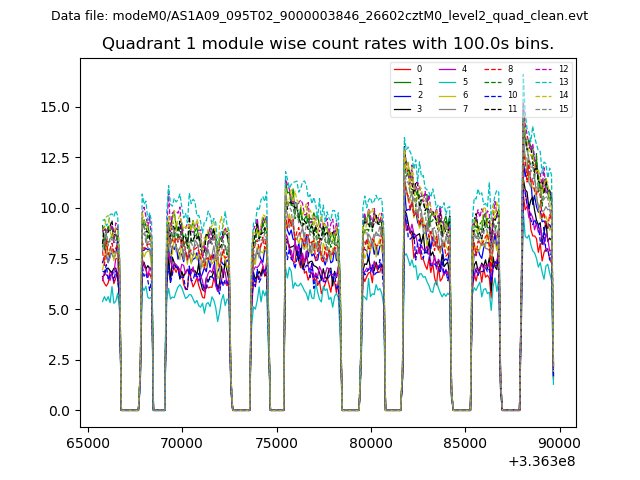
| Module-wise count rates for Quadrant A Data is divided into 100 sec bins |
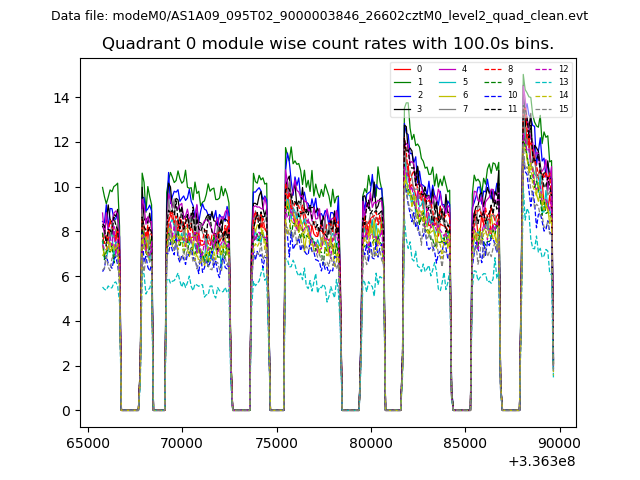 |
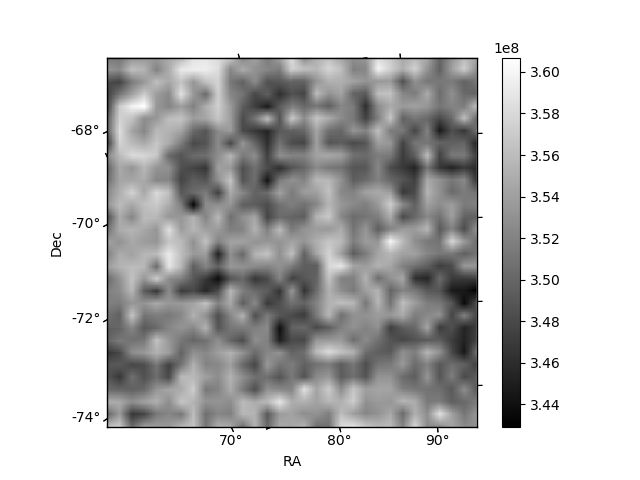 |
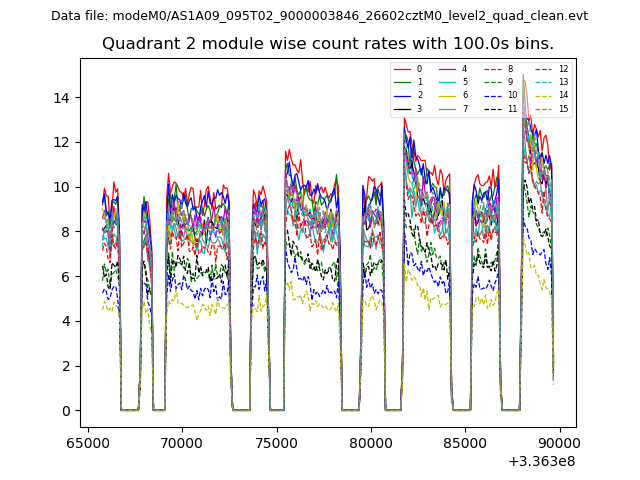
| Module-wise count rates for Quadrant B Data is divided into 100 sec bins |
 |
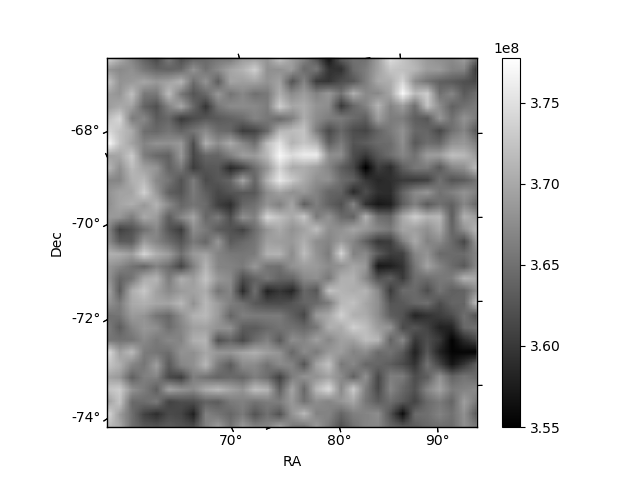 |
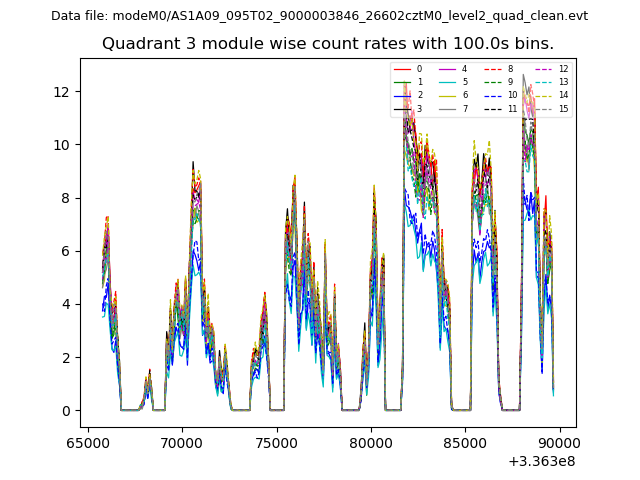
| Module-wise count rates for Quadrant C Data is divided into 100 sec bins |
 |
 |
| Module-wise count rates for Quadrant D Data is divided into 100 sec bins |
 |
 |
| Parameter | Plot |
|---|---|
| CZT HV Monitor | 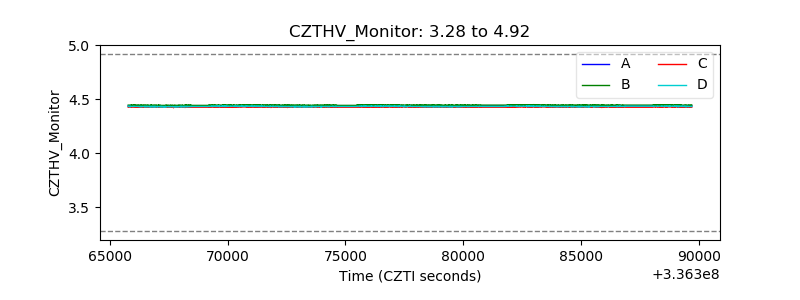 |
| D_VDD | 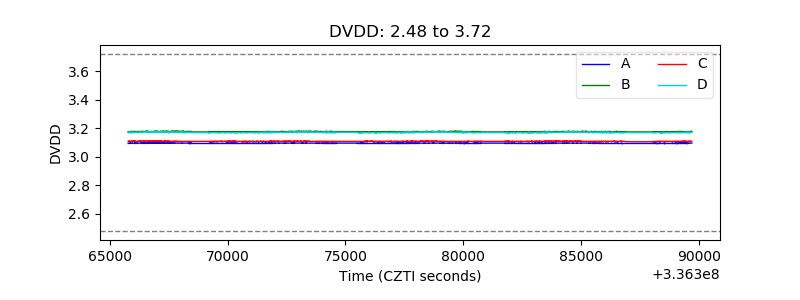 |
| Temperature 1 | 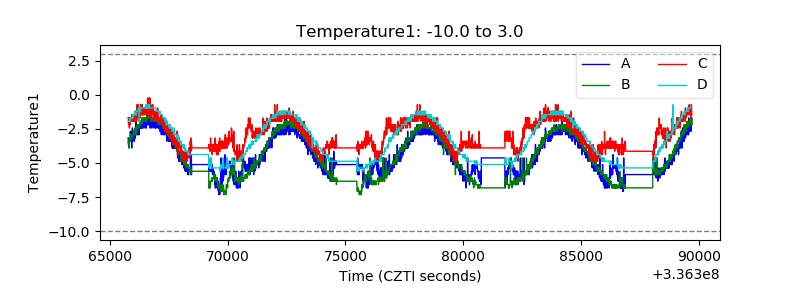 |
| Veto HV Monitor | 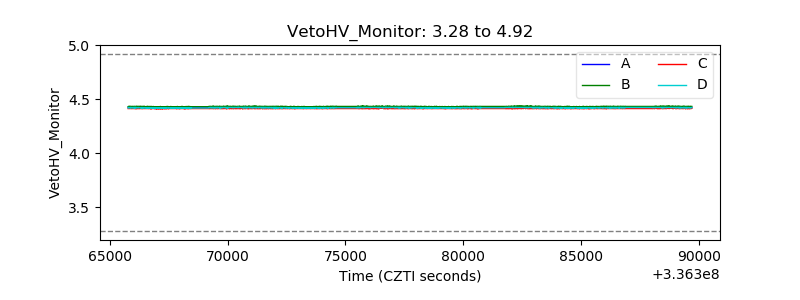 |
| Veto LLD | 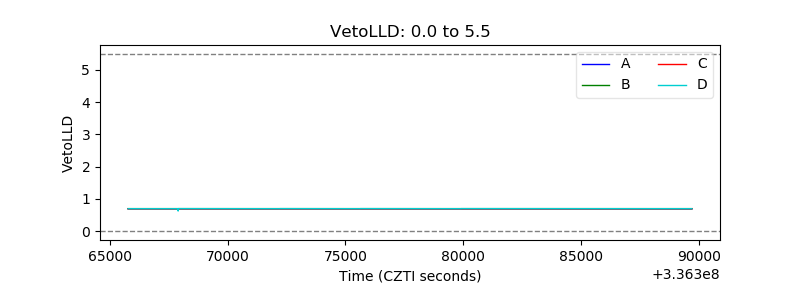 |
| Alpha Counter | 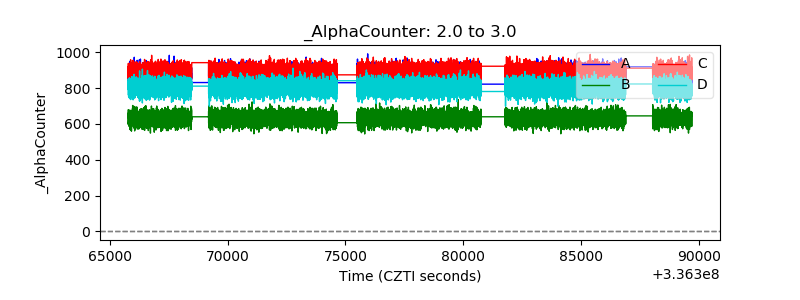 |
| _CPM_Rate |  |
| CZT Counter | 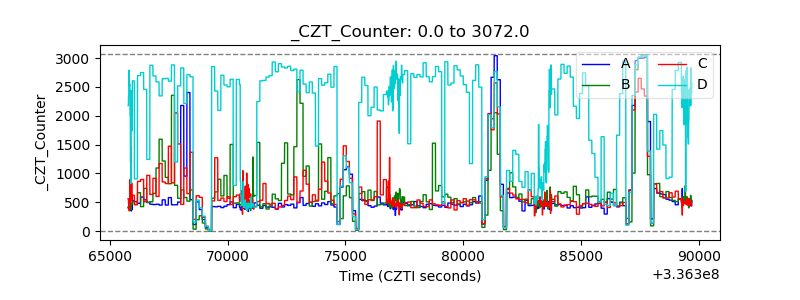 |
| +2.5 Volts monitor | 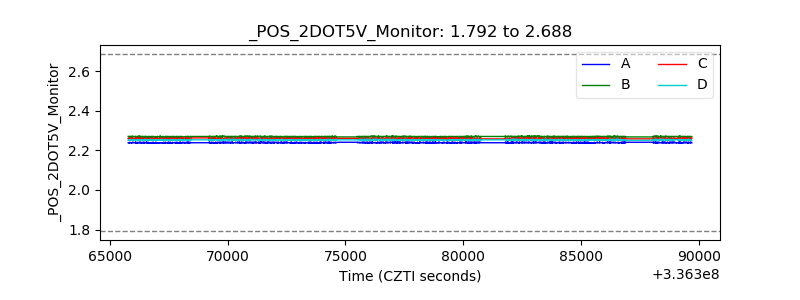 |
| +5 Volts monitor |  |
| _ROLL_ROT | 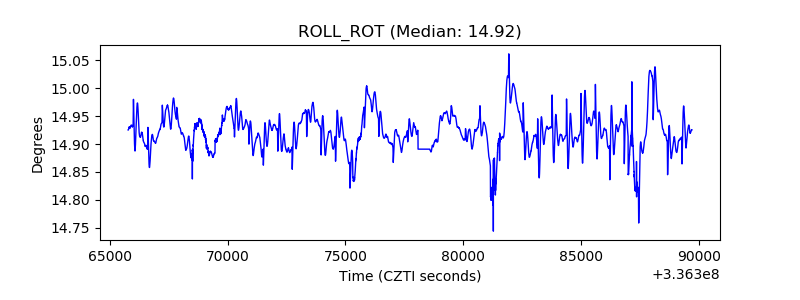 |
| _Roll_DEC | 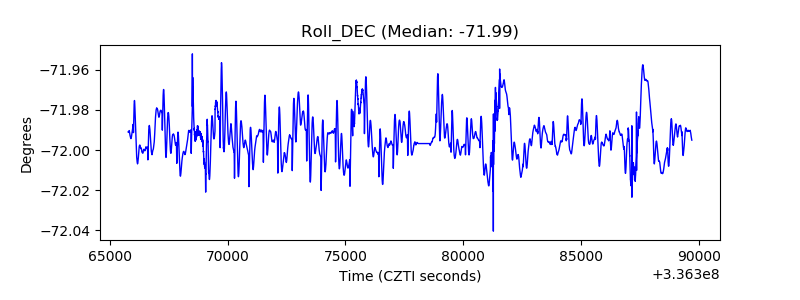 |
| _Roll_RA | 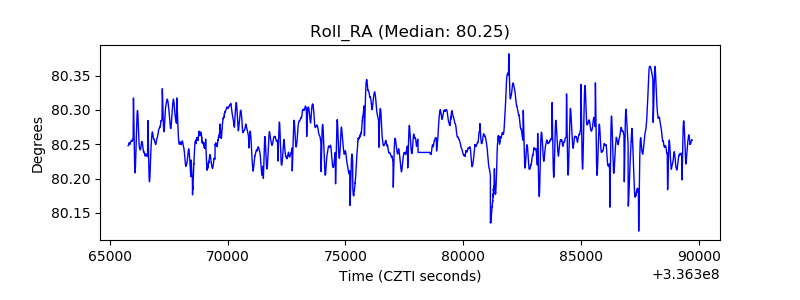 |
| Veto Counter | 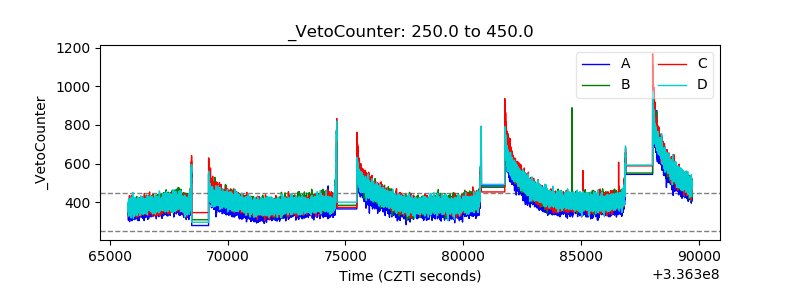 |