| Param | Original file | Final file |
|---|---|---|
| Filename | modeM0/AS1A09_095T02_9000003846_26603cztM0_level2.evt | modeM0/AS1A09_095T02_9000003846_26603cztM0_level2_quad_clean.evt |
| Size (bytes) | 779,872,320 | 101,309,760 |
| Size | 743.7 MB | 96.6 MB |
| Events in quadrant A | 3,030,660 | 752,906 |
| Events in quadrant B | 4,431,792 | 723,191 |
| Events in quadrant C | 3,119,129 | 728,454 |
| Events in quadrant D | 12,639,712 | 451,287 |
| Mode M9 | |||
|---|---|---|---|
| Quadrant | BADHDUFLAG | Total packets | Discarded packets |
| A | 0 | 13 | 0 |
| B | 0 | 13 | 0 |
| C | 0 | 13 | 0 |
| D | 0 | 13 | 0 |
| Mode M0 | |||
|---|---|---|---|
| Quadrant | BADHDUFLAG | Total packets | Discarded packets |
| A | 0 | 12657 | 0 |
| B | 0 | 17007 | 0 |
| C | 0 | 12855 | 0 |
| D | 0 | 41593 | 0 |
| Quadrant | Total seconds | Saturated seconds | Saturation percentage |
|---|---|---|---|
| A | 5883 | 38 | 0.645929% |
| B | 5884 | 422 | 7.171992% |
| C | 5884 | 68 | 1.155676% |
| D | 5884 | 4007 | 68.099932% |
Noise dominated data is calculated using 1-second bins in cleaned event files. If a bin has >2000 counts, and if more than 50% of those come from <1% of pixels, then it is considered to be noise-dominated and hence unusable.
| Quadrant | # 1 sec bins | Bins with >0 counts | Bins with >2000 counts | High rate bins dominated by noise | Noise dominated (total time) | Noise dominated (detector-on time) | Marked lightcurve |
|---|---|---|---|---|---|---|---|
| A | 7137 | 5882 | 0 | 0 | 0.00% | 0.00% | 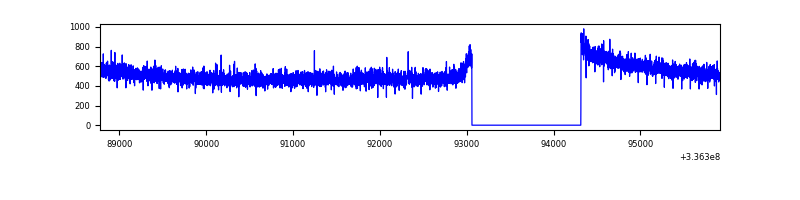 |
| B | 7138 | 5883 | 279 | 279 | 3.91% | 4.74% | 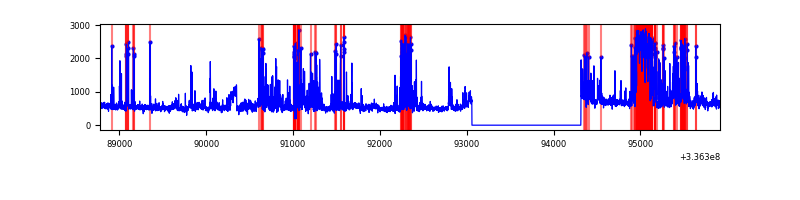 |
| C | 7138 | 5883 | 1 | 1 | 0.01% | 0.02% | 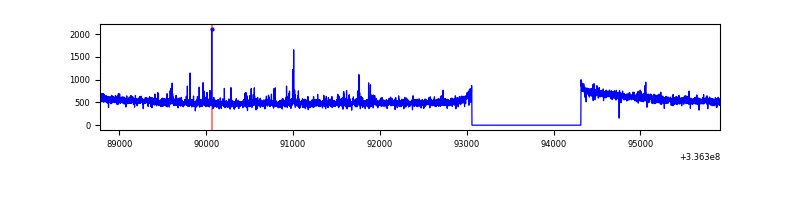 |
| D | 7138 | 5883 | 3986 | 3986 | 55.84% | 67.75% | 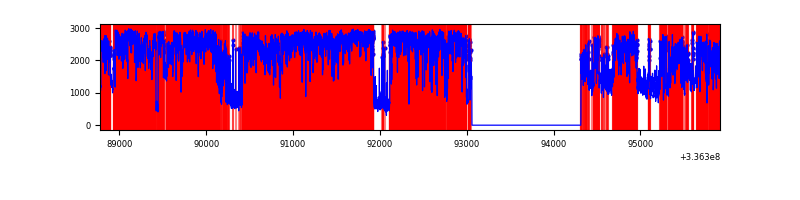 |
Top three noisy pixels from each quadrant. If the there are fewer than three noisy pixels in the level2.evt file, extra rows are filled as -1
| Pixel properties | Quadrant properties | ||||||
|---|---|---|---|---|---|---|---|
| Quadrant | DetID | PixID | Counts | Sigma | Mean | Median | Sigma |
| A | 13 | 254 | 9670 | 57.43 | 782 | 766 | 155.0 |
| A | 0 | 226 | 6773 | 38.74 | 782 | 766 | 155.0 |
| A | 3 | 137 | 6639 | 37.88 | 782 | 766 | 155.0 |
| B | 3 | 64 | 1306255 | 9594.73 | 738 | 725 | 136.1 |
| B | 0 | 189 | 204485 | 1497.49 | 738 | 725 | 136.1 |
| B | 12 | 111 | 15818 | 110.92 | 738 | 725 | 136.1 |
| C | 14 | 238 | 122538 | 712.27 | 741 | 745 | 171.0 |
| C | 3 | 233 | 81357 | 471.43 | 741 | 745 | 171.0 |
| C | 2 | 16 | 16180 | 90.27 | 741 | 745 | 171.0 |
| D | 1 | 52 | 9668120 | 69109.13 | 527 | 517 | 139.9 |
| D | 7 | 80 | 807622 | 5769.61 | 527 | 517 | 139.9 |
| D | 2 | 250 | 103472 | 735.98 | 527 | 517 | 139.9 |
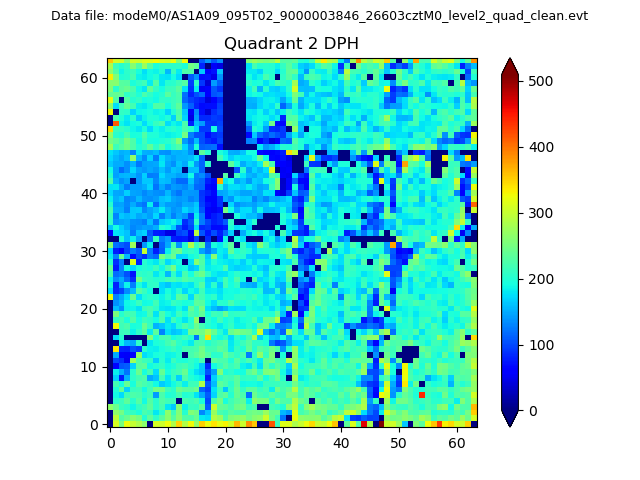
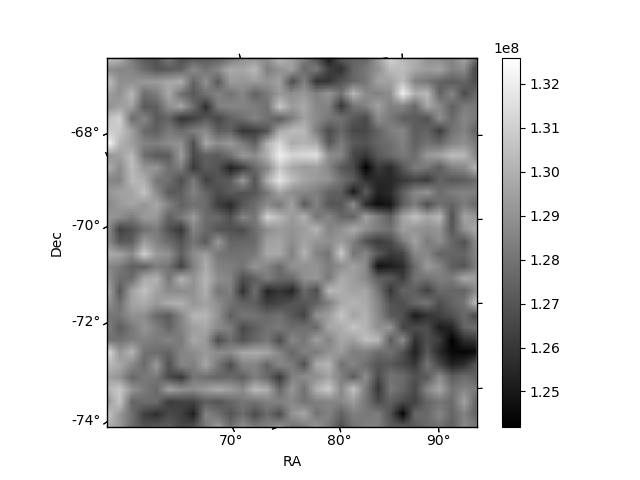
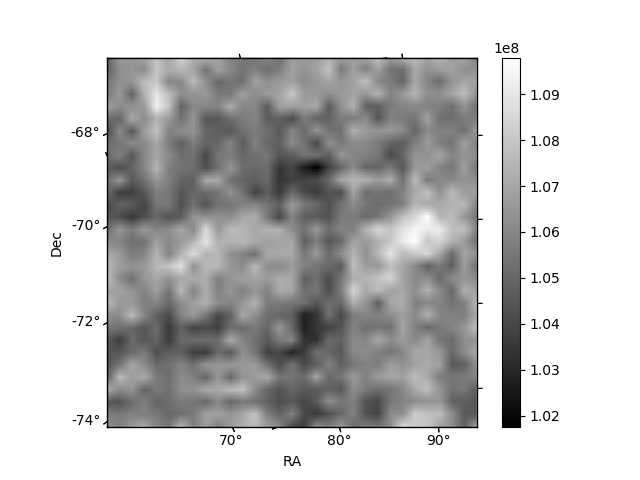
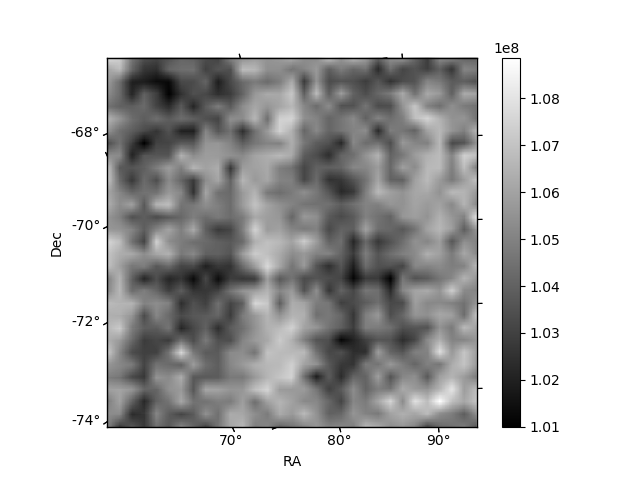
Histogram calculated using DETX and DETY for each event in the final _common_clean file
| Quadrant A | 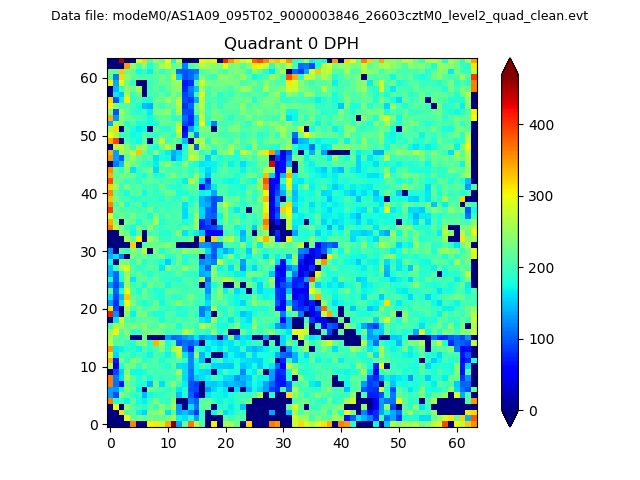 |
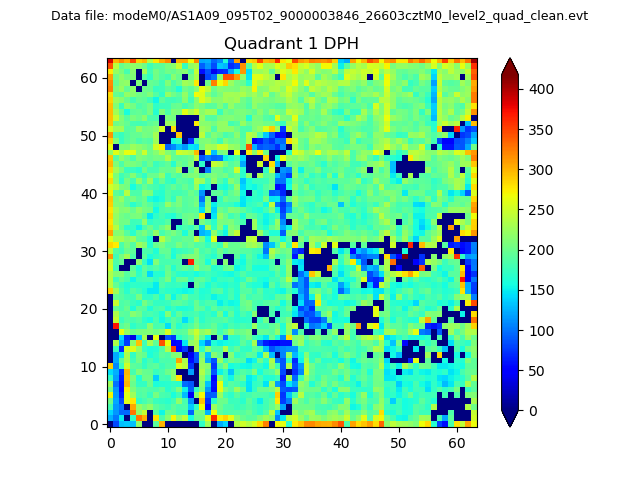 |
Quadrant B |
|---|---|---|---|
| Quadrant D | 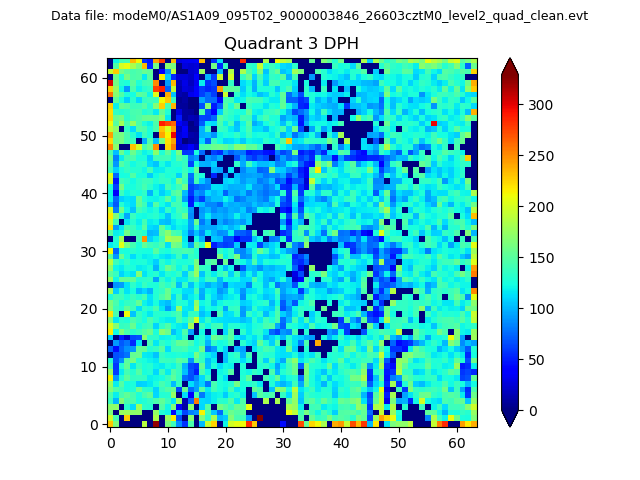 |
 |
Quadrant C |
| Plot type | Count rate plots | Images |
|---|---|---|
| Comparison with Poisson distribution Blue bars denote a histogram of data divided into 1 sec bins. Red curve is a Poisson curve with rate = median count rate of data. |
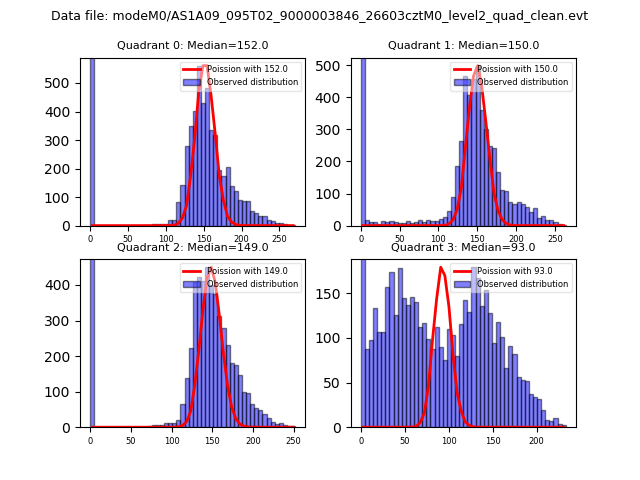 |
 |
| Quadrant-wise count rates Data is divided into 100 sec bins |
 |
|
| Module-wise count rates for Quadrant A Data is divided into 100 sec bins |
 |
 |
| Module-wise count rates for Quadrant B Data is divided into 100 sec bins |
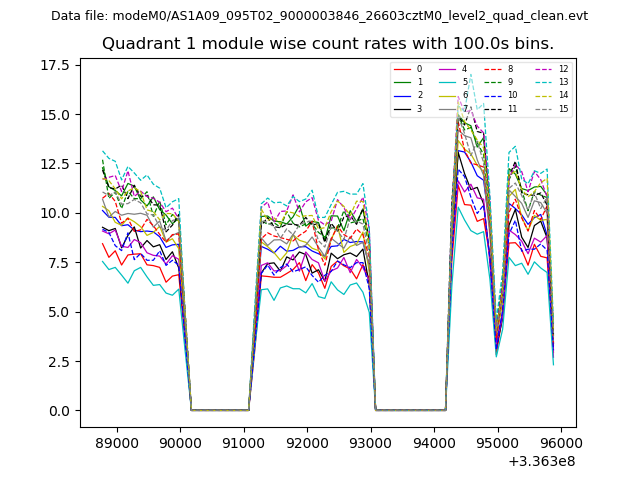 |
 |
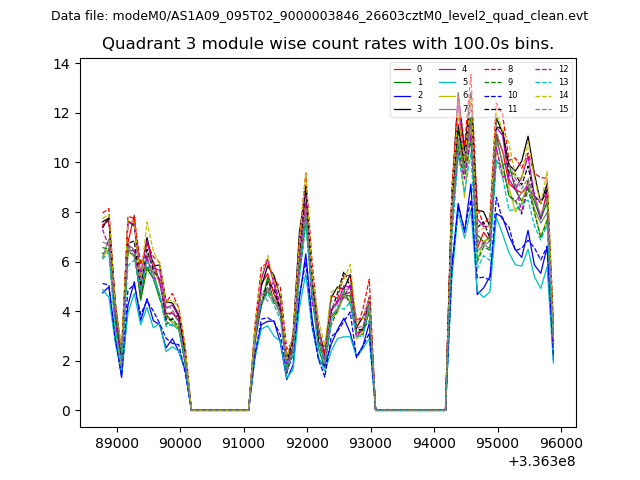
| Module-wise count rates for Quadrant C Data is divided into 100 sec bins |
 |
 |
| Module-wise count rates for Quadrant D Data is divided into 100 sec bins |
 |
 |
| Parameter | Plot |
|---|---|
| CZT HV Monitor | 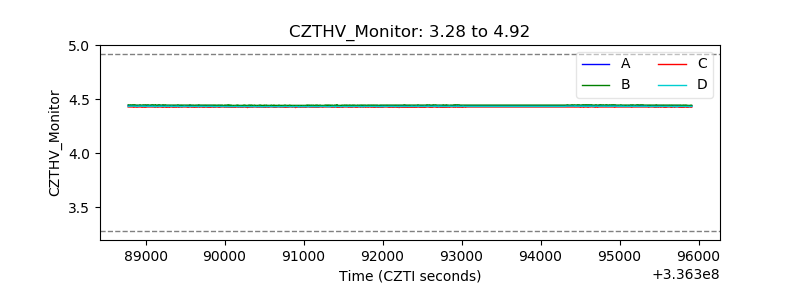 |
| D_VDD | 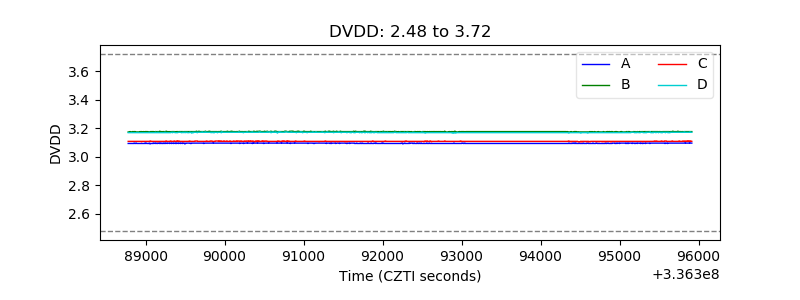 |
| Temperature 1 | 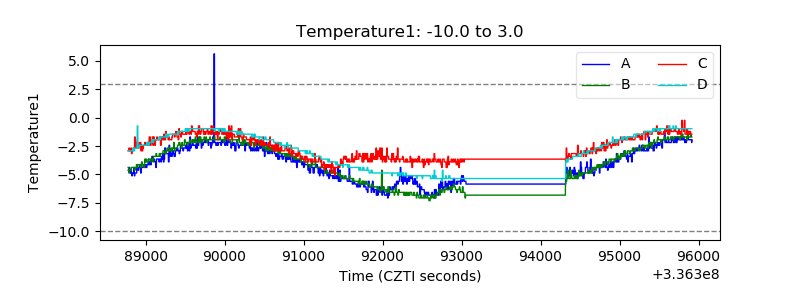 |
| Veto HV Monitor | 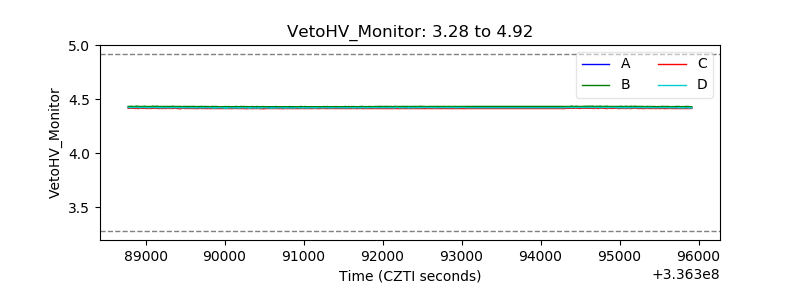 |
| Veto LLD | 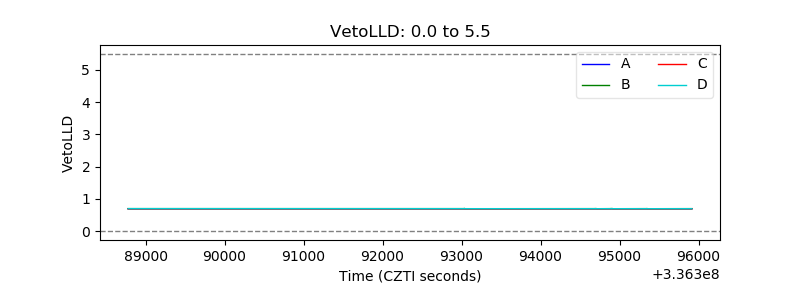 |
| Alpha Counter | 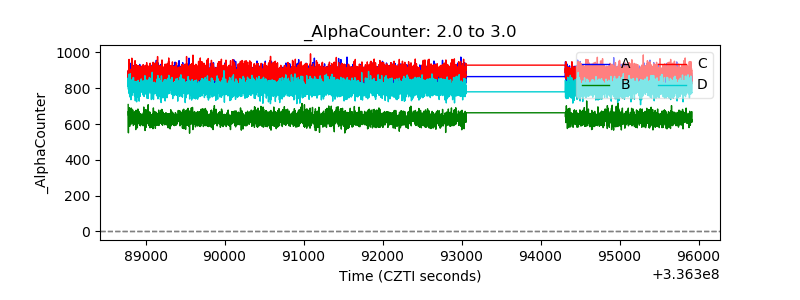 |
| _CPM_Rate | 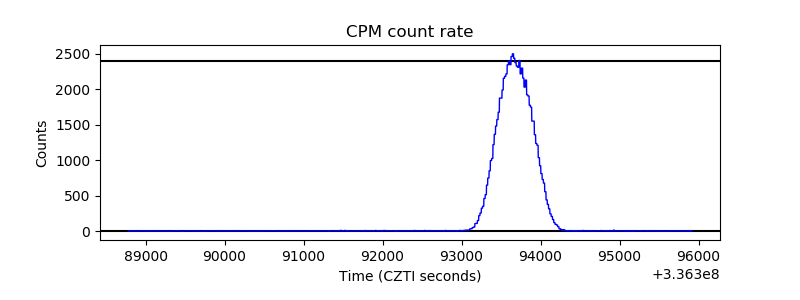 |
| CZT Counter | 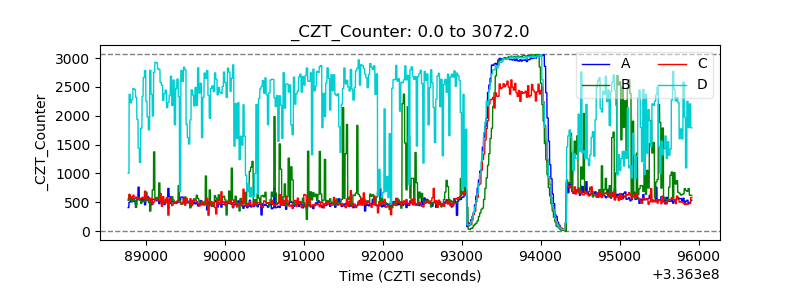 |
| +2.5 Volts monitor | 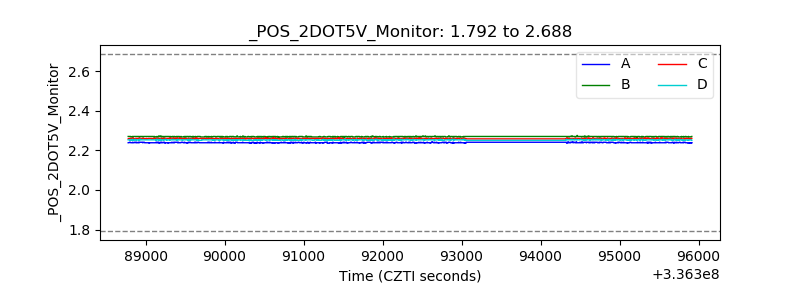 |
| +5 Volts monitor | 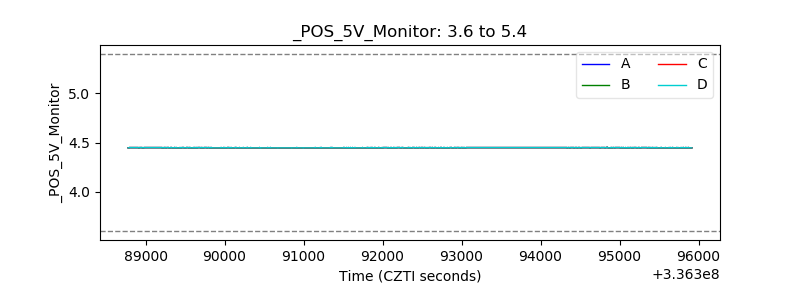 |
| _ROLL_ROT | 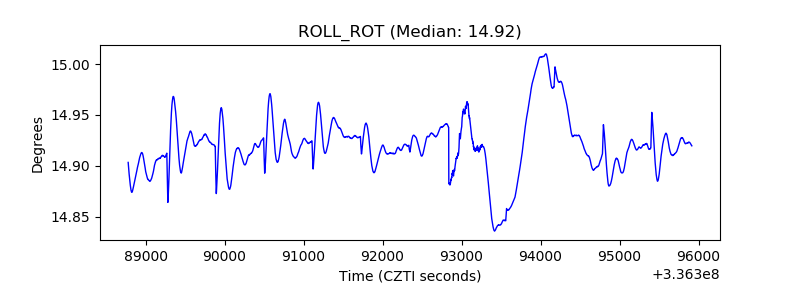 |
| _Roll_DEC | 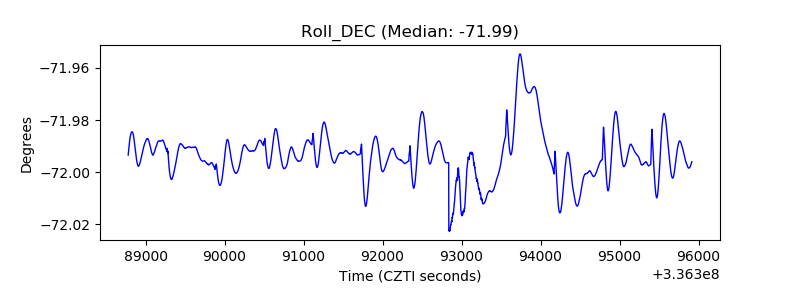 |
| _Roll_RA | 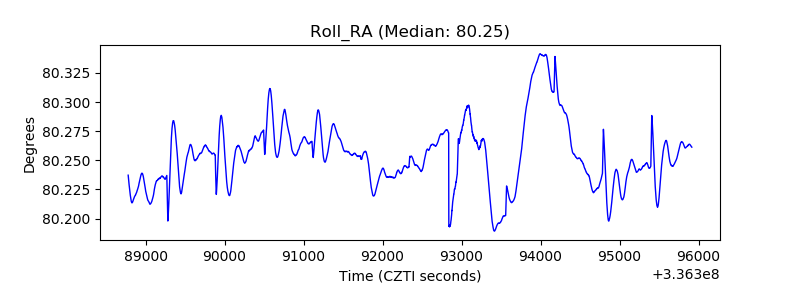 |
| Veto Counter | 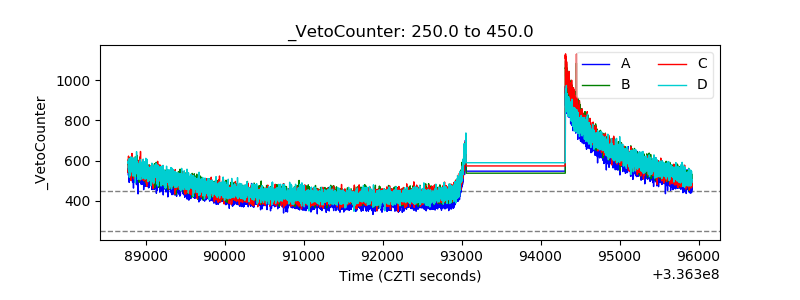 |