| Param | Original file | Final file |
|---|---|---|
| Filename | modeM0/AS1A09_095T02_9000003846_26604cztM0_level2.evt | modeM0/AS1A09_095T02_9000003846_26604cztM0_level2_quad_clean.evt |
| Size (bytes) | 710,159,040 | 106,931,520 |
| Size | 677.3 MB | 102.0 MB |
| Events in quadrant A | 3,181,958 | 753,620 |
| Events in quadrant B | 4,699,140 | 730,402 |
| Events in quadrant C | 3,355,634 | 716,591 |
| Events in quadrant D | 9,868,986 | 621,639 |
| Mode M9 | |||
|---|---|---|---|
| Quadrant | BADHDUFLAG | Total packets | Discarded packets |
| A | 0 | 13 | 0 |
| B | 0 | 13 | 0 |
| C | 0 | 13 | 0 |
| D | 0 | 13 | 0 |
| Mode M0 | |||
|---|---|---|---|
| Quadrant | BADHDUFLAG | Total packets | Discarded packets |
| A | 0 | 13124 | 0 |
| B | 0 | 18194 | 0 |
| C | 0 | 13678 | 0 |
| D | 0 | 33429 | 0 |
| Quadrant | Total seconds | Saturated seconds | Saturation percentage |
|---|---|---|---|
| A | 5946 | 52 | 0.874538% |
| B | 5947 | 462 | 7.768623% |
| C | 5947 | 102 | 1.715150% |
| D | 5947 | 2069 | 34.790651% |
Noise dominated data is calculated using 1-second bins in cleaned event files. If a bin has >2000 counts, and if more than 50% of those come from <1% of pixels, then it is considered to be noise-dominated and hence unusable.
| Quadrant | # 1 sec bins | Bins with >0 counts | Bins with >2000 counts | High rate bins dominated by noise | Noise dominated (total time) | Noise dominated (detector-on time) | Marked lightcurve |
|---|---|---|---|---|---|---|---|
| A | 7261 | 5946 | 1 | 1 | 0.01% | 0.02% | 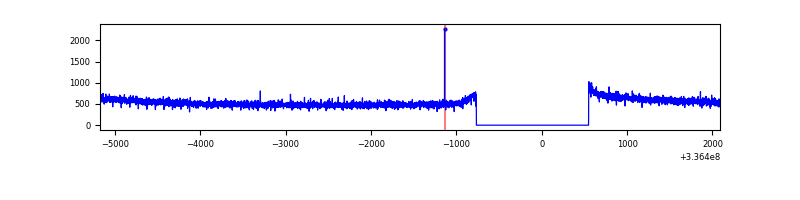 |
| B | 7262 | 5948 | 347 | 347 | 4.78% | 5.83% | 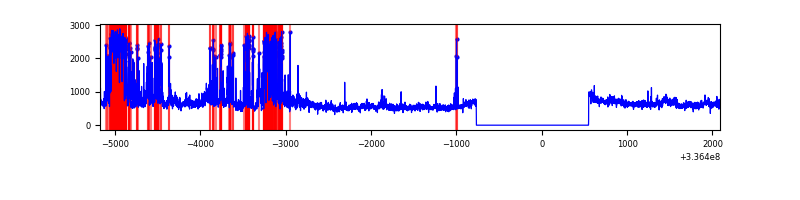 |
| C | 7262 | 5948 | 32 | 32 | 0.44% | 0.54% | 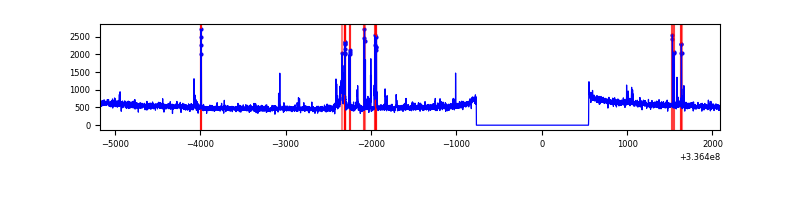 |
| D | 7262 | 5948 | 2176 | 2176 | 29.96% | 36.58% | 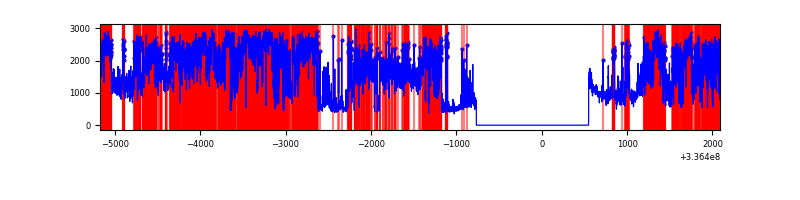 |
Top three noisy pixels from each quadrant. If the there are fewer than three noisy pixels in the level2.evt file, extra rows are filled as -1
| Pixel properties | Quadrant properties | ||||||
|---|---|---|---|---|---|---|---|
| Quadrant | DetID | PixID | Counts | Sigma | Mean | Median | Sigma |
| A | 0 | 13 | 11385 | 66.09 | 819 | 805 | 160.1 |
| A | 5 | 168 | 10253 | 59.02 | 819 | 805 | 160.1 |
| A | 13 | 254 | 9675 | 55.41 | 819 | 805 | 160.1 |
| B | 3 | 64 | 1200463 | 8471.3 | 772 | 756 | 141.6 |
| B | 0 | 189 | 428557 | 3020.76 | 772 | 756 | 141.6 |
| B | 15 | 32 | 18835 | 127.66 | 772 | 756 | 141.6 |
| C | 2 | 16 | 169485 | 959.33 | 767 | 775 | 175.9 |
| C | 14 | 238 | 126235 | 713.4 | 767 | 775 | 175.9 |
| C | 15 | 208 | 44225 | 247.07 | 767 | 775 | 175.9 |
| D | 1 | 52 | 4855507 | 29089.92 | 702 | 683 | 166.9 |
| D | 7 | 80 | 1442285 | 8638.02 | 702 | 683 | 166.9 |
| D | 12 | 233 | 592235 | 3544.56 | 702 | 683 | 166.9 |
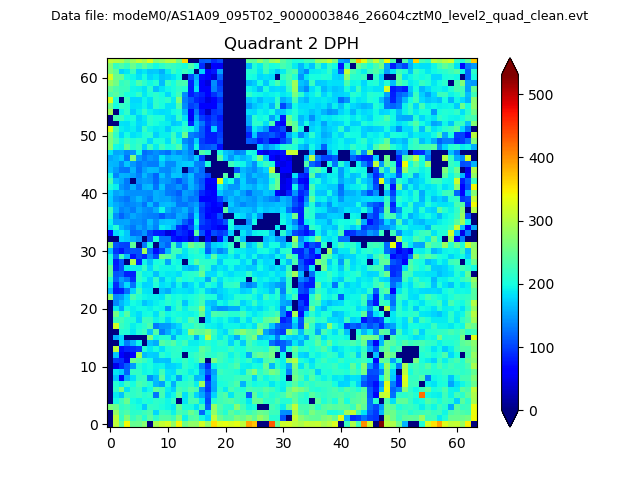
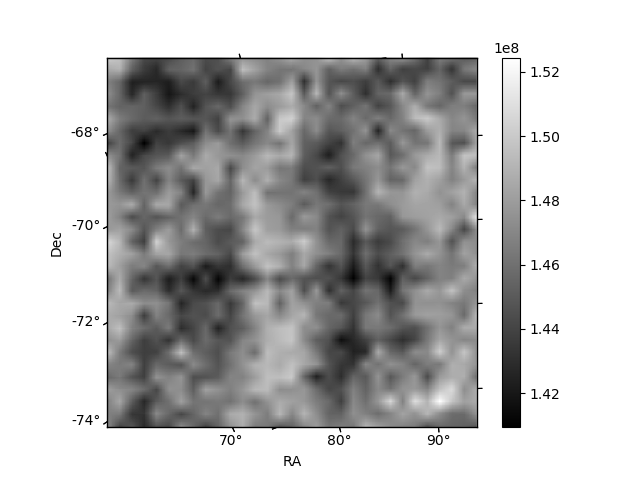
Histogram calculated using DETX and DETY for each event in the final _common_clean file
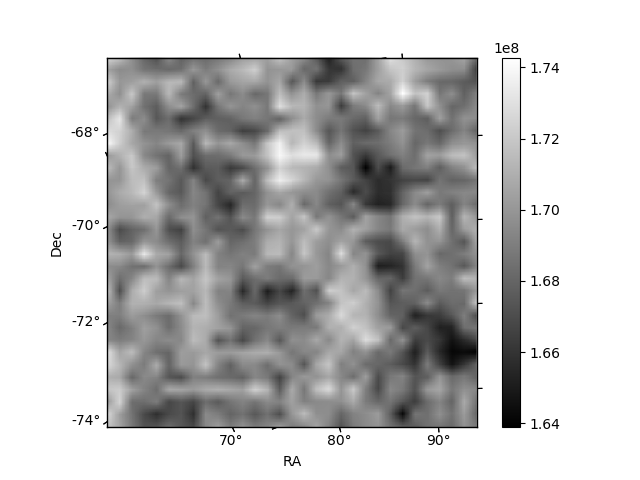
| Quadrant A | 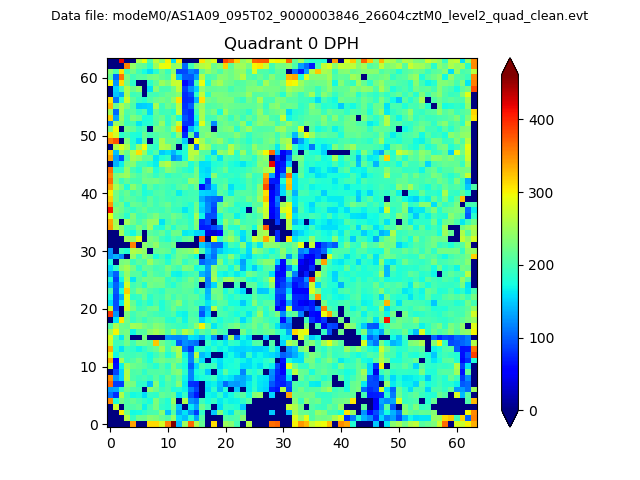 |
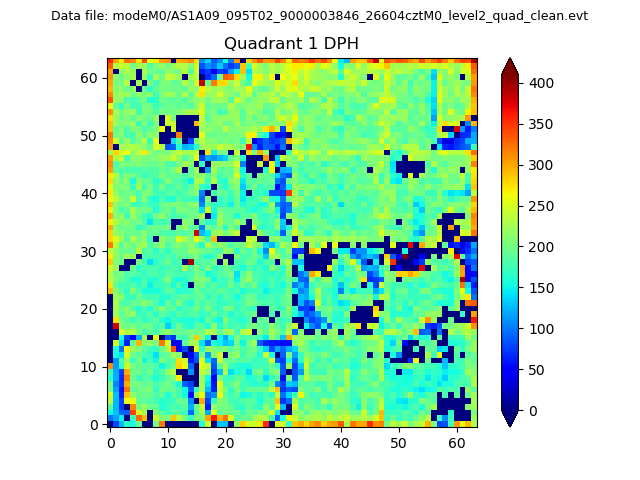 |
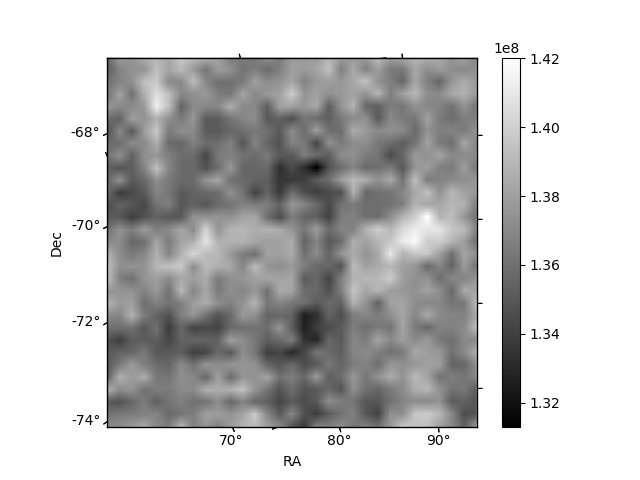
Quadrant B |
|---|---|---|---|
| Quadrant D | 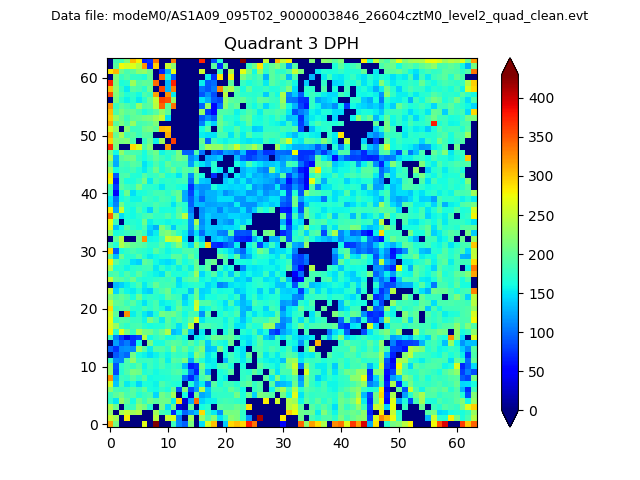 |
 |
Quadrant C |
| Plot type | Count rate plots | Images |
|---|---|---|
| Comparison with Poisson distribution Blue bars denote a histogram of data divided into 1 sec bins. Red curve is a Poisson curve with rate = median count rate of data. |
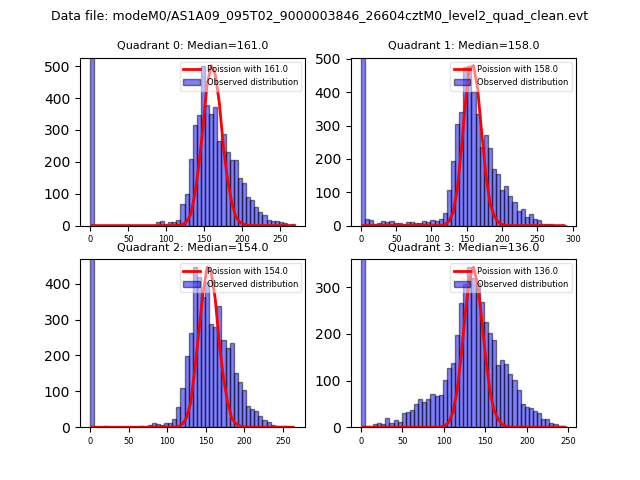 |
 |
| Quadrant-wise count rates Data is divided into 100 sec bins |
 |
|
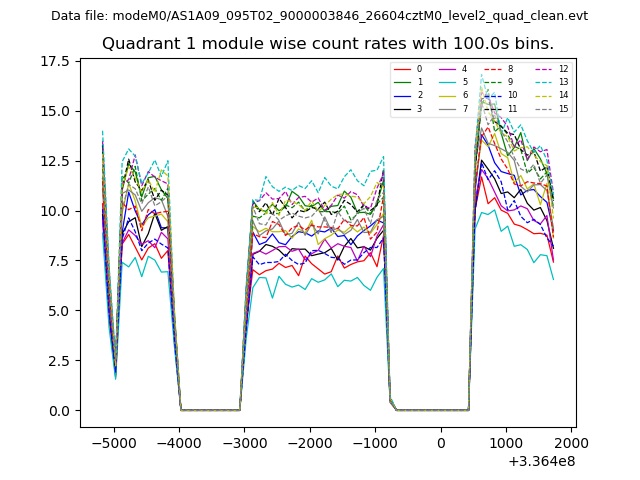
| Module-wise count rates for Quadrant A Data is divided into 100 sec bins |
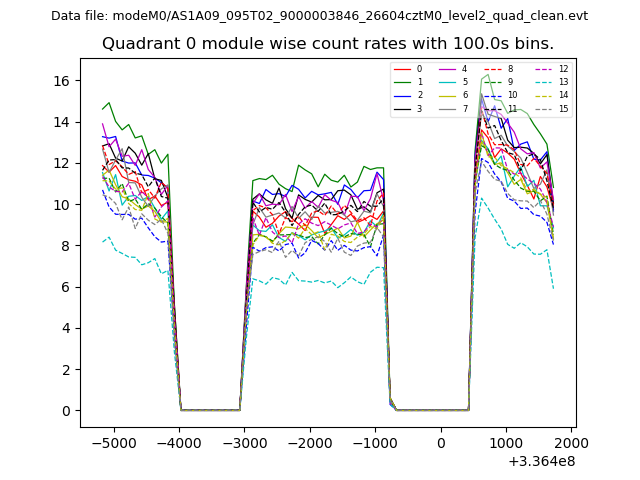 |
 |
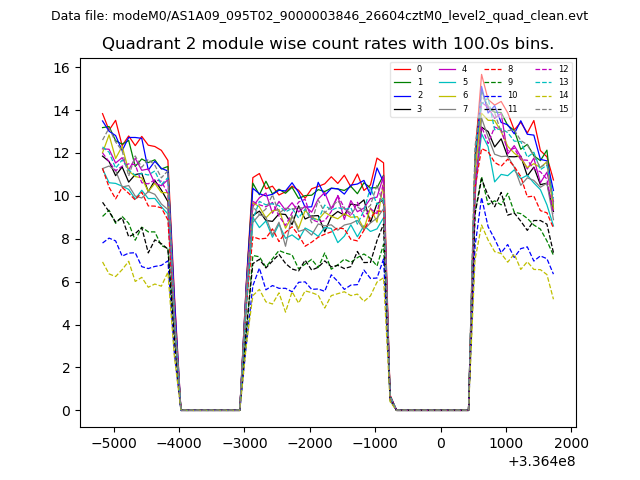
| Module-wise count rates for Quadrant B Data is divided into 100 sec bins |
 |
 |
| Module-wise count rates for Quadrant C Data is divided into 100 sec bins |
 |
 |
| Module-wise count rates for Quadrant D Data is divided into 100 sec bins |
 |
 |
| Parameter | Plot |
|---|---|
| CZT HV Monitor | 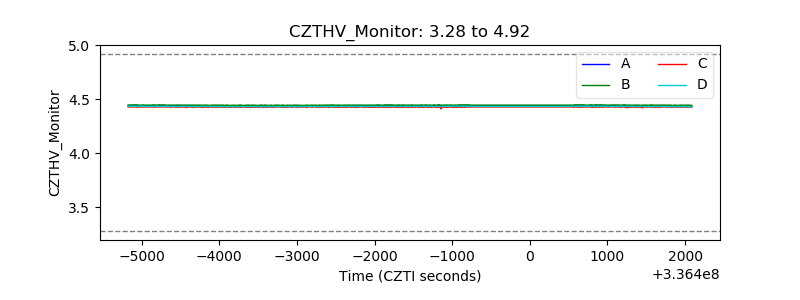 |
| D_VDD | 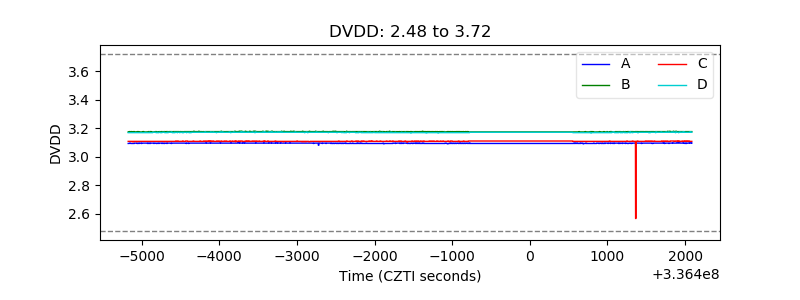 |
| Temperature 1 | 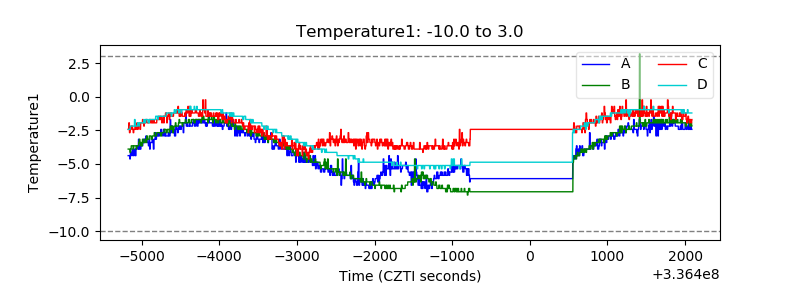 |
| Veto HV Monitor | 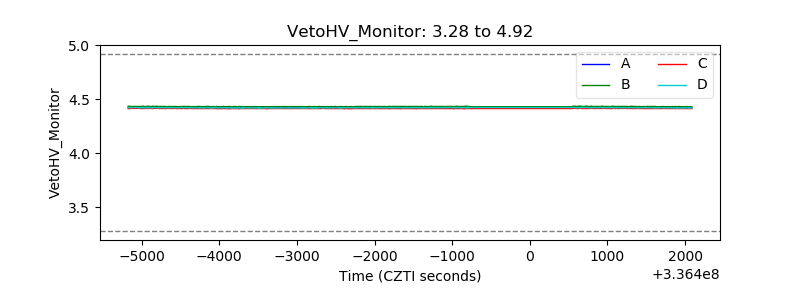 |
| Veto LLD | 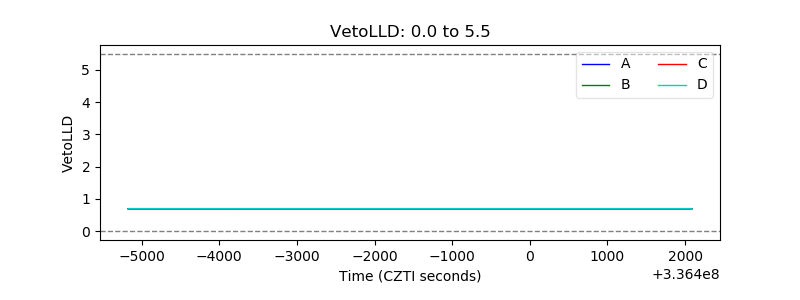 |
| Alpha Counter |  |
| _CPM_Rate | 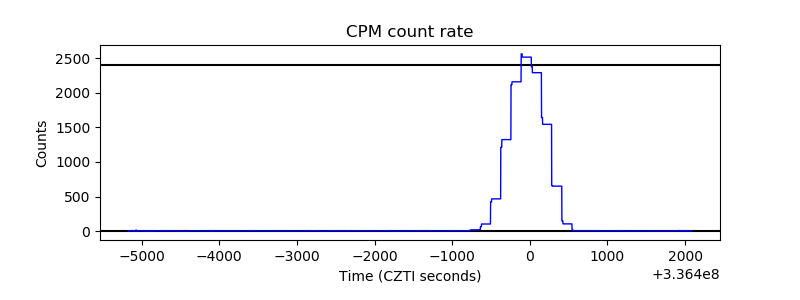 |
| CZT Counter | 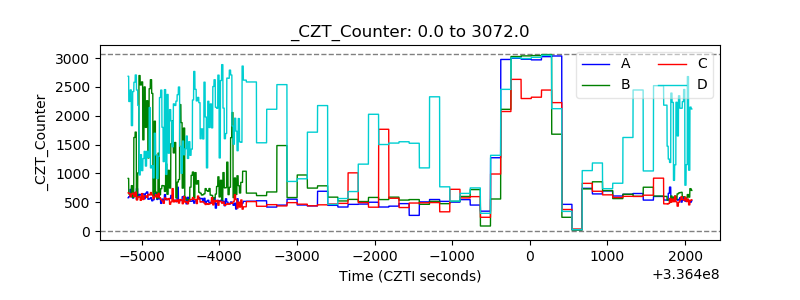 |
| +2.5 Volts monitor | 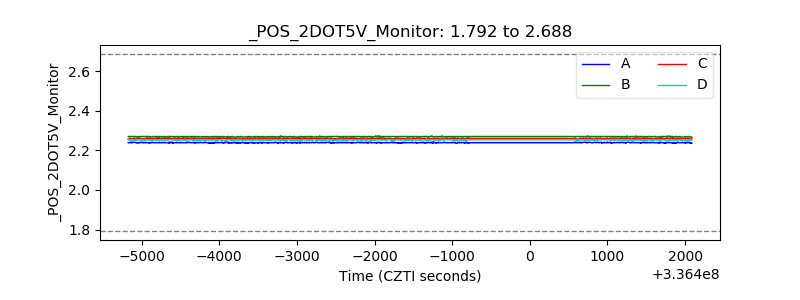 |
| +5 Volts monitor |  |
| _ROLL_ROT | 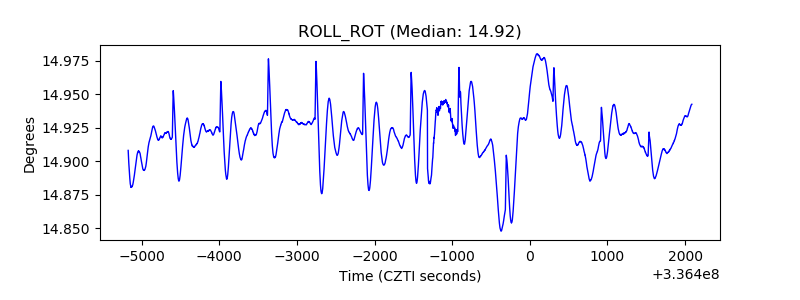 |
| _Roll_DEC |  |
| _Roll_RA | 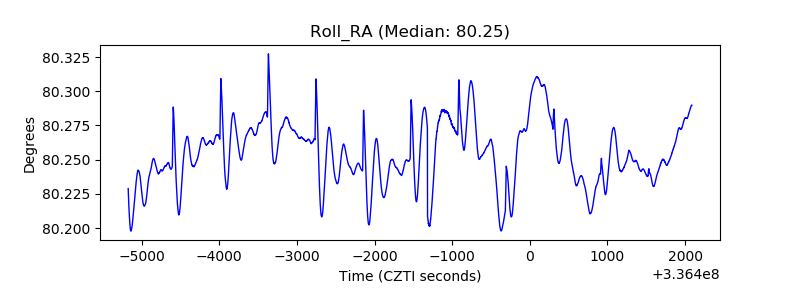 |
| Veto Counter | 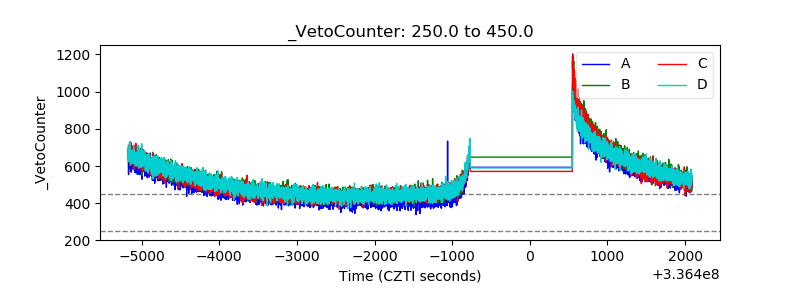 |