| Param | Original file | Final file |
|---|---|---|
| Filename | modeM0/AS1A09_095T02_9000003846_26605cztM0_level2.evt | modeM0/AS1A09_095T02_9000003846_26605cztM0_level2_quad_clean.evt |
| Size (bytes) | 753,736,320 | 98,069,760 |
| Size | 718.8 MB | 93.5 MB |
| Events in quadrant A | 3,261,848 | 704,217 |
| Events in quadrant B | 3,525,906 | 707,119 |
| Events in quadrant C | 3,296,535 | 667,109 |
| Events in quadrant D | 12,330,654 | 464,933 |
| Mode M9 | |||
|---|---|---|---|
| Quadrant | BADHDUFLAG | Total packets | Discarded packets |
| A | 0 | 13 | 0 |
| B | 0 | 13 | 0 |
| C | 0 | 13 | 0 |
| D | 0 | 13 | 0 |
| Mode M0 | |||
|---|---|---|---|
| Quadrant | BADHDUFLAG | Total packets | Discarded packets |
| A | 0 | 13460 | 0 |
| B | 0 | 14370 | 0 |
| C | 0 | 13540 | 0 |
| D | 0 | 40838 | 0 |
| Quadrant | Total seconds | Saturated seconds | Saturation percentage |
|---|---|---|---|
| A | 6092 | 89 | 1.460932% |
| B | 6093 | 109 | 1.788938% |
| C | 6093 | 125 | 2.051535% |
| D | 6093 | 3764 | 61.775808% |
Noise dominated data is calculated using 1-second bins in cleaned event files. If a bin has >2000 counts, and if more than 50% of those come from <1% of pixels, then it is considered to be noise-dominated and hence unusable.
| Quadrant | # 1 sec bins | Bins with >0 counts | Bins with >2000 counts | High rate bins dominated by noise | Noise dominated (total time) | Noise dominated (detector-on time) | Marked lightcurve |
|---|---|---|---|---|---|---|---|
| A | 7407 | 6093 | 0 | 0 | 0.00% | 0.00% | 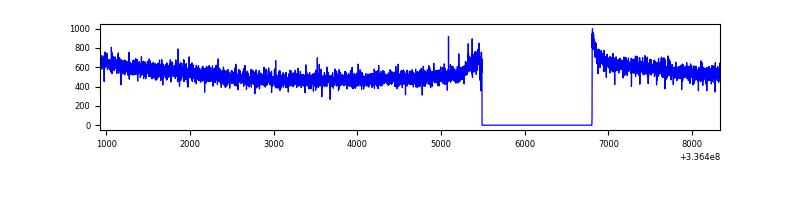 |
| B | 7407 | 6093 | 7 | 7 | 0.09% | 0.11% | 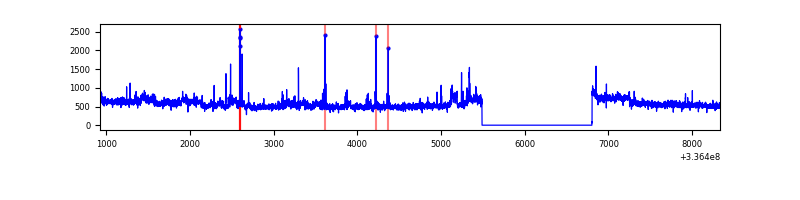 |
| C | 7408 | 6094 | 12 | 12 | 0.16% | 0.20% | 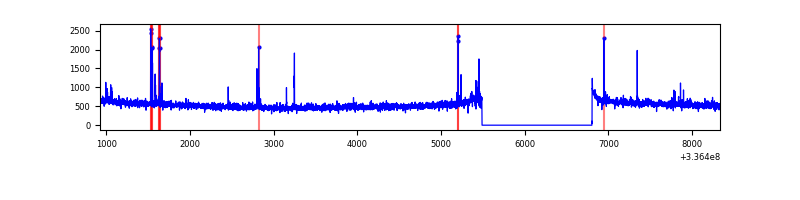 |
| D | 7408 | 6094 | 3745 | 3745 | 50.55% | 61.45% | 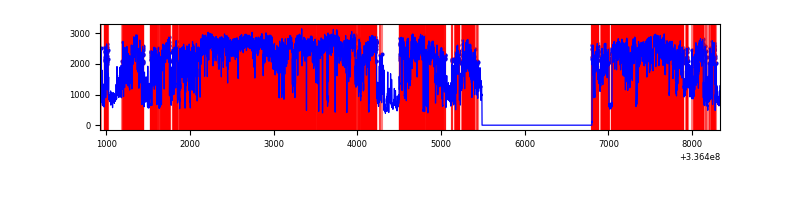 |
Top three noisy pixels from each quadrant. If the there are fewer than three noisy pixels in the level2.evt file, extra rows are filled as -1
| Pixel properties | Quadrant properties | ||||||
|---|---|---|---|---|---|---|---|
| Quadrant | DetID | PixID | Counts | Sigma | Mean | Median | Sigma |
| A | 0 | 13 | 18287 | 107.26 | 837 | 823 | 162.8 |
| A | 5 | 168 | 13997 | 80.91 | 837 | 823 | 162.8 |
| A | 13 | 254 | 8743 | 48.64 | 837 | 823 | 162.8 |
| B | 0 | 189 | 214712 | 1417.57 | 820 | 805 | 150.9 |
| B | 3 | 64 | 71791 | 470.43 | 820 | 805 | 150.9 |
| B | 12 | 111 | 17255 | 109.01 | 820 | 805 | 150.9 |
| C | 14 | 238 | 129935 | 714.75 | 782 | 788 | 180.7 |
| C | 2 | 16 | 41570 | 225.7 | 782 | 788 | 180.7 |
| C | 15 | 208 | 39049 | 211.75 | 782 | 788 | 180.7 |
| D | 1 | 52 | 8623999 | 59604.87 | 603 | 585 | 144.7 |
| D | 12 | 233 | 703659 | 4859.63 | 603 | 585 | 144.7 |
| D | 7 | 80 | 465324 | 3212.27 | 603 | 585 | 144.7 |
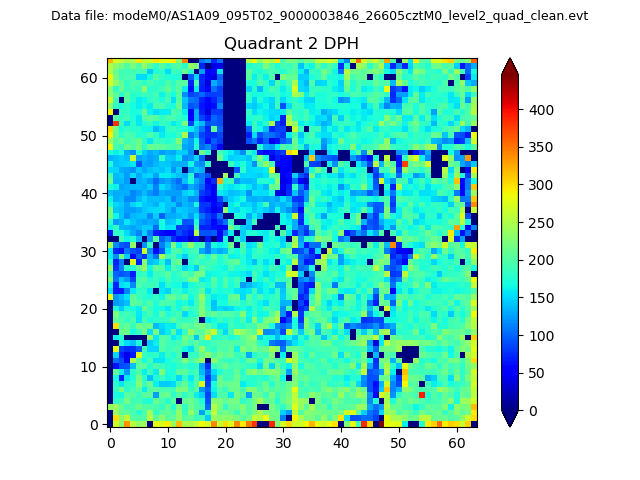
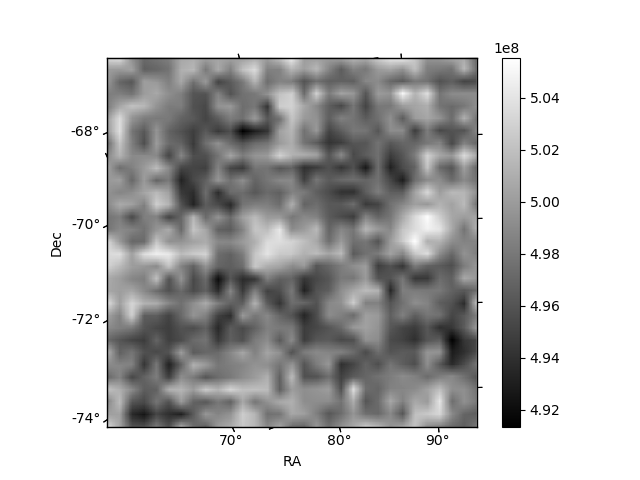
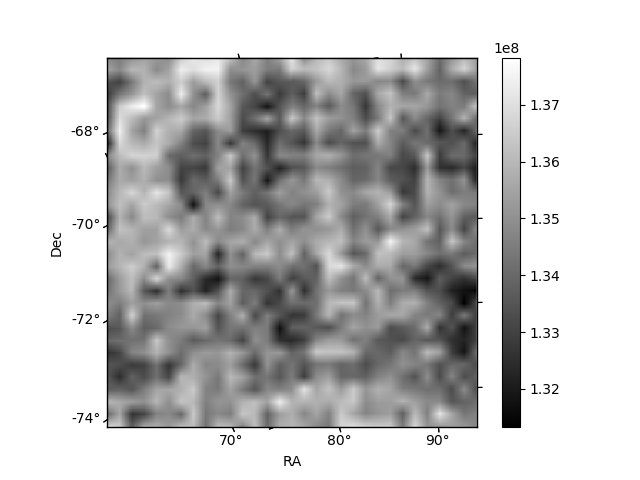
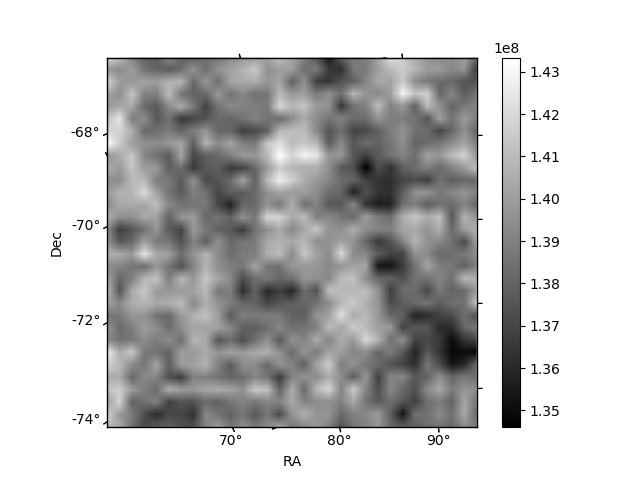
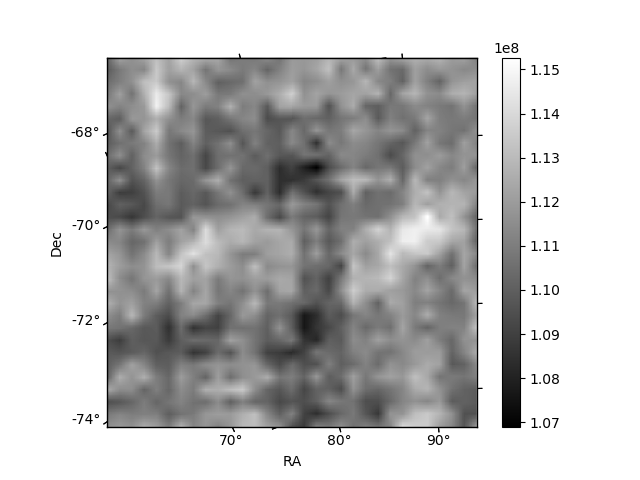
Histogram calculated using DETX and DETY for each event in the final _common_clean file
| Quadrant A | 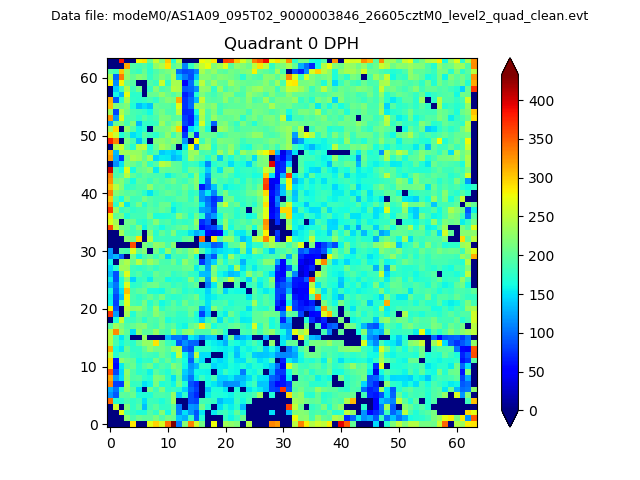 |
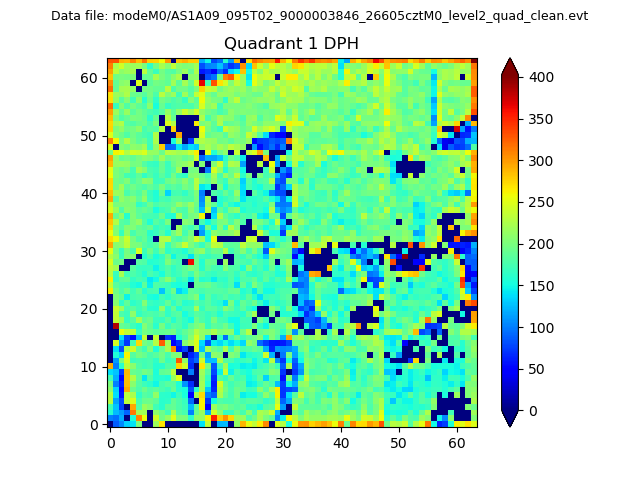 |
Quadrant B |
|---|---|---|---|
| Quadrant D | 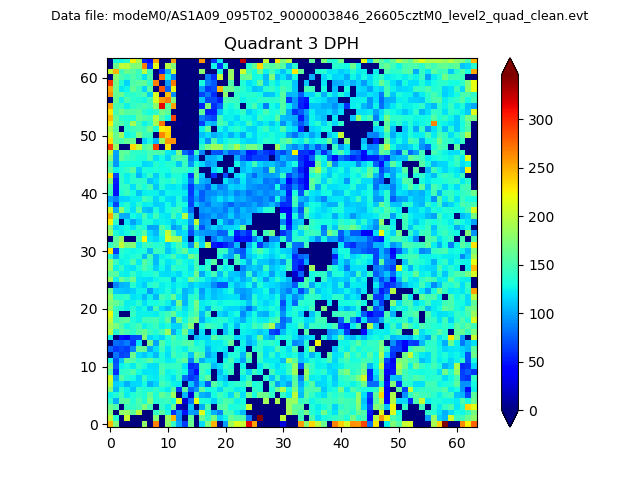 |
 |
Quadrant C |
| Plot type | Count rate plots | Images |
|---|---|---|
| Comparison with Poisson distribution Blue bars denote a histogram of data divided into 1 sec bins. Red curve is a Poisson curve with rate = median count rate of data. |
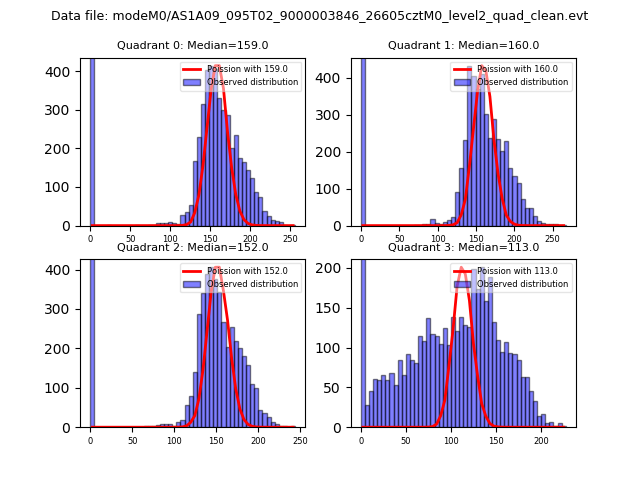 |
 |
| Quadrant-wise count rates Data is divided into 100 sec bins |
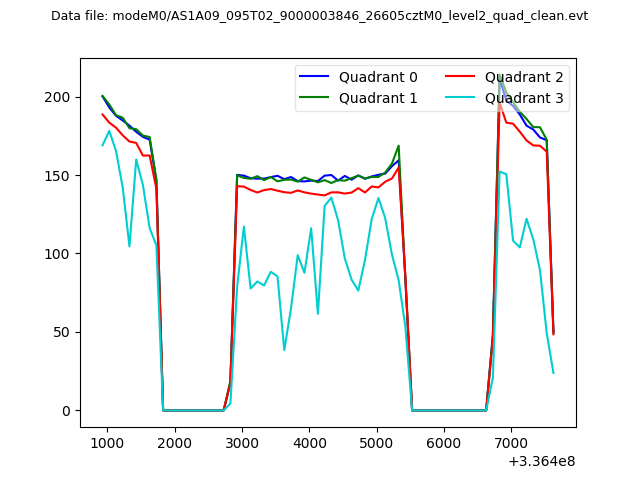 |
|
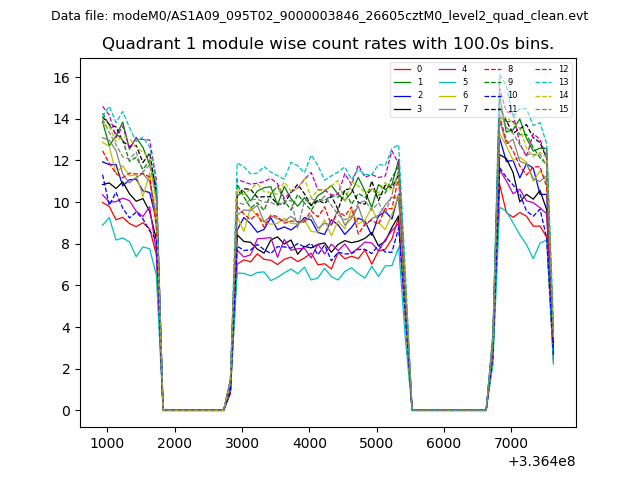
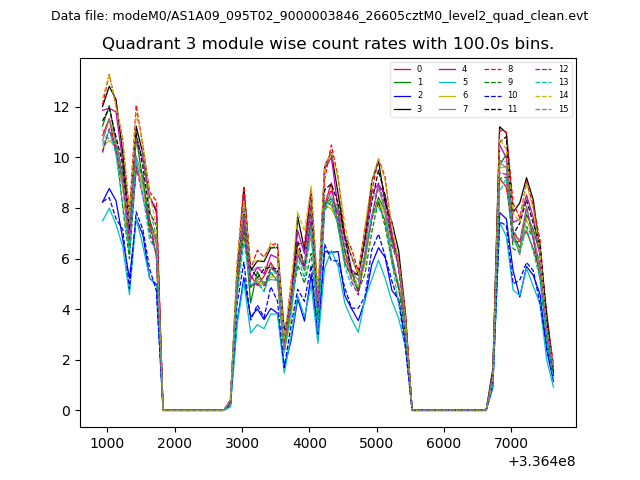
| Module-wise count rates for Quadrant A Data is divided into 100 sec bins |
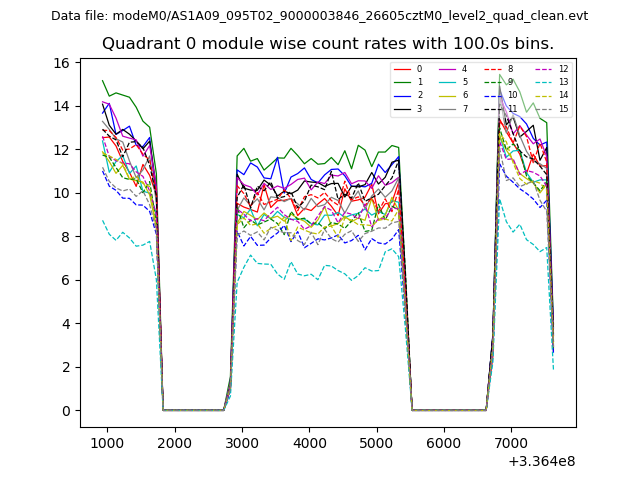 |
 |
| Module-wise count rates for Quadrant B Data is divided into 100 sec bins |
 |
 |
| Module-wise count rates for Quadrant C Data is divided into 100 sec bins |
 |
 |
| Module-wise count rates for Quadrant D Data is divided into 100 sec bins |
 |
 |
| Parameter | Plot |
|---|---|
| CZT HV Monitor | 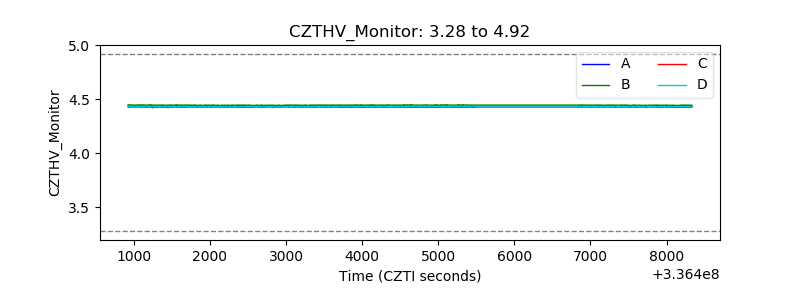 |
| D_VDD | 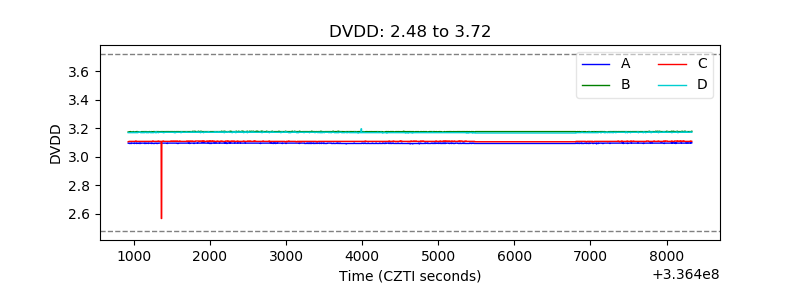 |
| Temperature 1 | 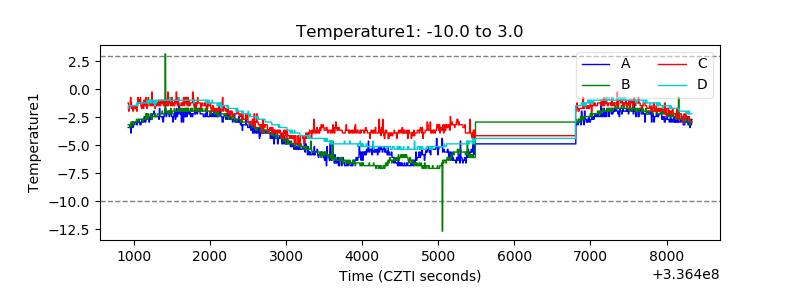 |
| Veto HV Monitor | 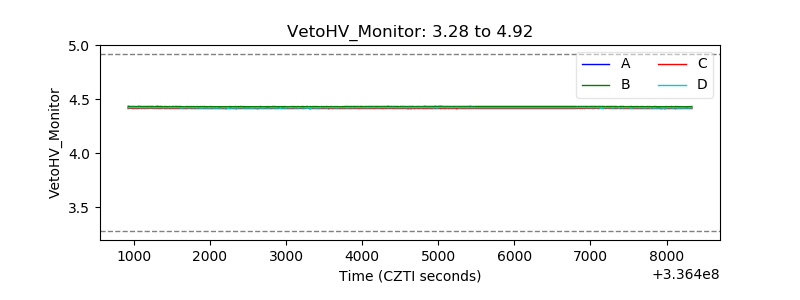 |
| Veto LLD | 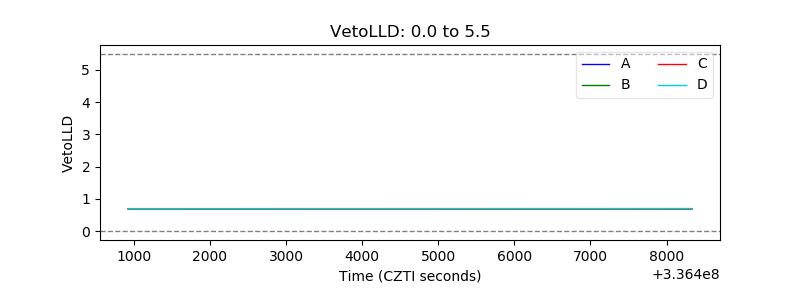 |
| Alpha Counter | 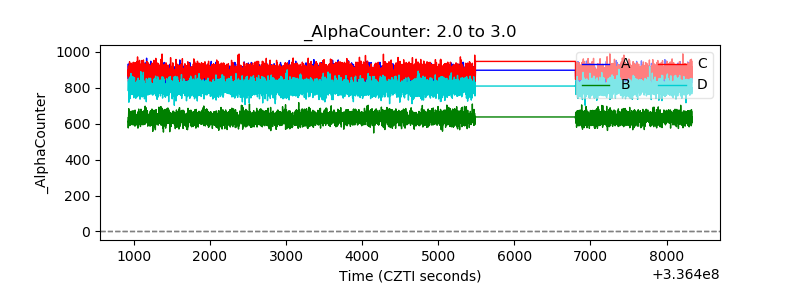 |
| _CPM_Rate | 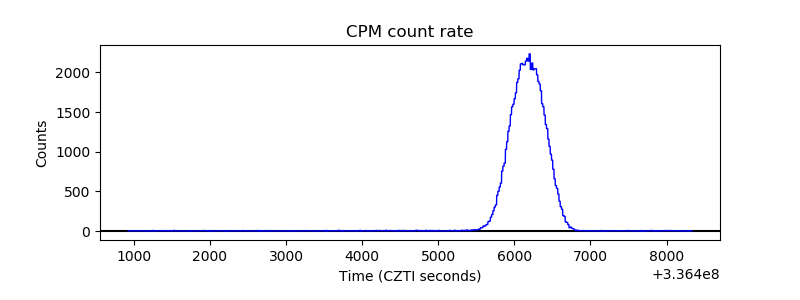 |
| CZT Counter | 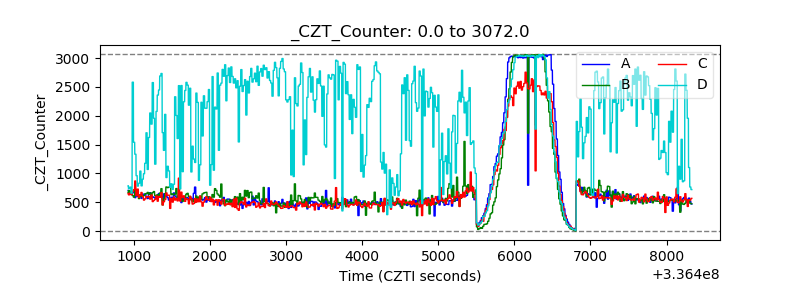 |
| +2.5 Volts monitor |  |
| +5 Volts monitor |  |
| _ROLL_ROT | 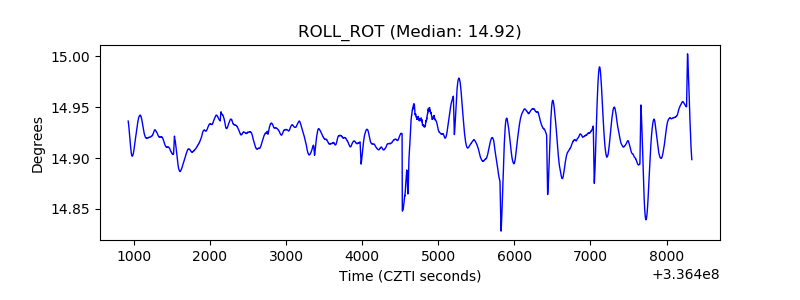 |
| _Roll_DEC | 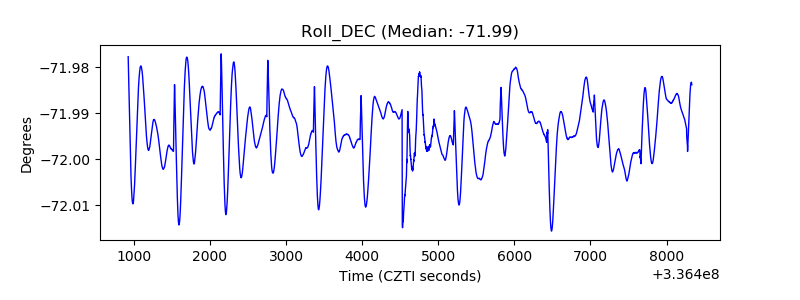 |
| _Roll_RA | 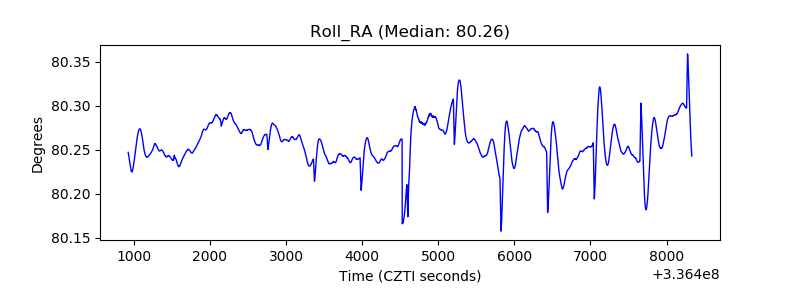 |
| Veto Counter | 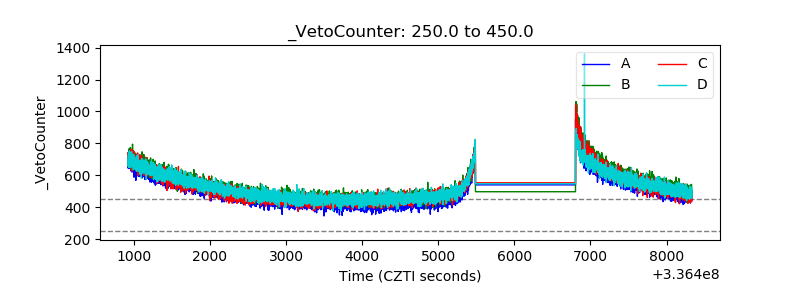 |