| Param | Original file | Final file |
|---|---|---|
| Filename | modeM0/AS1A09_095T02_9000003846_26606cztM0_level2.evt | modeM0/AS1A09_095T02_9000003846_26606cztM0_level2_quad_clean.evt |
| Size (bytes) | 662,152,320 | 92,456,640 |
| Size | 631.5 MB | 88.2 MB |
| Events in quadrant A | 3,264,270 | 633,051 |
| Events in quadrant B | 3,470,856 | 638,148 |
| Events in quadrant C | 3,586,651 | 598,925 |
| Events in quadrant D | 9,306,713 | 490,999 |
| Mode M9 | |||
|---|---|---|---|
| Quadrant | BADHDUFLAG | Total packets | Discarded packets |
| A | 0 | 12 | 0 |
| B | 0 | 12 | 0 |
| C | 0 | 12 | 0 |
| D | 0 | 12 | 0 |
| Mode M0 | |||
|---|---|---|---|
| Quadrant | BADHDUFLAG | Total packets | Discarded packets |
| A | 0 | 13486 | 0 |
| B | 0 | 14017 | 0 |
| C | 0 | 14537 | 0 |
| D | 0 | 32065 | 0 |
| Quadrant | Total seconds | Saturated seconds | Saturation percentage |
|---|---|---|---|
| A | 6275 | 104 | 1.657371% |
| B | 6275 | 140 | 2.231076% |
| C | 6275 | 216 | 3.442231% |
| D | 6275 | 2031 | 32.366534% |
Noise dominated data is calculated using 1-second bins in cleaned event files. If a bin has >2000 counts, and if more than 50% of those come from <1% of pixels, then it is considered to be noise-dominated and hence unusable.
| Quadrant | # 1 sec bins | Bins with >0 counts | Bins with >2000 counts | High rate bins dominated by noise | Noise dominated (total time) | Noise dominated (detector-on time) | Marked lightcurve |
|---|---|---|---|---|---|---|---|
| A | 7505 | 6276 | 0 | 0 | 0.00% | 0.00% |  |
| B | 7505 | 6276 | 5 | 5 | 0.07% | 0.08% |  |
| C | 7505 | 6276 | 43 | 43 | 0.57% | 0.69% |  |
| D | 7505 | 6276 | 1972 | 1972 | 26.28% | 31.42% |  |
Top three noisy pixels from each quadrant. If the there are fewer than three noisy pixels in the level2.evt file, extra rows are filled as -1
| Pixel properties | Quadrant properties | ||||||
|---|---|---|---|---|---|---|---|
| Quadrant | DetID | PixID | Counts | Sigma | Mean | Median | Sigma |
| A | 0 | 13 | 29470 | 174.28 | 834 | 822 | 164.4 |
| A | 5 | 168 | 14069 | 80.59 | 834 | 822 | 164.4 |
| A | 13 | 254 | 10073 | 56.28 | 834 | 822 | 164.4 |
| B | 3 | 64 | 134051 | 885.3 | 820 | 803 | 150.5 |
| B | 0 | 189 | 75946 | 499.25 | 820 | 803 | 150.5 |
| B | 12 | 111 | 17551 | 111.27 | 820 | 803 | 150.5 |
| C | 15 | 208 | 286739 | 1606.83 | 778 | 783 | 178.0 |
| C | 14 | 238 | 129931 | 725.7 | 778 | 783 | 178.0 |
| C | 3 | 233 | 120183 | 670.92 | 778 | 783 | 178.0 |
| D | 1 | 52 | 4980478 | 29993.19 | 692 | 673 | 166.0 |
| D | 7 | 80 | 1482898 | 8927.39 | 692 | 673 | 166.0 |
| D | 2 | 250 | 191281 | 1148.03 | 692 | 673 | 166.0 |
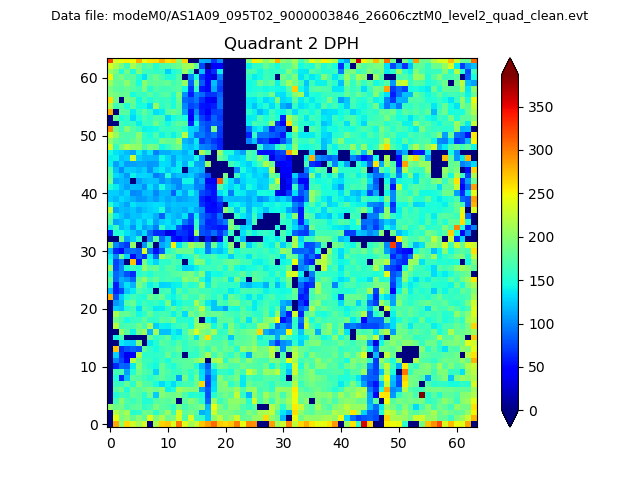
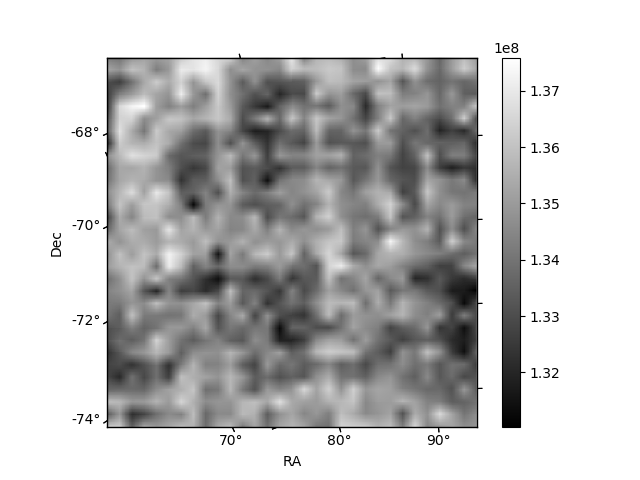
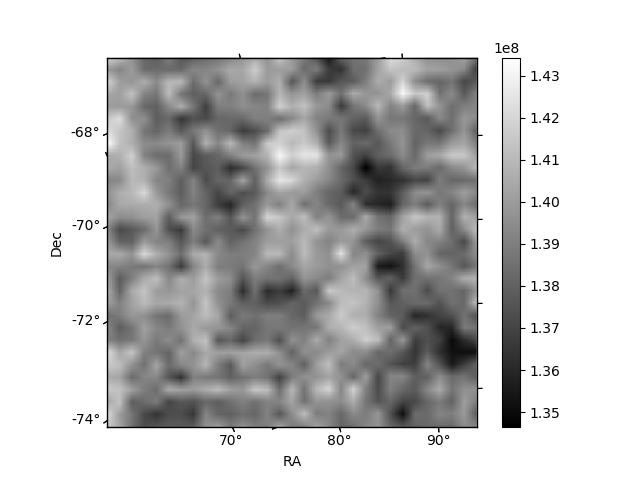
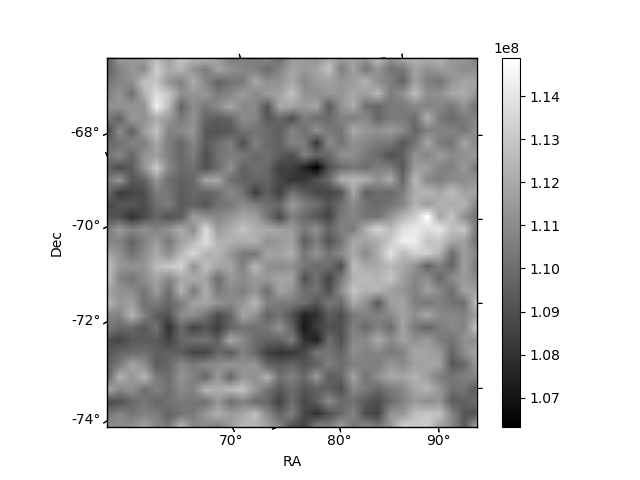
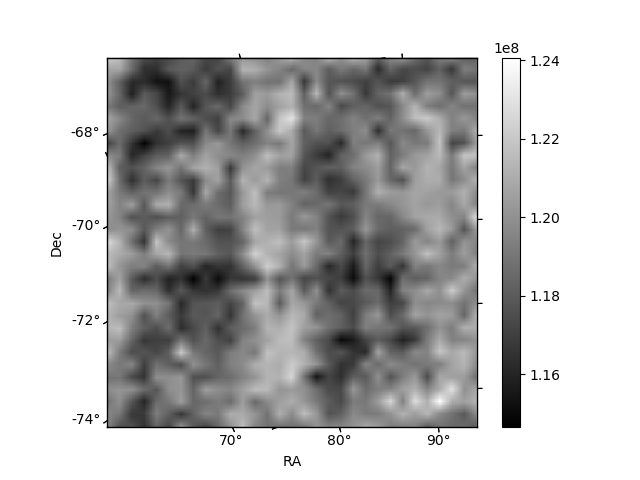
Histogram calculated using DETX and DETY for each event in the final _common_clean file
| Quadrant A | 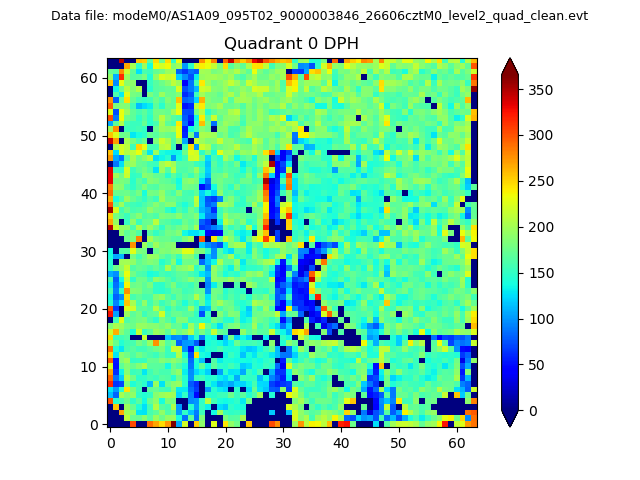 |
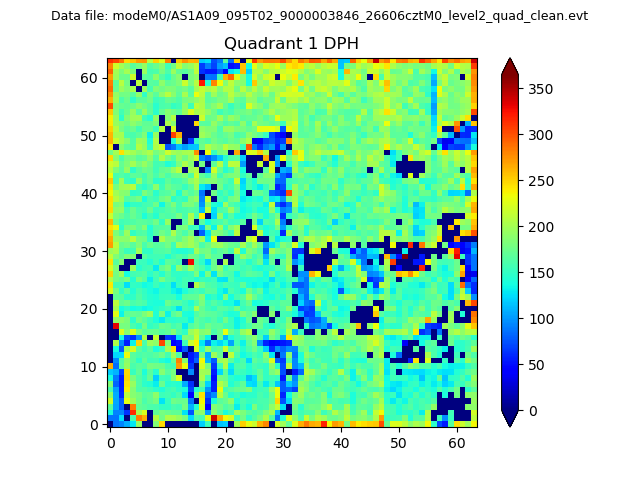 |
Quadrant B |
|---|---|---|---|
| Quadrant D | 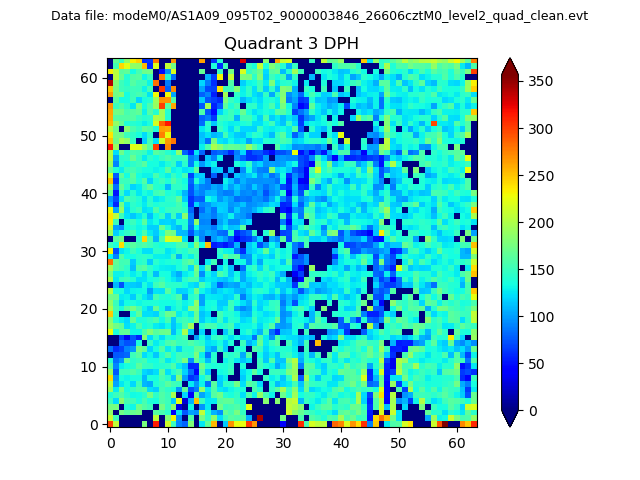 |
 |
Quadrant C |
| Plot type | Count rate plots | Images |
|---|---|---|
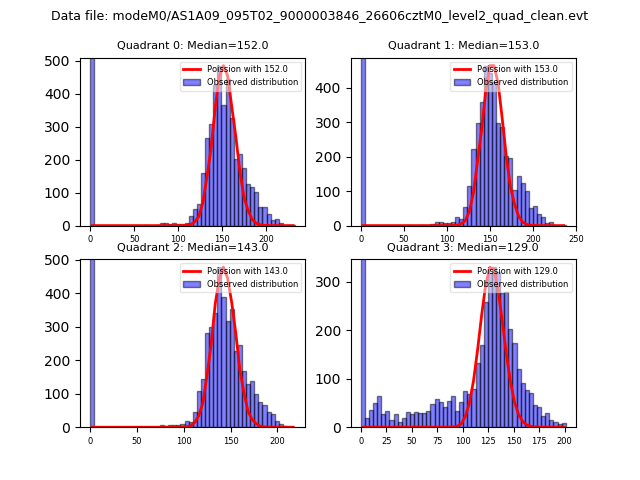
| Comparison with Poisson distribution Blue bars denote a histogram of data divided into 1 sec bins. Red curve is a Poisson curve with rate = median count rate of data. |
 |
 |
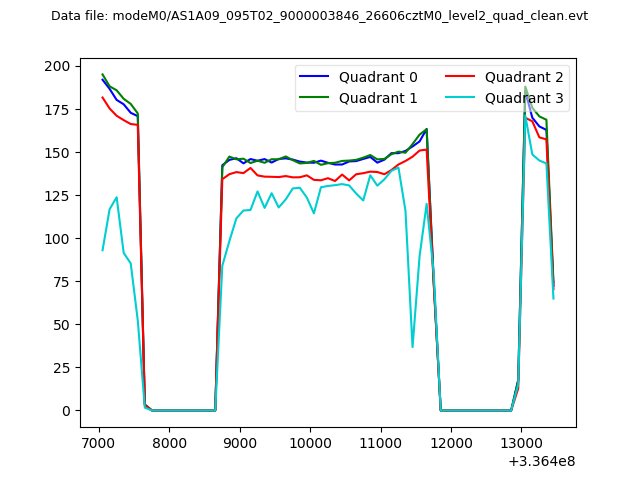
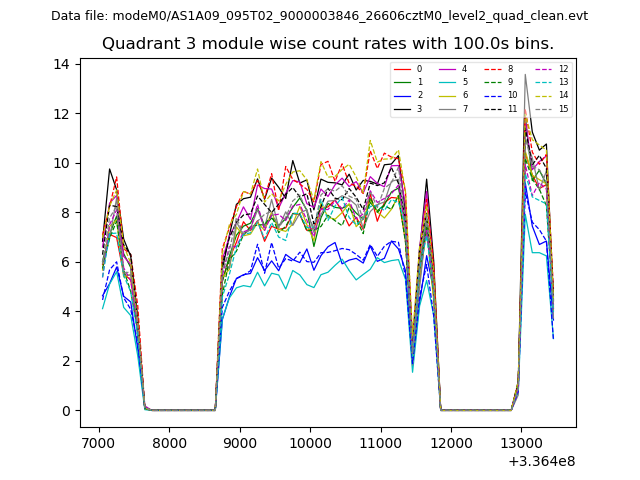
| Quadrant-wise count rates Data is divided into 100 sec bins |
 |
|
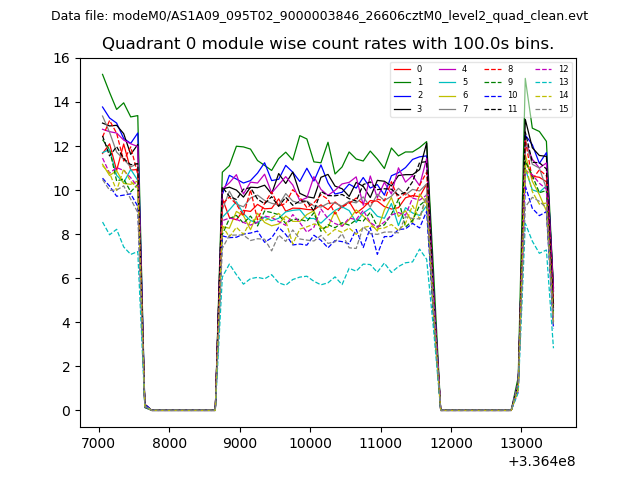
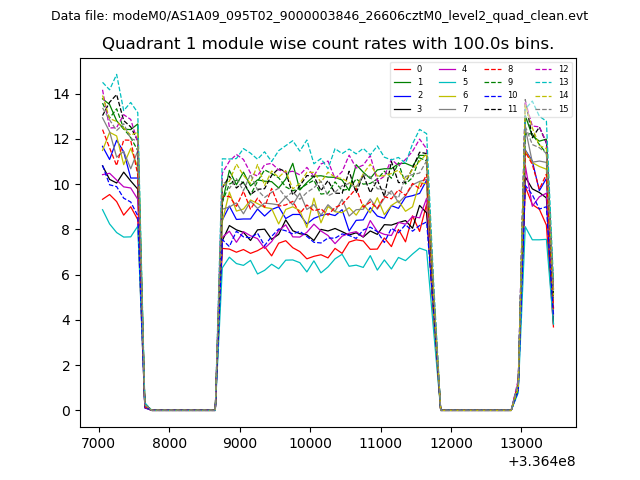
| Module-wise count rates for Quadrant A Data is divided into 100 sec bins |
 |
 |
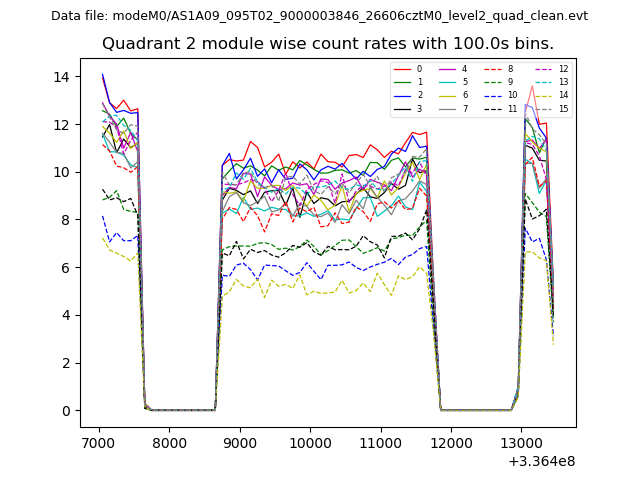
| Module-wise count rates for Quadrant B Data is divided into 100 sec bins |
 |
 |
| Module-wise count rates for Quadrant C Data is divided into 100 sec bins |
 |
 |
| Module-wise count rates for Quadrant D Data is divided into 100 sec bins |
 |
 |
| Parameter | Plot |
|---|---|
| CZT HV Monitor | 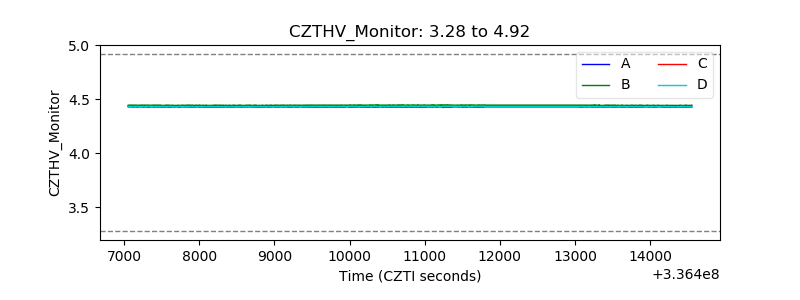 |
| D_VDD | 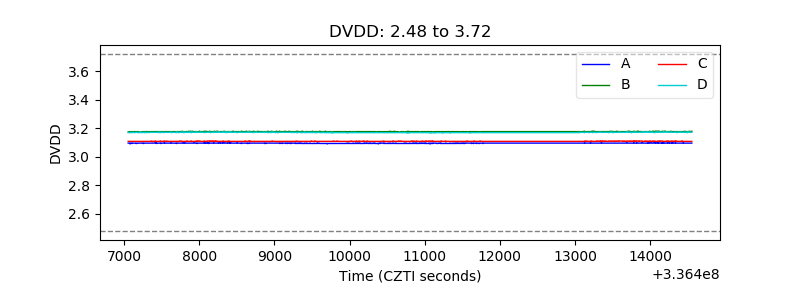 |
| Temperature 1 | 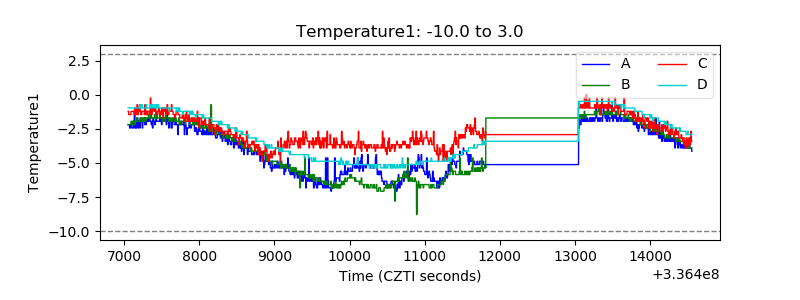 |
| Veto HV Monitor | 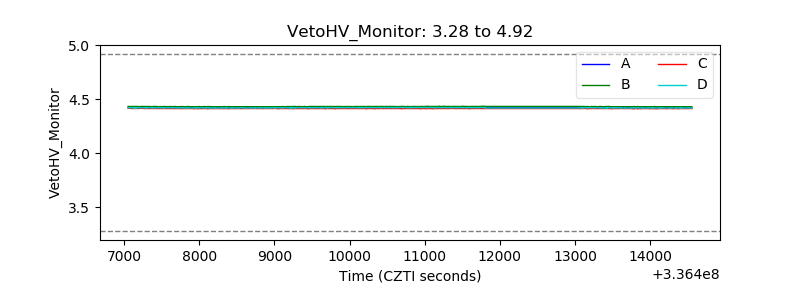 |
| Veto LLD | 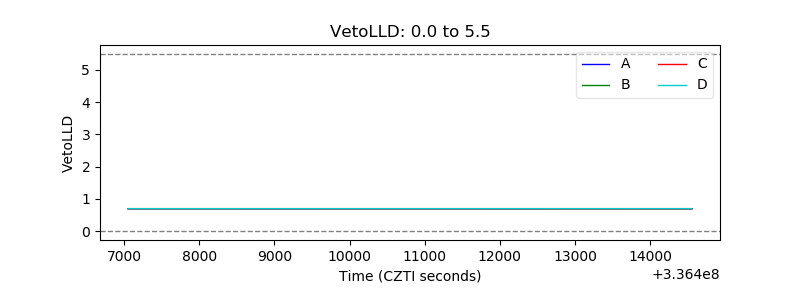 |
| Alpha Counter |  |
| _CPM_Rate |  |
| CZT Counter | 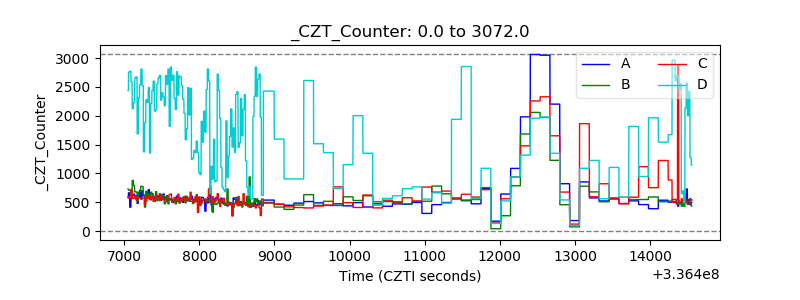 |
| +2.5 Volts monitor |  |
| +5 Volts monitor |  |
| _ROLL_ROT | 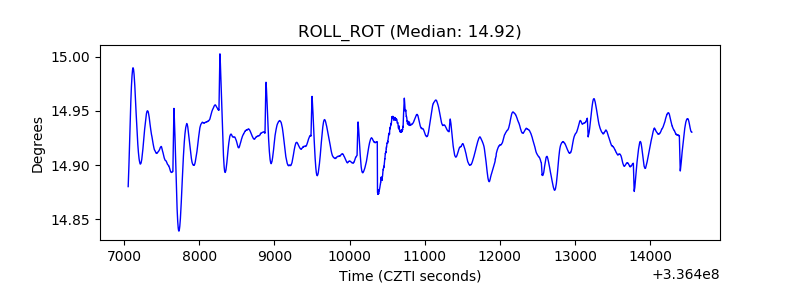 |
| _Roll_DEC | 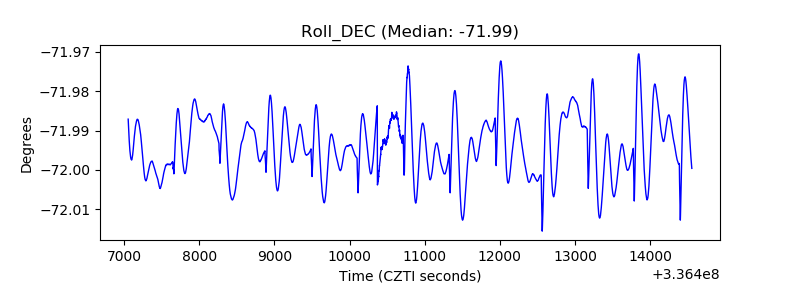 |
| _Roll_RA | 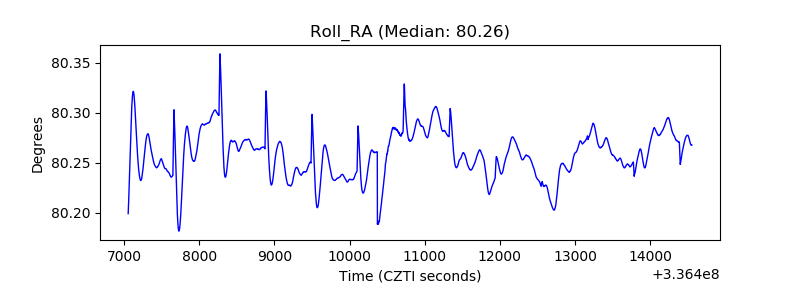 |
| Veto Counter | 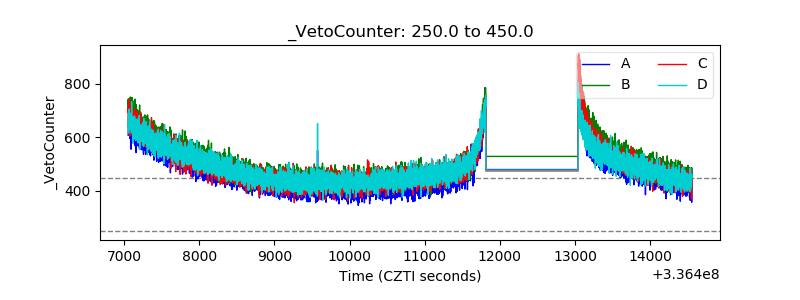 |