| Param | Original file | Final file |
|---|---|---|
| Filename | modeM0/AS1A09_095T02_9000003846_26607cztM0_level2.evt | modeM0/AS1A09_095T02_9000003846_26607cztM0_level2_quad_clean.evt |
| Size (bytes) | 612,587,520 | 82,105,920 |
| Size | 584.2 MB | 78.3 MB |
| Events in quadrant A | 3,023,429 | 545,495 |
| Events in quadrant B | 3,243,836 | 548,901 |
| Events in quadrant C | 3,397,854 | 520,313 |
| Events in quadrant D | 8,475,039 | 445,936 |
| Mode M9 | |||
|---|---|---|---|
| Quadrant | BADHDUFLAG | Total packets | Discarded packets |
| A | 0 | 11 | 0 |
| B | 0 | 11 | 0 |
| C | 0 | 11 | 0 |
| D | 0 | 11 | 0 |
| Mode M0 | |||
|---|---|---|---|
| Quadrant | BADHDUFLAG | Total packets | Discarded packets |
| A | 0 | 12666 | 0 |
| B | 0 | 13268 | 0 |
| C | 0 | 13890 | 0 |
| D | 0 | 29399 | 0 |
| Quadrant | Total seconds | Saturated seconds | Saturation percentage |
|---|---|---|---|
| A | 6095 | 38 | 0.623462% |
| B | 6095 | 91 | 1.493027% |
| C | 6096 | 126 | 2.066929% |
| D | 6096 | 1588 | 26.049869% |
Noise dominated data is calculated using 1-second bins in cleaned event files. If a bin has >2000 counts, and if more than 50% of those come from <1% of pixels, then it is considered to be noise-dominated and hence unusable.
| Quadrant | # 1 sec bins | Bins with >0 counts | Bins with >2000 counts | High rate bins dominated by noise | Noise dominated (total time) | Noise dominated (detector-on time) | Marked lightcurve |
|---|---|---|---|---|---|---|---|
| A | 7150 | 6097 | 1 | 1 | 0.01% | 0.02% | 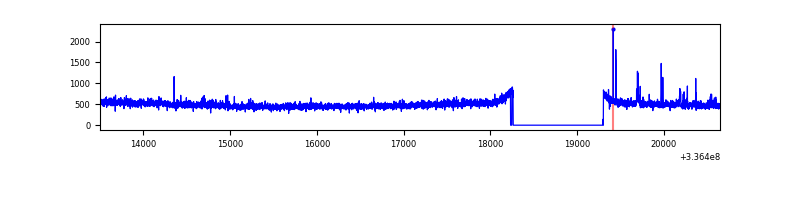 |
| B | 7150 | 6097 | 20 | 20 | 0.28% | 0.33% | 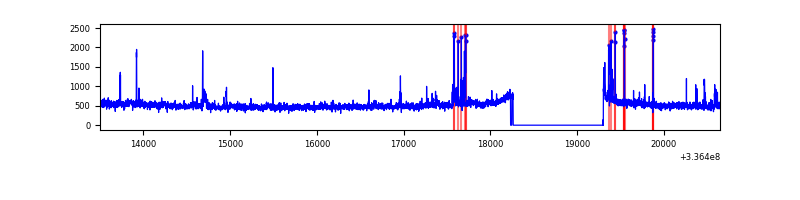 |
| C | 7151 | 6098 | 46 | 46 | 0.64% | 0.75% | 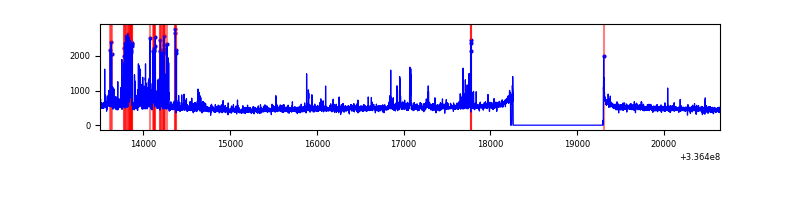 |
| D | 7151 | 6098 | 1679 | 1679 | 23.48% | 27.53% | 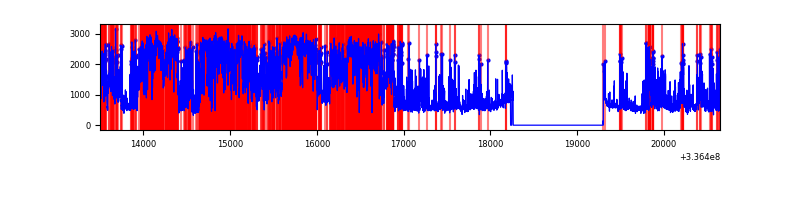 |
Top three noisy pixels from each quadrant. If the there are fewer than three noisy pixels in the level2.evt file, extra rows are filled as -1
| Pixel properties | Quadrant properties | ||||||
|---|---|---|---|---|---|---|---|
| Quadrant | DetID | PixID | Counts | Sigma | Mean | Median | Sigma |
| A | 0 | 13 | 64973 | 423.01 | 763 | 747 | 151.8 |
| A | 5 | 168 | 16490 | 103.69 | 763 | 747 | 151.8 |
| A | 13 | 254 | 10861 | 66.61 | 763 | 747 | 151.8 |
| B | 0 | 189 | 114464 | 823.22 | 752 | 735 | 138.2 |
| B | 3 | 64 | 84523 | 606.5 | 752 | 735 | 138.2 |
| B | 5 | 172 | 49080 | 349.94 | 752 | 735 | 138.2 |
| C | 15 | 208 | 298249 | 1796.39 | 719 | 723 | 165.6 |
| C | 3 | 233 | 160713 | 965.98 | 719 | 723 | 165.6 |
| C | 14 | 238 | 117852 | 707.2 | 719 | 723 | 165.6 |
| D | 1 | 52 | 5003454 | 31280.69 | 669 | 650 | 159.9 |
| D | 7 | 80 | 634001 | 3960.11 | 669 | 650 | 159.9 |
| D | 2 | 250 | 257983 | 1609.01 | 669 | 650 | 159.9 |
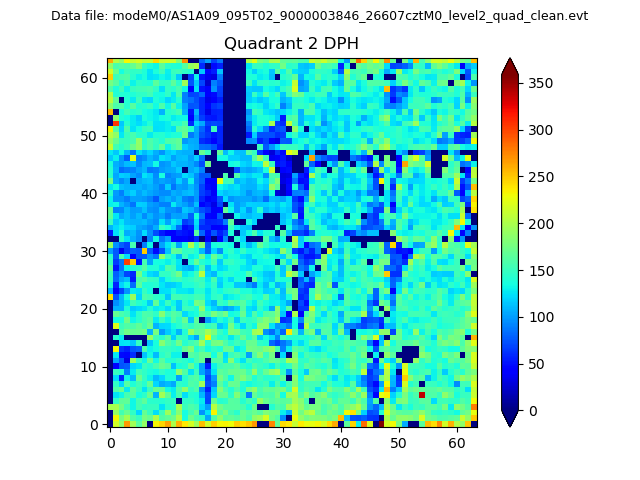
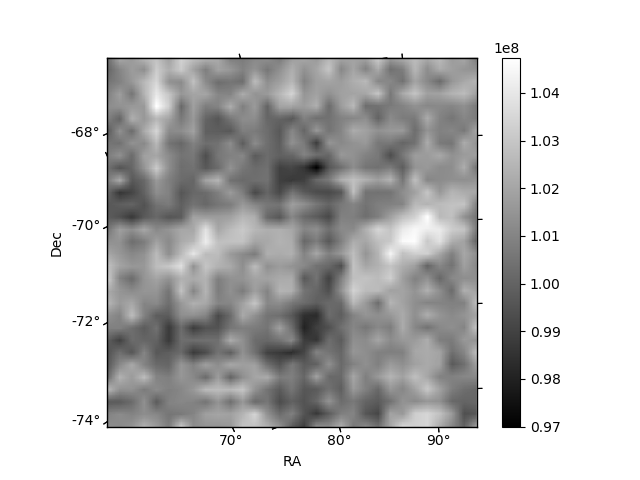
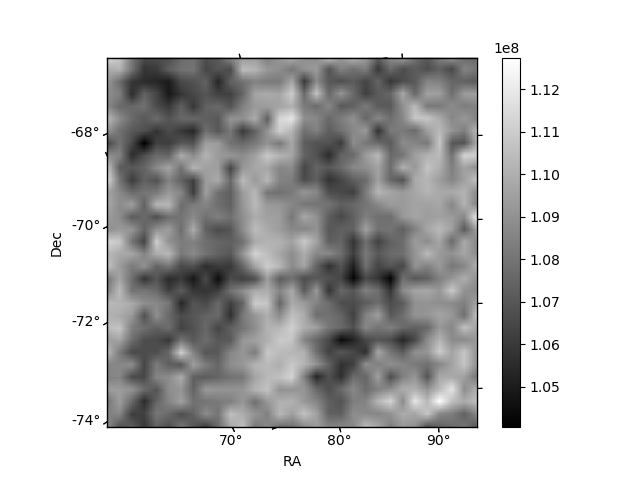
Histogram calculated using DETX and DETY for each event in the final _common_clean file
| Quadrant A | 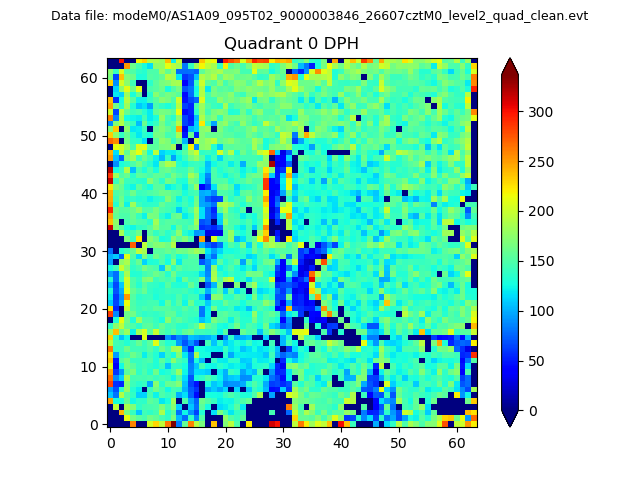 |
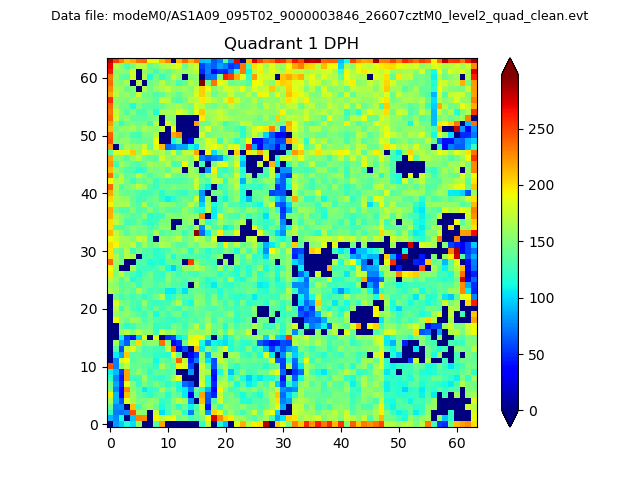 |
Quadrant B |
|---|---|---|---|
| Quadrant D | 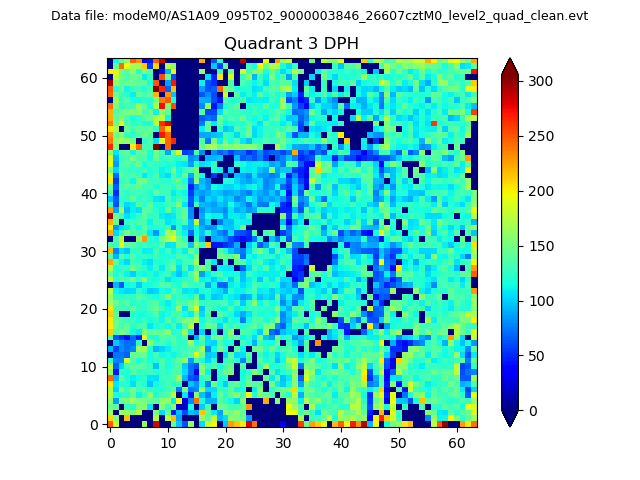 |
 |
Quadrant C |
| Plot type | Count rate plots | Images |
|---|---|---|
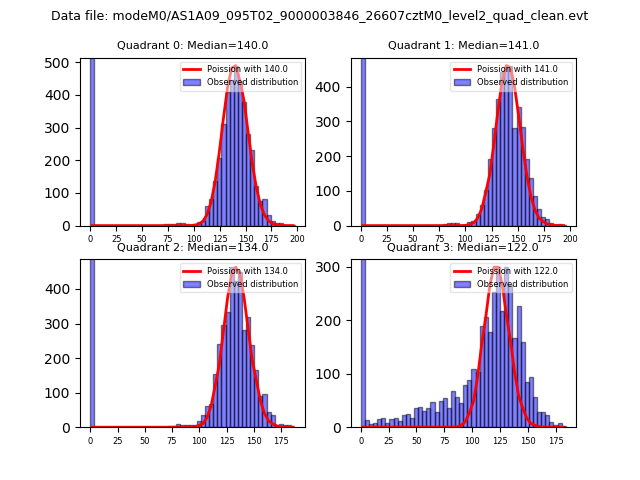
| Comparison with Poisson distribution Blue bars denote a histogram of data divided into 1 sec bins. Red curve is a Poisson curve with rate = median count rate of data. |
 |
 |
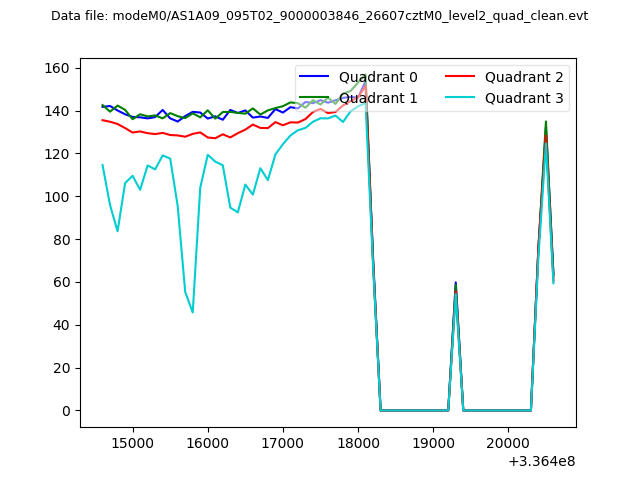
| Quadrant-wise count rates Data is divided into 100 sec bins |
 |
|
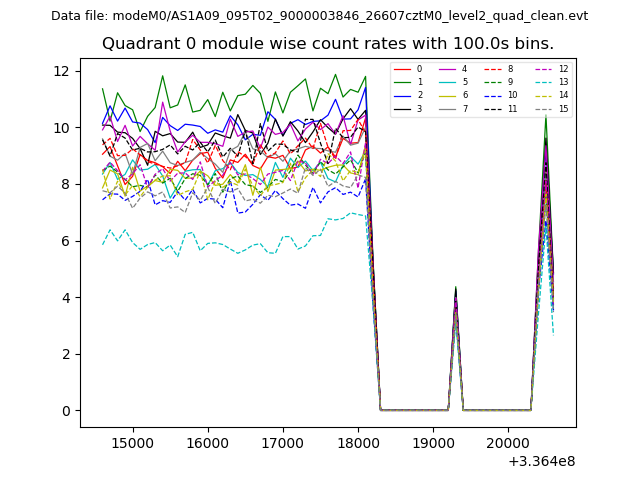
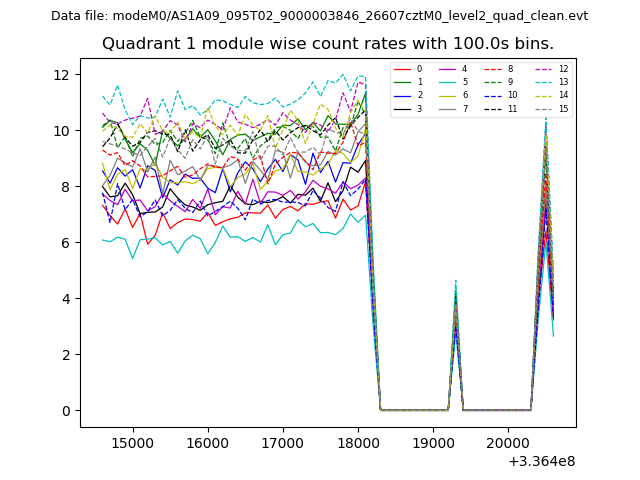
| Module-wise count rates for Quadrant A Data is divided into 100 sec bins |
 |
 |
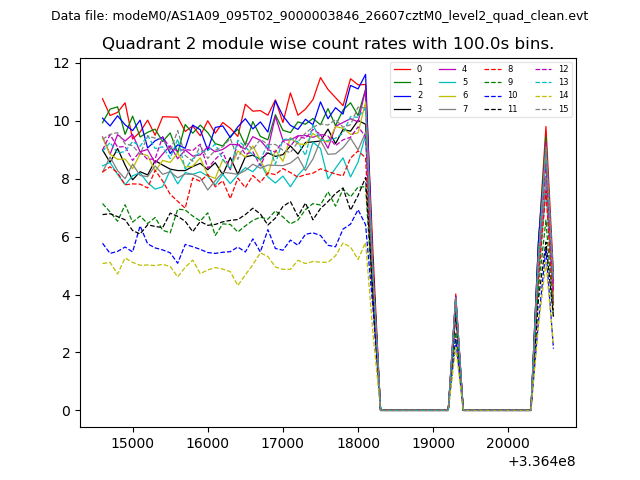
| Module-wise count rates for Quadrant B Data is divided into 100 sec bins |
 |
 |
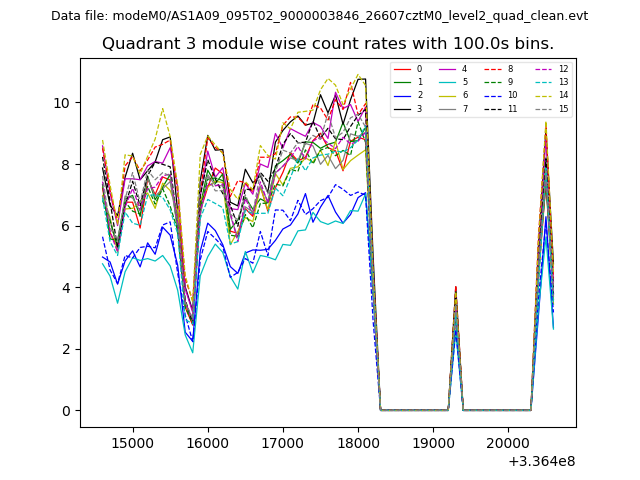
| Module-wise count rates for Quadrant C Data is divided into 100 sec bins |
 |
 |
| Module-wise count rates for Quadrant D Data is divided into 100 sec bins |
 |
 |
| Parameter | Plot |
|---|---|
| CZT HV Monitor | 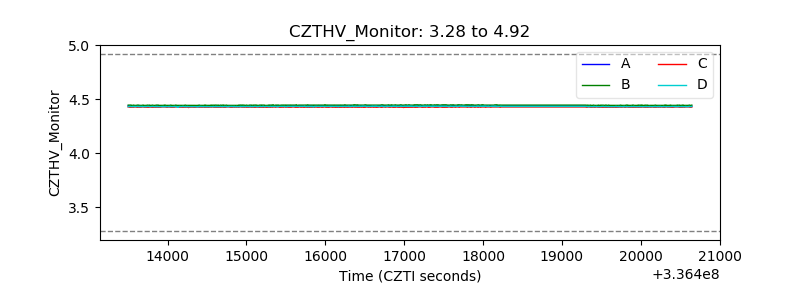 |
| D_VDD | 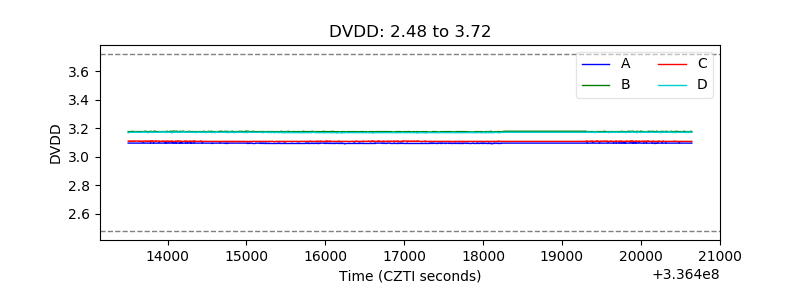 |
| Temperature 1 | 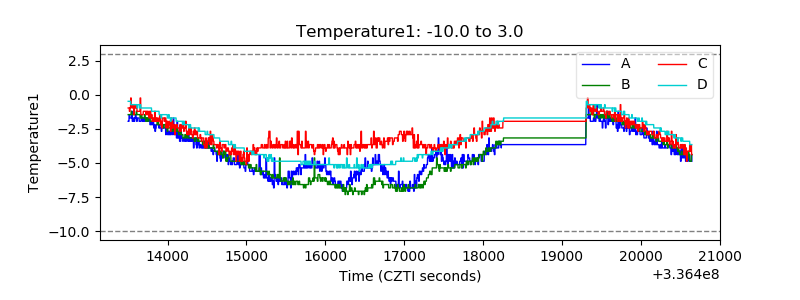 |
| Veto HV Monitor |  |
| Veto LLD | 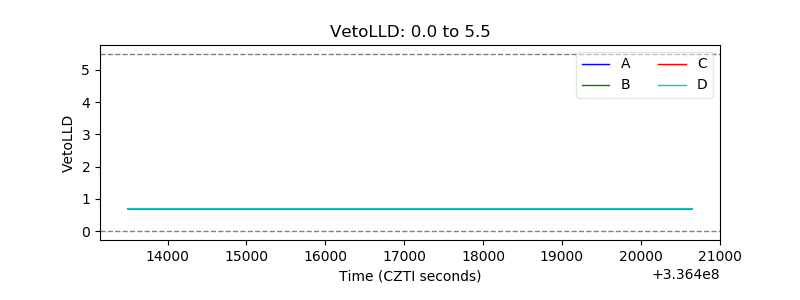 |
| Alpha Counter | 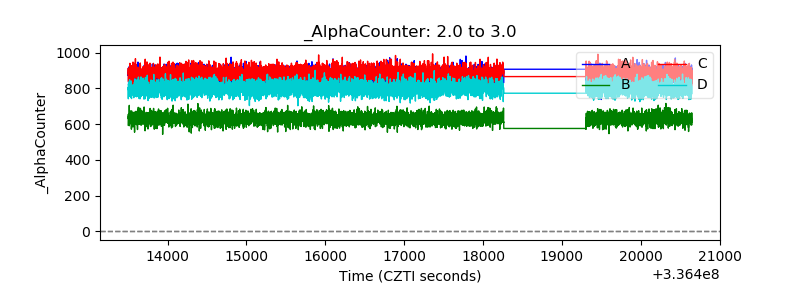 |
| _CPM_Rate | 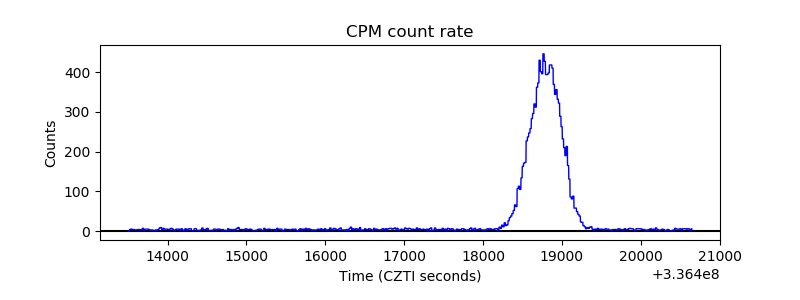 |
| CZT Counter | 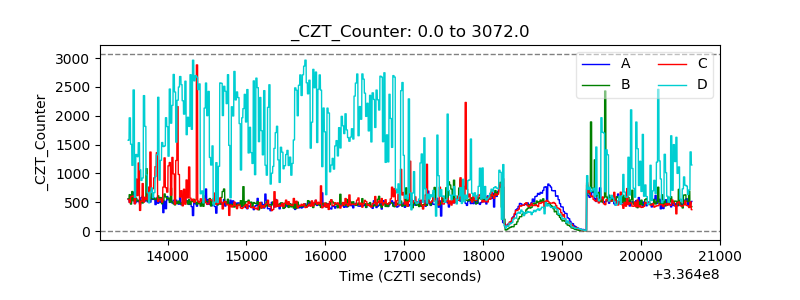 |
| +2.5 Volts monitor |  |
| +5 Volts monitor |  |
| _ROLL_ROT | 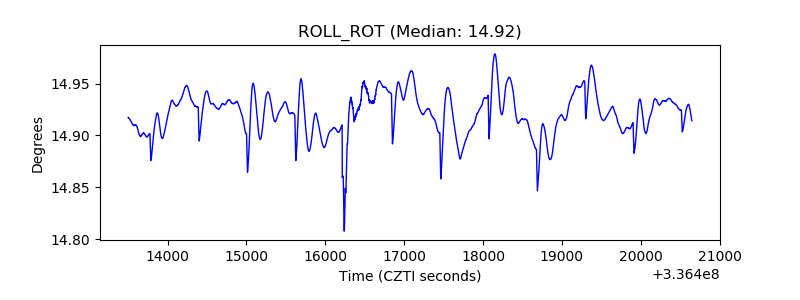 |
| _Roll_DEC | 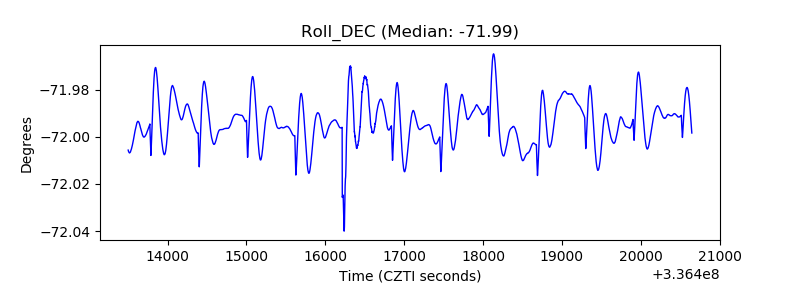 |
| _Roll_RA | 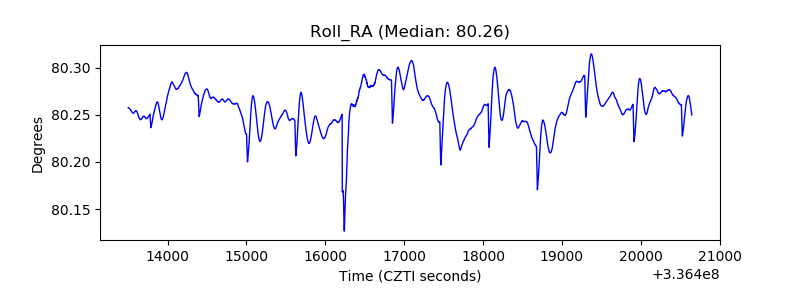 |
| Veto Counter | 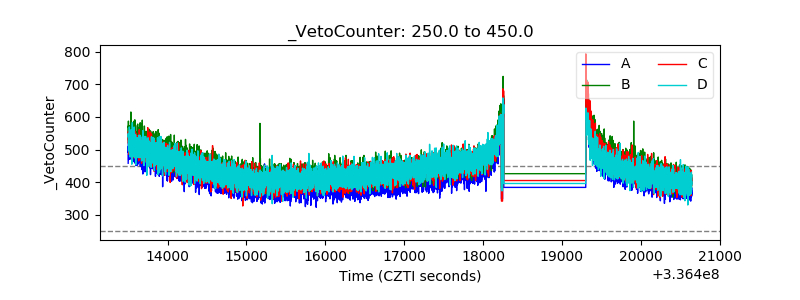 |