| Param | Original file | Final file |
|---|---|---|
| Filename | modeM0/AS1A09_095T02_9000003846_26609cztM0_level2.evt | modeM0/AS1A09_095T02_9000003846_26609cztM0_level2_quad_clean.evt |
| Size (bytes) | 545,160,960 | 98,959,680 |
| Size | 519.9 MB | 94.4 MB |
| Events in quadrant A | 3,272,041 | 651,456 |
| Events in quadrant B | 3,607,880 | 656,957 |
| Events in quadrant C | 3,423,883 | 628,043 |
| Events in quadrant D | 5,747,486 | 588,759 |
| Mode M9 | |||
|---|---|---|---|
| Quadrant | BADHDUFLAG | Total packets | Discarded packets |
| A | 0 | 9 | 0 |
| B | 0 | 10 | 0 |
| C | 0 | 10 | 0 |
| D | 0 | 10 | 0 |
| Mode M0 | |||
|---|---|---|---|
| Quadrant | BADHDUFLAG | Total packets | Discarded packets |
| A | 0 | 14047 | 0 |
| B | 0 | 14958 | 0 |
| C | 0 | 14418 | 0 |
| D | 0 | 21605 | 0 |
| Quadrant | Total seconds | Saturated seconds | Saturation percentage |
|---|---|---|---|
| A | 6770 | 39 | 0.576071% |
| B | 6770 | 99 | 1.462334% |
| C | 6770 | 85 | 1.255539% |
| D | 6770 | 744 | 10.989660% |
Noise dominated data is calculated using 1-second bins in cleaned event files. If a bin has >2000 counts, and if more than 50% of those come from <1% of pixels, then it is considered to be noise-dominated and hence unusable.
| Quadrant | # 1 sec bins | Bins with >0 counts | Bins with >2000 counts | High rate bins dominated by noise | Noise dominated (total time) | Noise dominated (detector-on time) | Marked lightcurve |
|---|---|---|---|---|---|---|---|
| A | 7440 | 6771 | 1 | 1 | 0.01% | 0.01% | 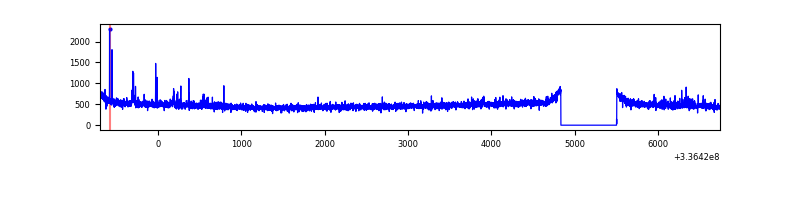 |
| B | 7440 | 6771 | 18 | 18 | 0.24% | 0.27% | 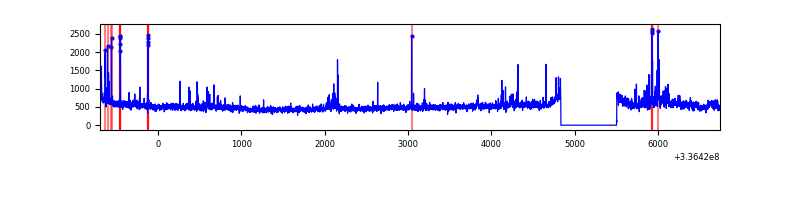 |
| C | 7440 | 6771 | 8 | 8 | 0.11% | 0.12% | 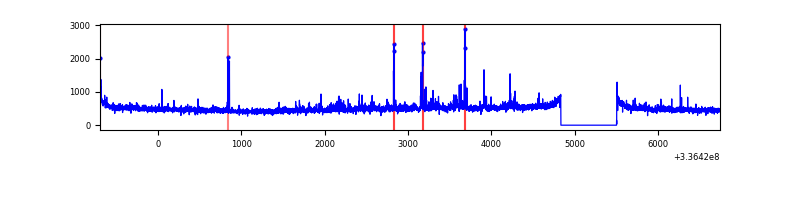 |
| D | 7440 | 6771 | 616 | 616 | 8.28% | 9.10% | 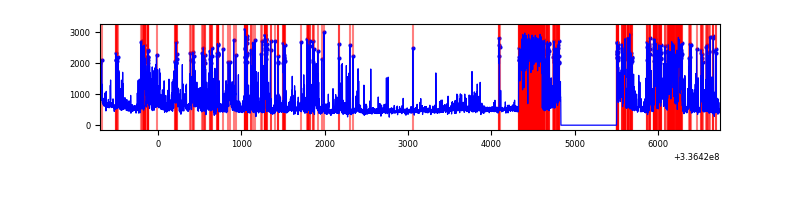 |
Top three noisy pixels from each quadrant. If the there are fewer than three noisy pixels in the level2.evt file, extra rows are filled as -1
| Pixel properties | Quadrant properties | ||||||
|---|---|---|---|---|---|---|---|
| Quadrant | DetID | PixID | Counts | Sigma | Mean | Median | Sigma |
| A | 0 | 13 | 54084 | 323.15 | 830 | 813 | 164.8 |
| A | 13 | 254 | 11881 | 67.14 | 830 | 813 | 164.8 |
| A | 5 | 168 | 11136 | 62.62 | 830 | 813 | 164.8 |
| B | 0 | 189 | 191515 | 1238.01 | 819 | 798 | 154.1 |
| B | 3 | 64 | 97335 | 626.65 | 819 | 798 | 154.1 |
| B | 5 | 172 | 54029 | 345.54 | 819 | 798 | 154.1 |
| C | 3 | 233 | 166102 | 907.56 | 789 | 792 | 182.1 |
| C | 14 | 238 | 127652 | 696.47 | 789 | 792 | 182.1 |
| C | 15 | 208 | 50420 | 272.46 | 789 | 792 | 182.1 |
| D | 1 | 52 | 1858577 | 10283.11 | 762 | 741 | 180.7 |
| D | 7 | 80 | 492806 | 2723.58 | 762 | 741 | 180.7 |
| D | 2 | 250 | 420035 | 2320.79 | 762 | 741 | 180.7 |
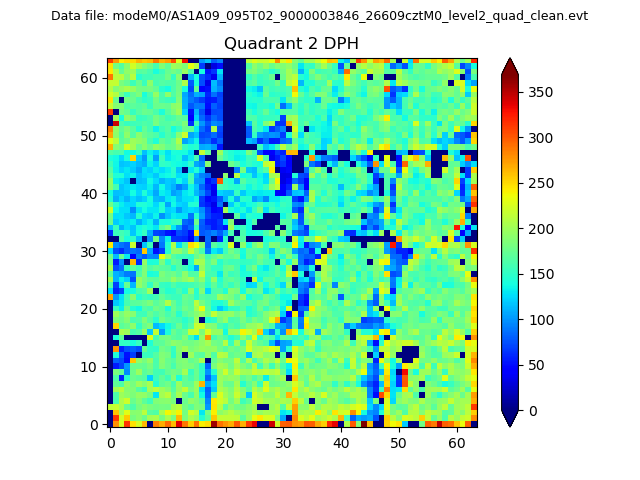
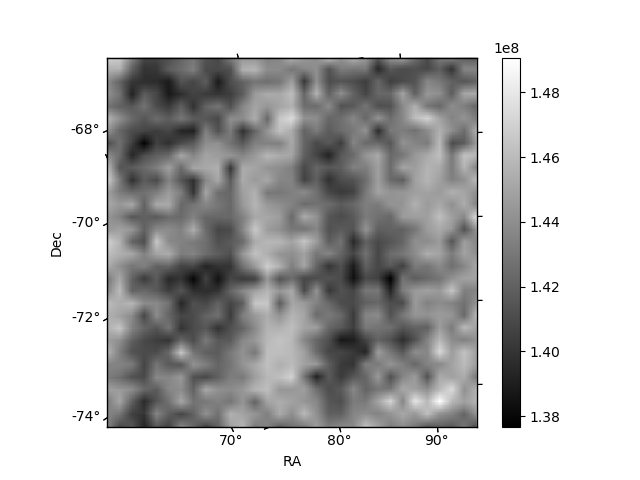
Histogram calculated using DETX and DETY for each event in the final _common_clean file
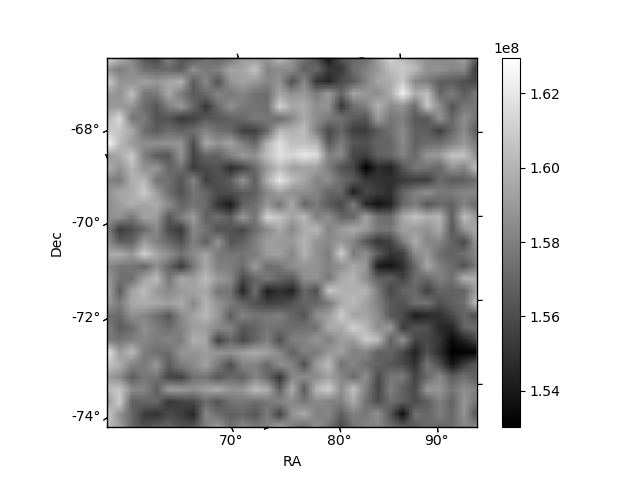
| Quadrant A | 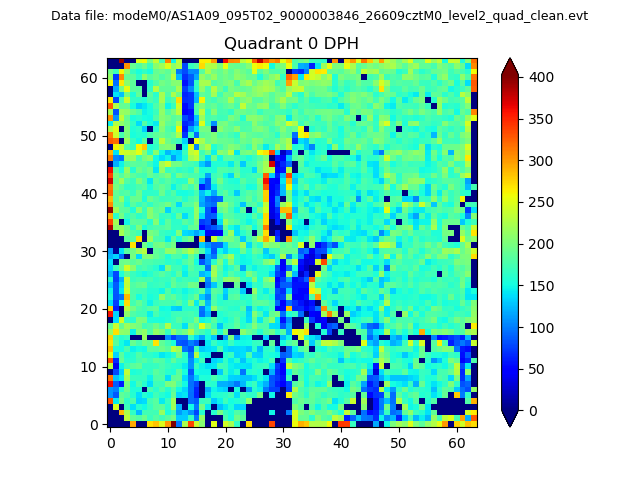 |
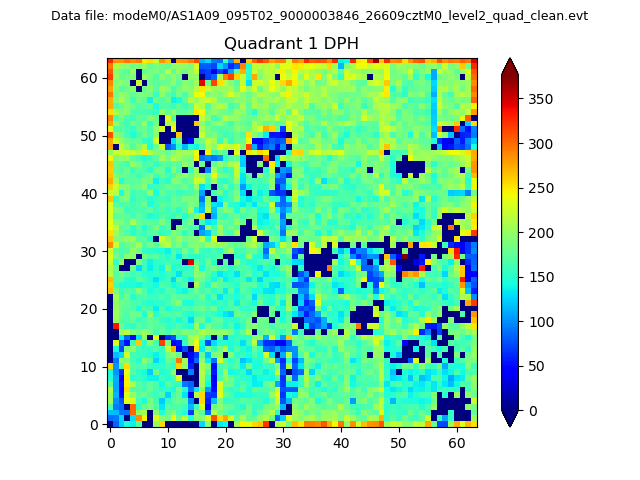 |
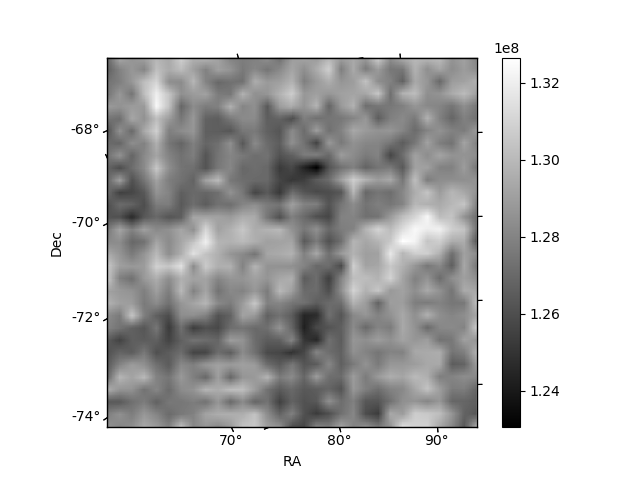
Quadrant B |
|---|---|---|---|
| Quadrant D | 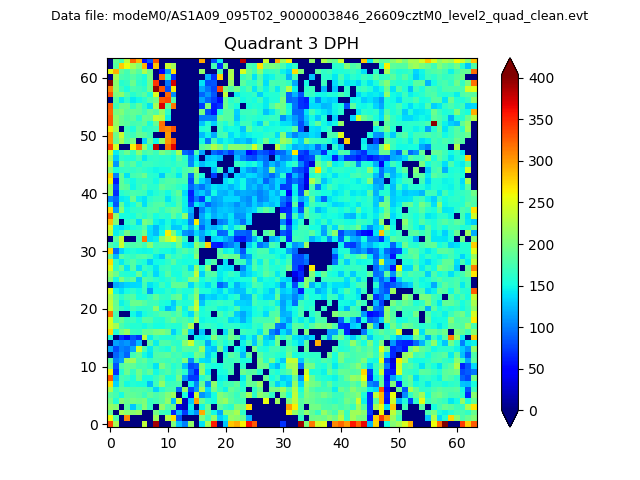 |
 |
Quadrant C |
| Plot type | Count rate plots | Images |
|---|---|---|
| Comparison with Poisson distribution Blue bars denote a histogram of data divided into 1 sec bins. Red curve is a Poisson curve with rate = median count rate of data. |
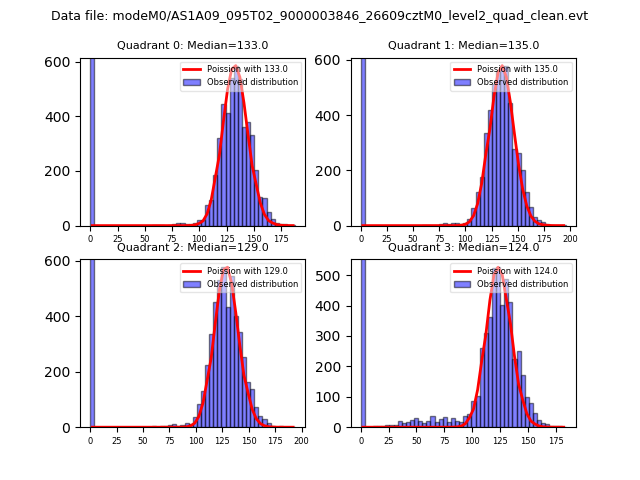 |
 |
| Quadrant-wise count rates Data is divided into 100 sec bins |
 |
|
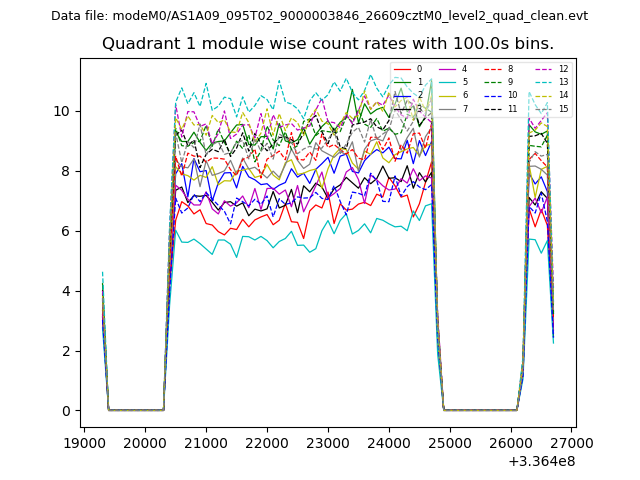
| Module-wise count rates for Quadrant A Data is divided into 100 sec bins |
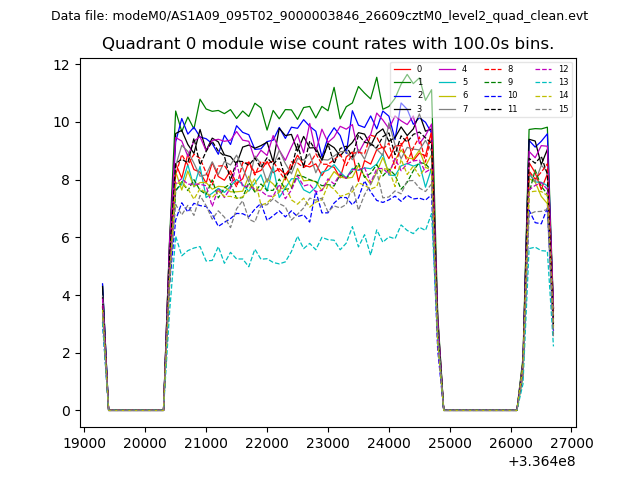 |
 |
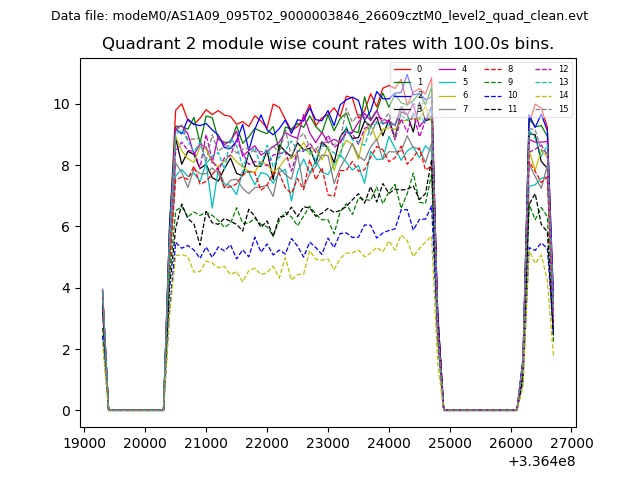
| Module-wise count rates for Quadrant B Data is divided into 100 sec bins |
 |
 |
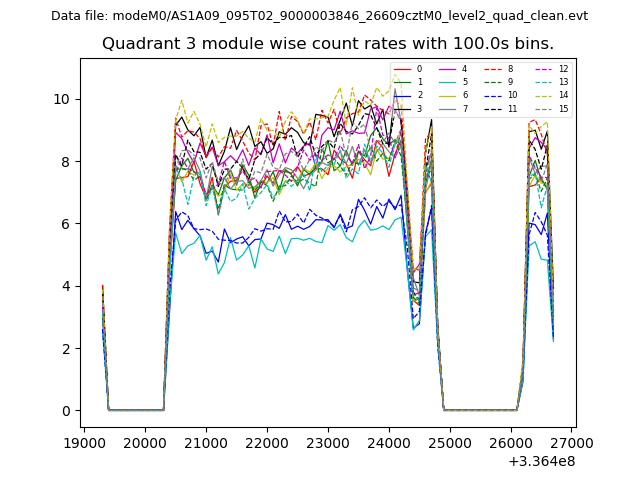
| Module-wise count rates for Quadrant C Data is divided into 100 sec bins |
 |
 |
| Module-wise count rates for Quadrant D Data is divided into 100 sec bins |
 |
 |
| Parameter | Plot |
|---|---|
| CZT HV Monitor |  |
| D_VDD | 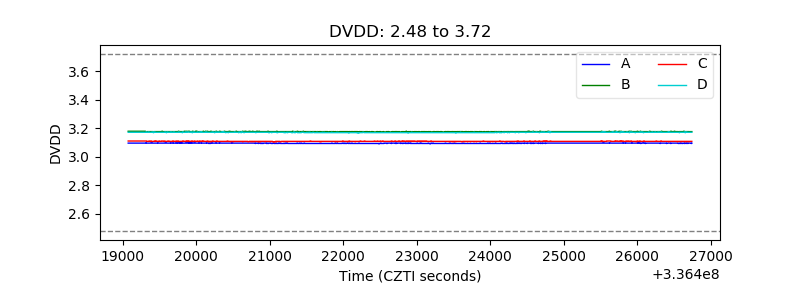 |
| Temperature 1 | 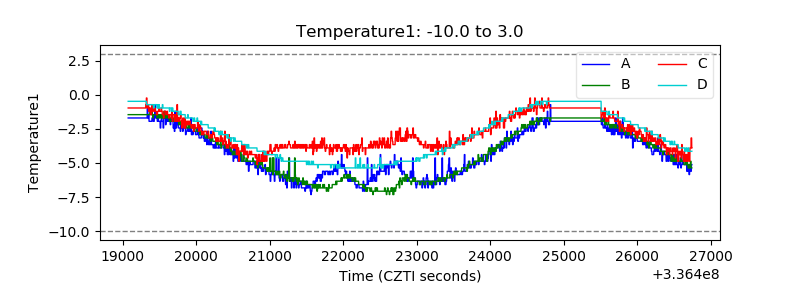 |
| Veto HV Monitor | 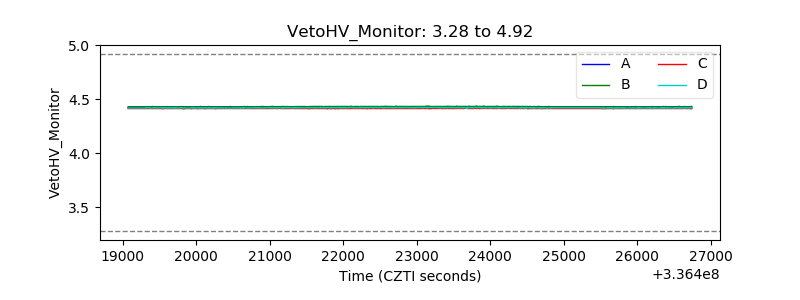 |
| Veto LLD | 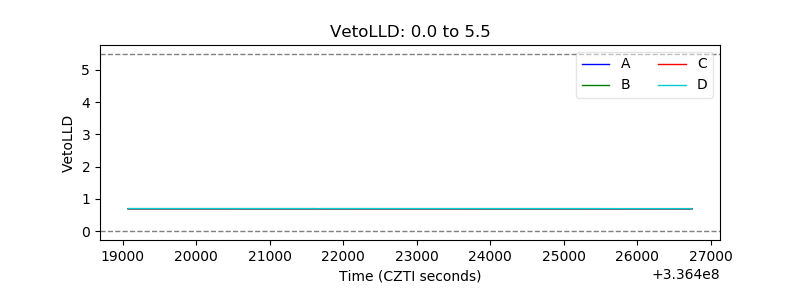 |
| Alpha Counter |  |
| _CPM_Rate | 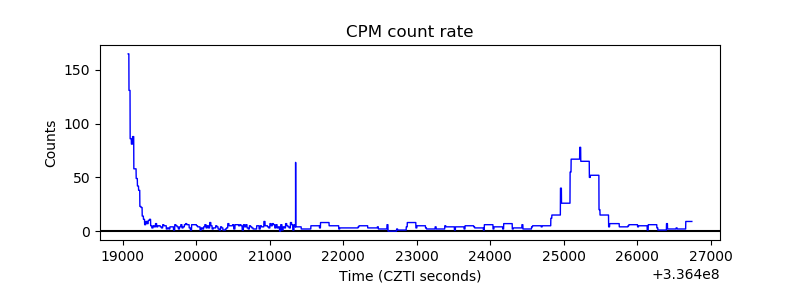 |
| CZT Counter | 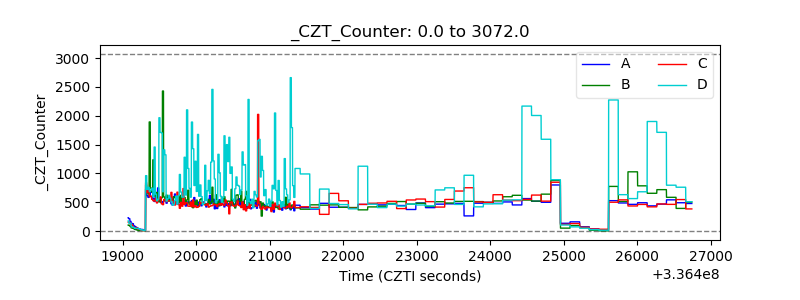 |
| +2.5 Volts monitor |  |
| +5 Volts monitor |  |
| _ROLL_ROT | 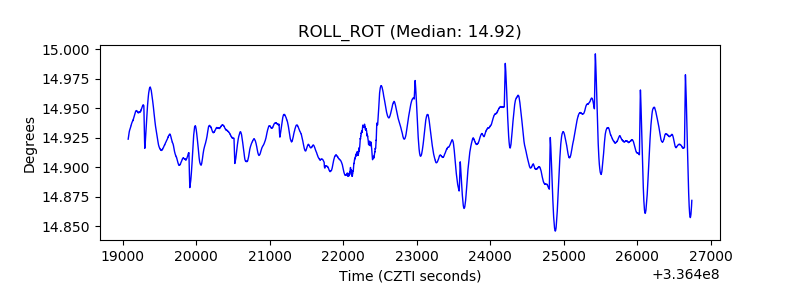 |
| _Roll_DEC | 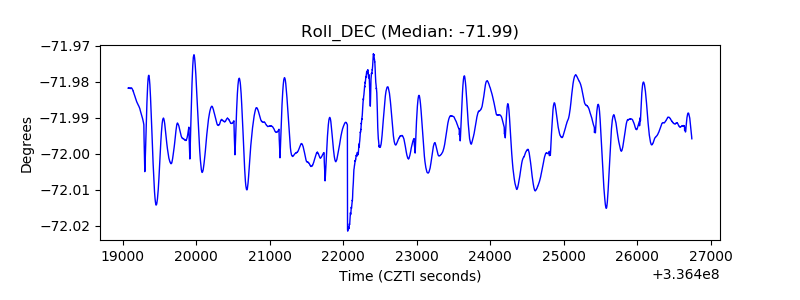 |
| _Roll_RA | 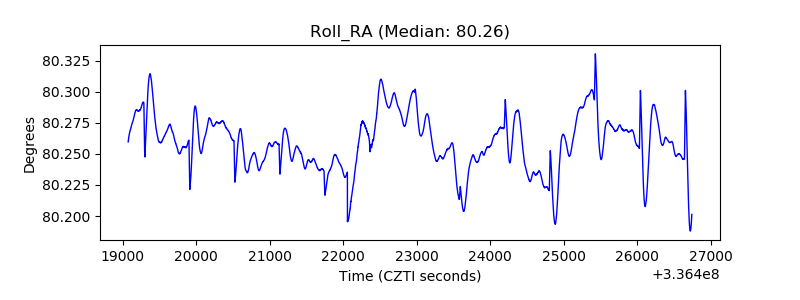 |
| Veto Counter | 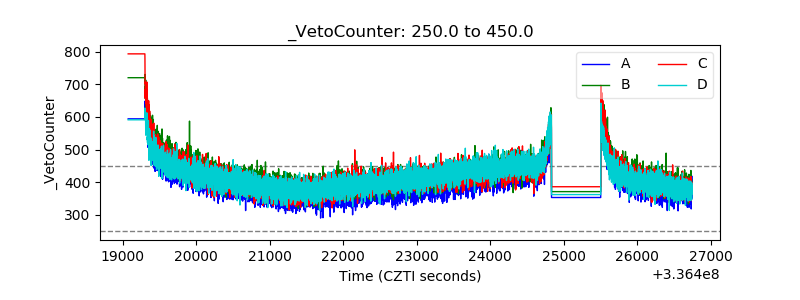 |