| Param | Original file | Final file |
|---|---|---|
| Filename | modeM0/AS1A09_145T01_9000003848cztM0_level2.fits | modeM0/AS1A09_145T01_9000003848cztM0_level2_quad_clean.evt |
| Size (bytes) | 5,220,218,880 | 4,243,296,960 |
| Size | 4.9 GB | 4.0 GB |
| Events in quadrant A | 29,890,820 | 25,158,802 |
| Events in quadrant B | 27,923,667 | 24,410,629 |
| Events in quadrant C | 28,682,029 | 23,788,483 |
| Events in quadrant D | 39,452,418 | 23,030,445 |
| Mode M0 | |||
|---|---|---|---|
| Quadrant | BADHDUFLAG | Total packets | Discarded packets |
| A | 0 | 1033010 | 0 |
| B | 0 | 1152357 | 0 |
| C | 0 | 1040929 | 0 |
| D | 0 | 1600093 | 0 |
| Mode M9 | |||
|---|---|---|---|
| Quadrant | BADHDUFLAG | Total packets | Discarded packets |
| A | 0 | 754 | 0 |
| B | 0 | 754 | 0 |
| C | 0 | 751 | 0 |
| D | 0 | 751 | 0 |
| Mode SS | |||
|---|---|---|---|
| Quadrant | BADHDUFLAG | Total packets | Discarded packets |
| A | 0 | 9566 | 0 |
| B | 0 | 9571 | 0 |
| C | 0 | 9640 | 0 |
| D | 0 | 9589 | 0 |
| Quadrant | Total seconds | Saturated seconds | Saturation percentage |
|---|---|---|---|
| A | 469307 | 6287 | 1.339635% |
| B | 468925 | 17806 | 3.797196% |
| C | 469202 | 10082 | 2.148755% |
| D | 468326 | 62027 | 13.244407% |
Noise dominated data is calculated using 1-second bins in cleaned event files. If a bin has >2000 counts, and if more than 50% of those come from <1% of pixels, then it is considered to be noise-dominated and hence unusable.
| Quadrant | # 1 sec bins | Bins with >0 counts | Bins with >2000 counts | High rate bins dominated by noise | Noise dominated (total time) | Noise dominated (detector-on time) | Marked lightcurve |
|---|---|---|---|---|---|---|---|
| A | 620159 | 471764 | 0 | 0 | 0.00% | 0.00% |  |
| B | 620159 | 470537 | 0 | 0 | 0.00% | 0.00% |  |
| C | 620159 | 471566 | 0 | 0 | 0.00% | 0.00% |  |
| D | 620159 | 467902 | 0 | 0 | 0.00% | 0.00% |  |
Top three noisy pixels from each quadrant. If the there are fewer than three noisy pixels in the level2.evt file, extra rows are filled as -1
| Pixel properties | Quadrant properties | ||||||
|---|---|---|---|---|---|---|---|
| Quadrant | DetID | PixID | Counts | Sigma | Mean | Median | Sigma |
| A | 0 | 29 | 25267 | 9.56 | 7794 | 7346 | 1874.5 |
| A | 7 | 110 | 24216 | 9.0 | 7794 | 7346 | 1874.5 |
| A | 9 | 19 | 22990 | 8.35 | 7794 | 7346 | 1874.5 |
| B | 2 | 9 | 22473 | 10.82 | 7383 | 7060 | 1423.9 |
| B | 2 | 8 | 18599 | 8.1 | 7383 | 7060 | 1423.9 |
| B | 5 | 128 | 18565 | 8.08 | 7383 | 7060 | 1423.9 |
| C | 12 | 241 | 19666 | 6.62 | 7586 | 7124 | 1895.5 |
| C | 3 | 126 | 19298 | 6.42 | 7586 | 7124 | 1895.5 |
| C | 2 | 191 | 19124 | 6.33 | 7586 | 7124 | 1895.5 |
Histogram calculated using DETX and DETY for each event in the final _common_clean file
| Quadrant A |  |
 |
Quadrant B |
|---|---|---|---|
| Quadrant D |  |
 |
Quadrant C |
| Plot type | Count rate plots | Images |
|---|---|---|
| Comparison with Poisson distribution Blue bars denote a histogram of data divided into 1 sec bins. Red curve is a Poisson curve with rate = median count rate of data. |
 |
 |
| Quadrant-wise count rates Data is divided into 100 sec bins |
 |
|
| Module-wise count rates for Quadrant A Data is divided into 100 sec bins |
 |
 |
| Module-wise count rates for Quadrant B Data is divided into 100 sec bins |
 |
 |
| Module-wise count rates for Quadrant C Data is divided into 100 sec bins |
 |
 |
| Module-wise count rates for Quadrant D Data is divided into 100 sec bins |
 |
 |
| Parameter | Plot |
|---|---|
| CZT HV Monitor |  |
| D_VDD | 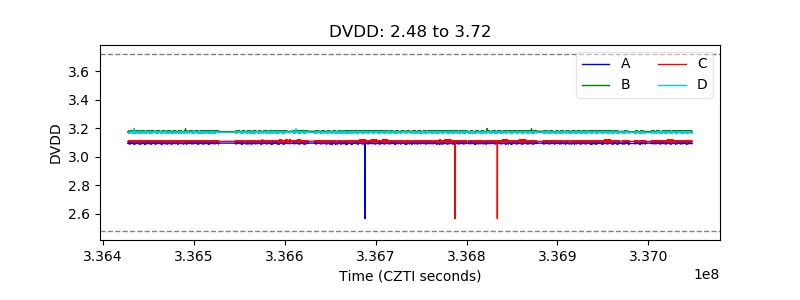 |
| Temperature 1 |  |
| Veto HV Monitor |  |
| Veto LLD |  |
| Alpha Counter |  |
| _CPM_Rate |  |
| CZT Counter |  |
| +2.5 Volts monitor |  |
| +5 Volts monitor |  |
| _ROLL_ROT |  |
| _Roll_DEC |  |
| _Roll_RA |  |
| Veto Counter |  |