| Param | Original file | Final file |
|---|---|---|
| Filename | modeM0/AS1A09_145T01_9000003848_26609cztM0_level2.evt | modeM0/AS1A09_145T01_9000003848_26609cztM0_level2_quad_clean.evt |
| Size (bytes) | 443,810,880 | 73,272,960 |
| Size | 423.3 MB | 69.9 MB |
| Events in quadrant A | 2,587,029 | 480,050 |
| Events in quadrant B | 3,008,511 | 481,180 |
| Events in quadrant C | 2,822,942 | 460,840 |
| Events in quadrant D | 4,671,714 | 435,058 |
| Mode M0 | |||
|---|---|---|---|
| Quadrant | BADHDUFLAG | Total packets | Discarded packets |
| A | 0 | 10855 | 0 |
| B | 0 | 12144 | 0 |
| C | 0 | 11587 | 0 |
| D | 0 | 17449 | 0 |
| Mode M9 | |||
|---|---|---|---|
| Quadrant | BADHDUFLAG | Total packets | Discarded packets |
| A | 0 | 3 | 0 |
| B | 0 | 3 | 0 |
| C | 0 | 3 | 0 |
| D | 0 | 3 | 0 |
| Quadrant | Total seconds | Saturated seconds | Saturation percentage |
|---|---|---|---|
| A | 5156 | 62 | 1.202483% |
| B | 5156 | 187 | 3.626843% |
| C | 5156 | 146 | 2.831652% |
| D | 5155 | 623 | 12.085354% |
Noise dominated data is calculated using 1-second bins in cleaned event files. If a bin has >2000 counts, and if more than 50% of those come from <1% of pixels, then it is considered to be noise-dominated and hence unusable.
| Quadrant | # 1 sec bins | Bins with >0 counts | Bins with >2000 counts | High rate bins dominated by noise | Noise dominated (total time) | Noise dominated (detector-on time) | Marked lightcurve |
|---|---|---|---|---|---|---|---|
| A | 5461 | 5157 | 0 | 0 | 0.00% | 0.00% | 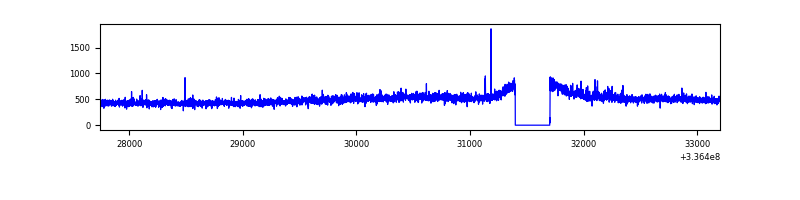 |
| B | 5461 | 5157 | 12 | 12 | 0.22% | 0.23% | 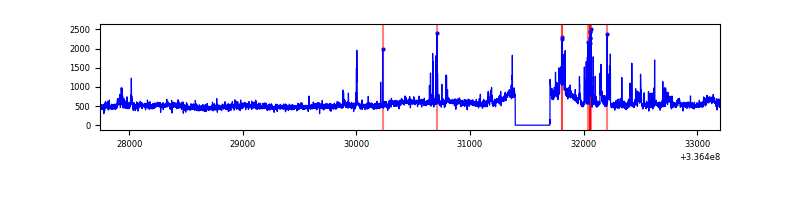 |
| C | 5461 | 5157 | 7 | 7 | 0.13% | 0.14% | 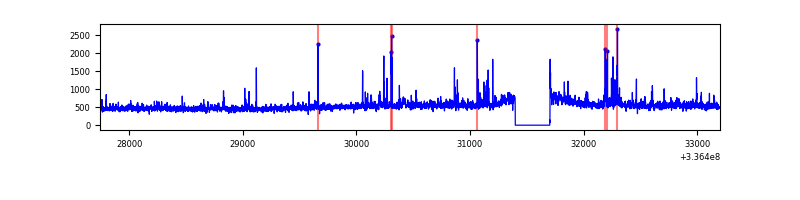 |
| D | 5460 | 5156 | 484 | 484 | 8.86% | 9.39% | 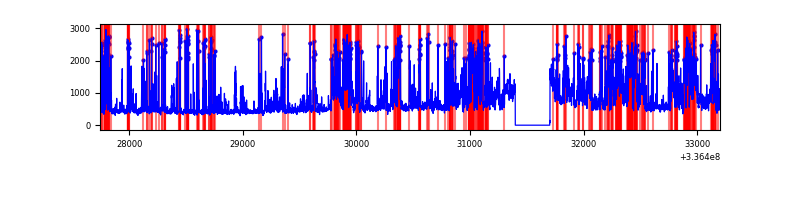 |
Top three noisy pixels from each quadrant. If the there are fewer than three noisy pixels in the level2.evt file, extra rows are filled as -1
| Pixel properties | Quadrant properties | ||||||
|---|---|---|---|---|---|---|---|
| Quadrant | DetID | PixID | Counts | Sigma | Mean | Median | Sigma |
| A | 0 | 13 | 24874 | 179.54 | 663 | 649 | 134.9 |
| A | 13 | 254 | 8791 | 60.34 | 663 | 649 | 134.9 |
| A | 3 | 137 | 5985 | 39.55 | 663 | 649 | 134.9 |
| B | 0 | 189 | 247254 | 1973.01 | 652 | 637 | 125.0 |
| B | 3 | 64 | 125532 | 999.2 | 652 | 637 | 125.0 |
| B | 5 | 172 | 32788 | 257.22 | 652 | 637 | 125.0 |
| C | 3 | 233 | 173073 | 1158.77 | 630 | 636 | 148.8 |
| C | 14 | 238 | 101488 | 677.72 | 630 | 636 | 148.8 |
| C | 15 | 208 | 85344 | 569.24 | 630 | 636 | 148.8 |
| D | 1 | 52 | 1636250 | 10801.08 | 617 | 601 | 151.4 |
| D | 7 | 80 | 530269 | 3497.68 | 617 | 601 | 151.4 |
| D | 2 | 250 | 131362 | 863.49 | 617 | 601 | 151.4 |
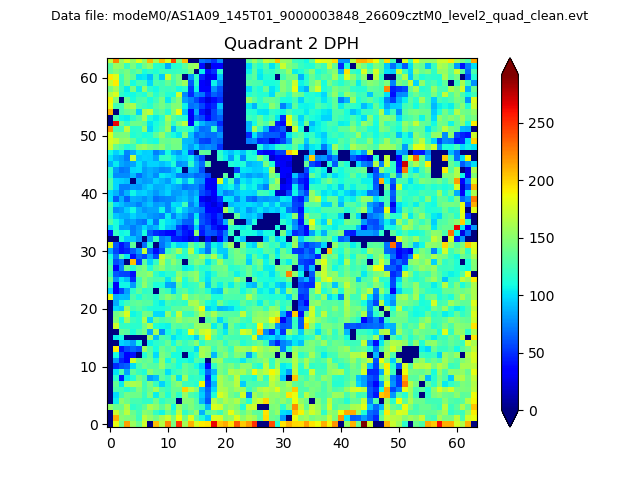
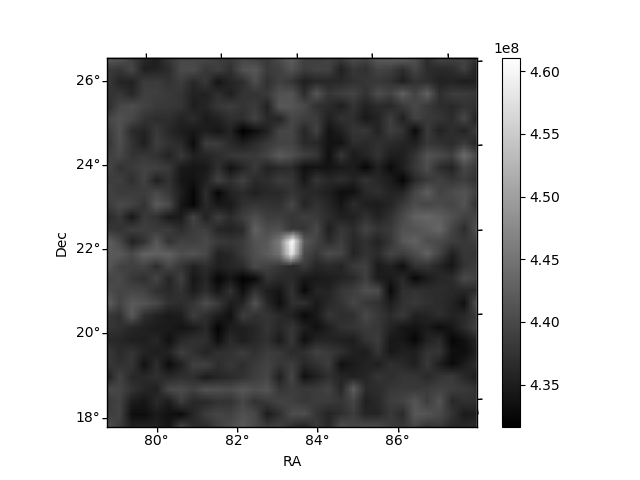
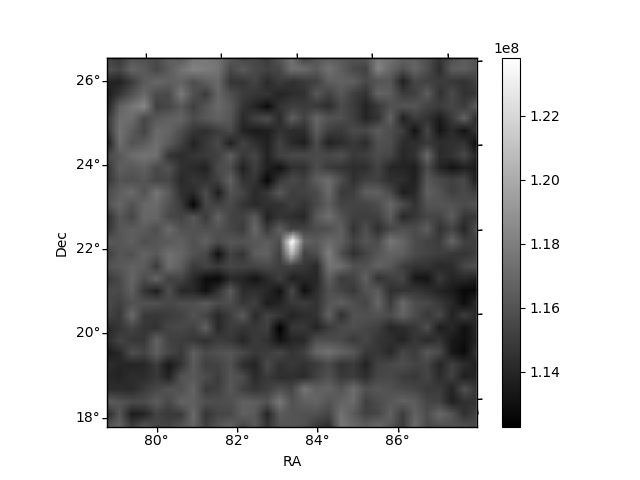
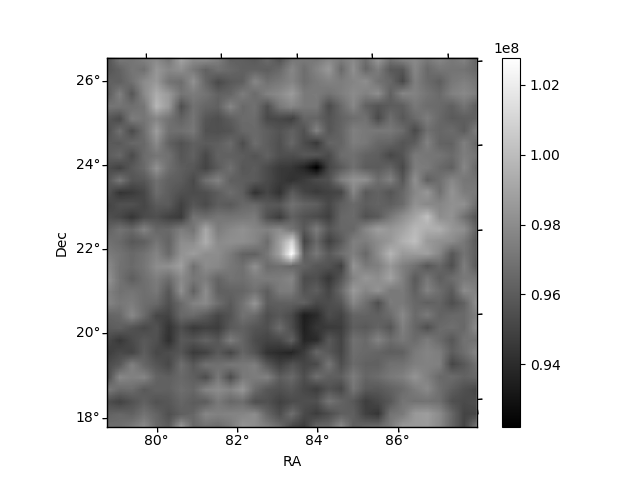
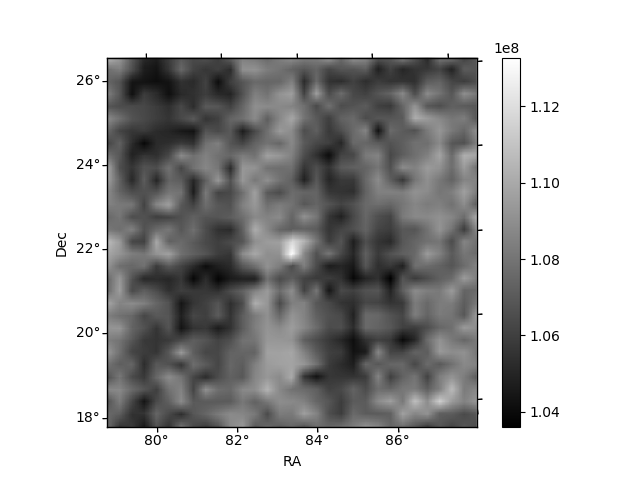
Histogram calculated using DETX and DETY for each event in the final _common_clean file
| Quadrant A | 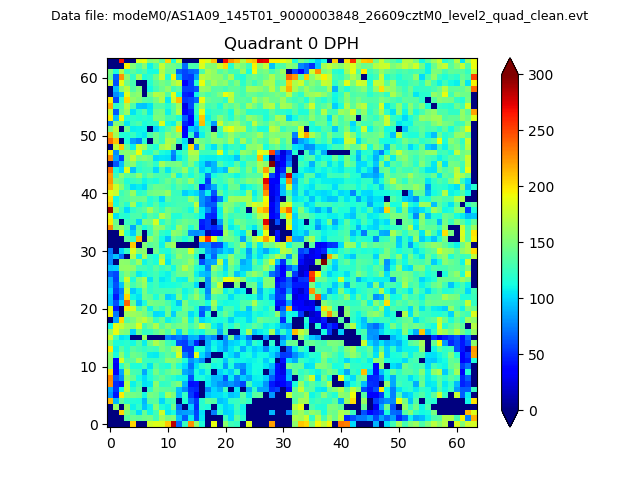 |
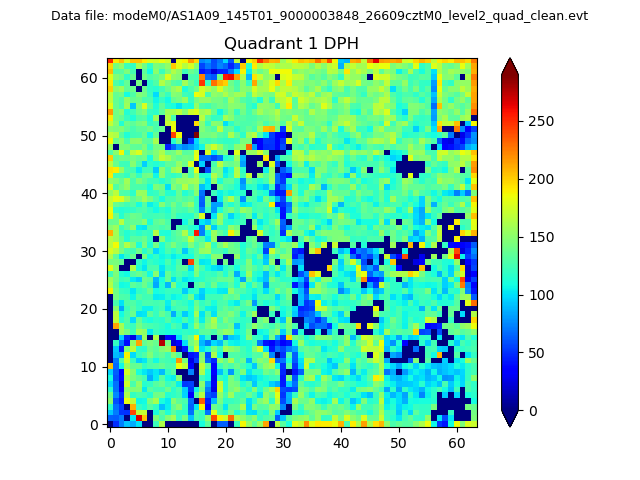 |
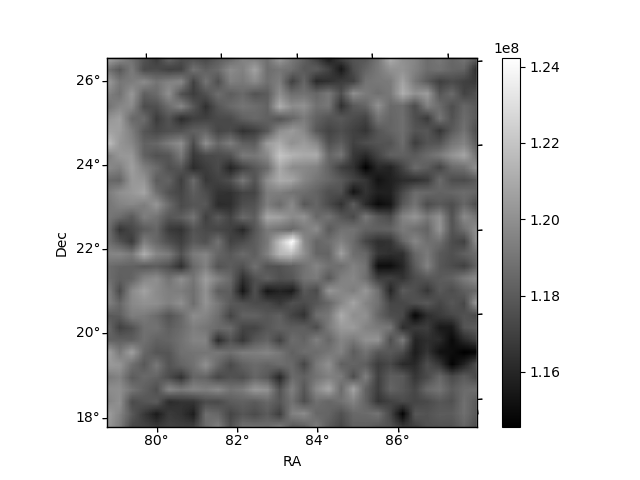
Quadrant B |
|---|---|---|---|
| Quadrant D | 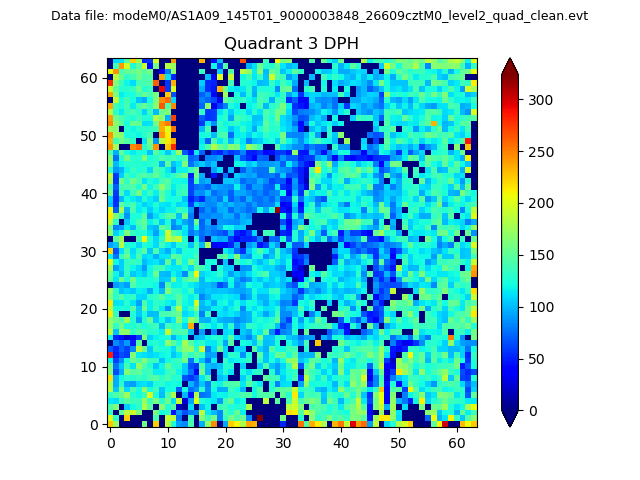 |
 |
Quadrant C |
| Plot type | Count rate plots | Images |
|---|---|---|
| Comparison with Poisson distribution Blue bars denote a histogram of data divided into 1 sec bins. Red curve is a Poisson curve with rate = median count rate of data. |
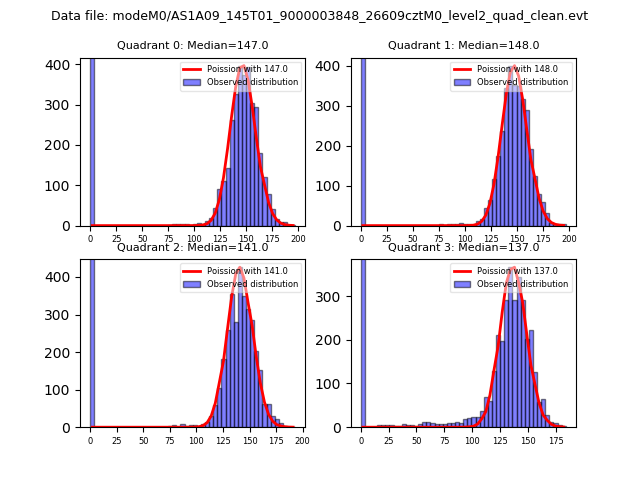 |
 |
| Quadrant-wise count rates Data is divided into 100 sec bins |
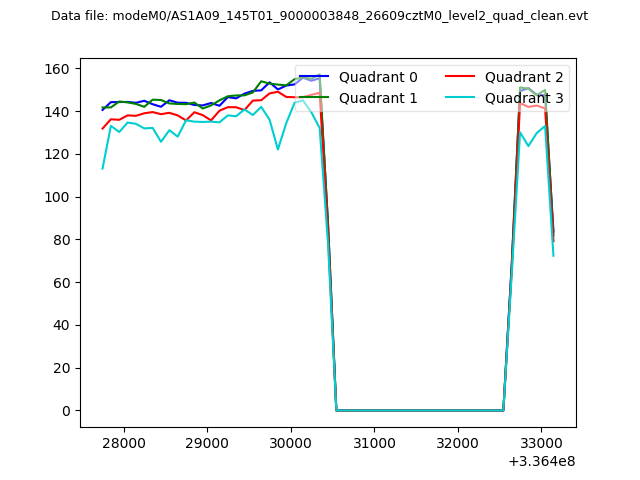 |
|
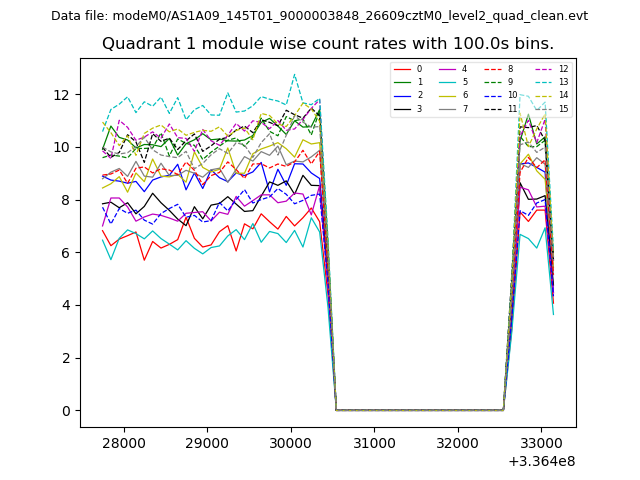
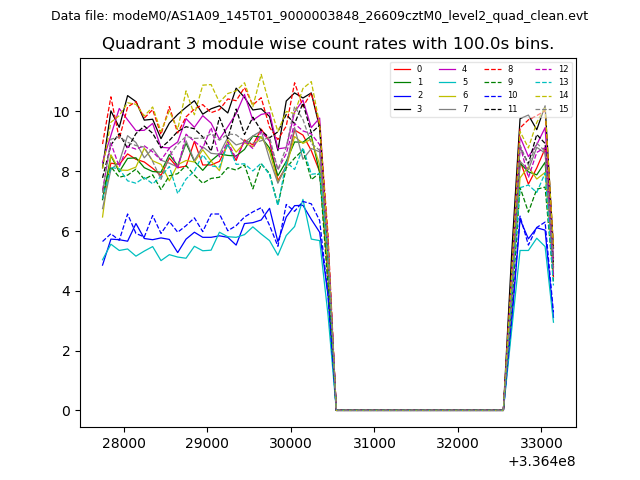
| Module-wise count rates for Quadrant A Data is divided into 100 sec bins |
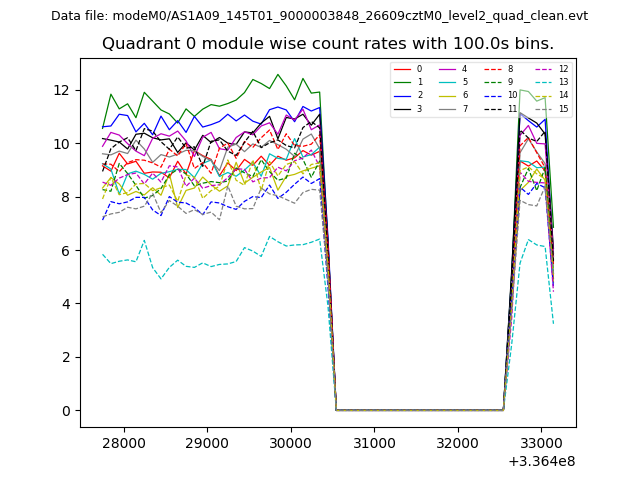 |
 |
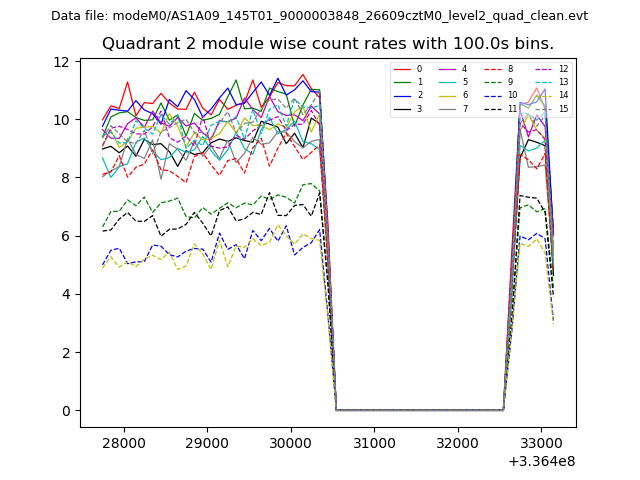
| Module-wise count rates for Quadrant B Data is divided into 100 sec bins |
 |
 |
| Module-wise count rates for Quadrant C Data is divided into 100 sec bins |
 |
 |
| Module-wise count rates for Quadrant D Data is divided into 100 sec bins |
 |
 |
| Parameter | Plot |
|---|---|
| CZT HV Monitor | 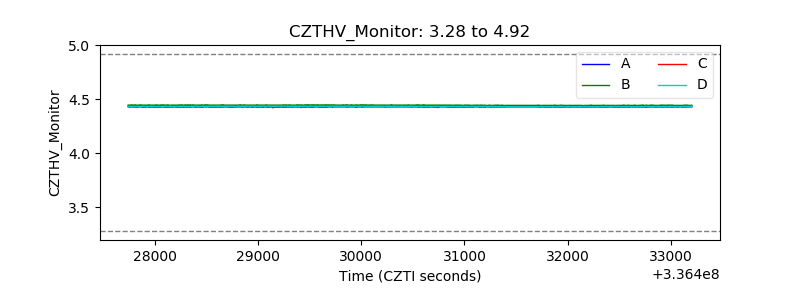 |
| D_VDD | 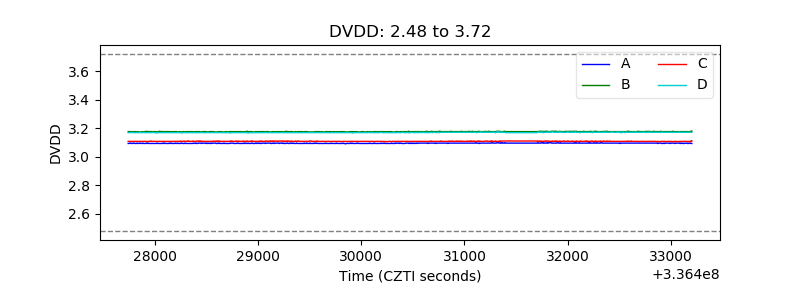 |
| Temperature 1 | 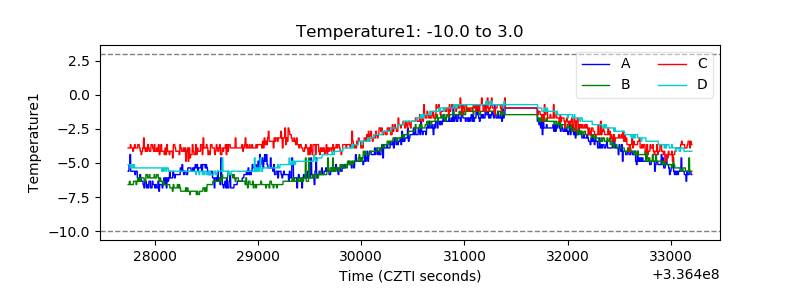 |
| Veto HV Monitor | 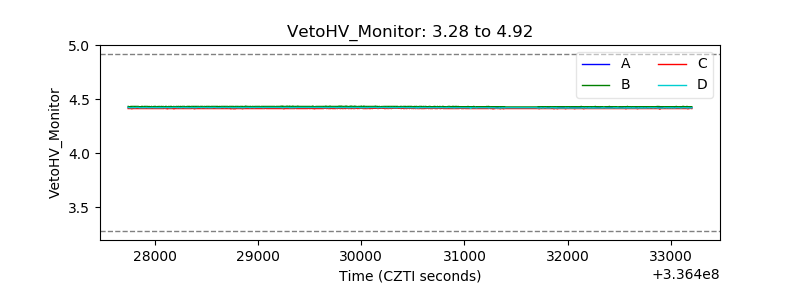 |
| Veto LLD | 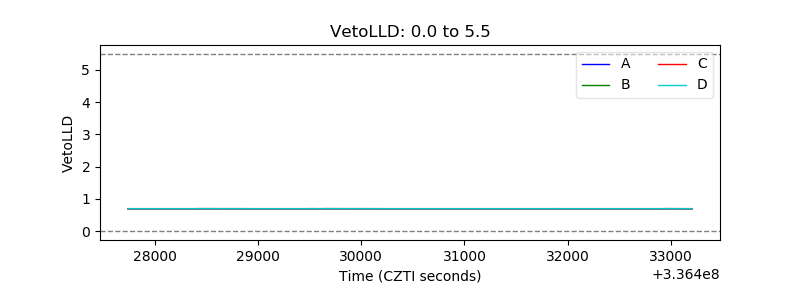 |
| Alpha Counter | 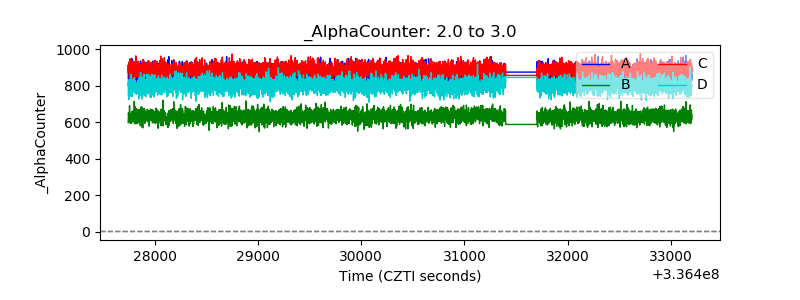 |
| _CPM_Rate | 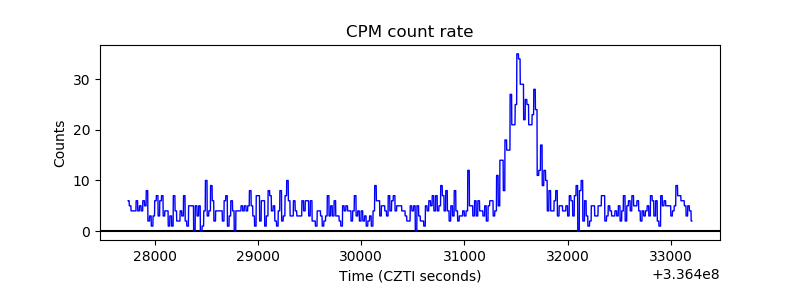 |
| CZT Counter | 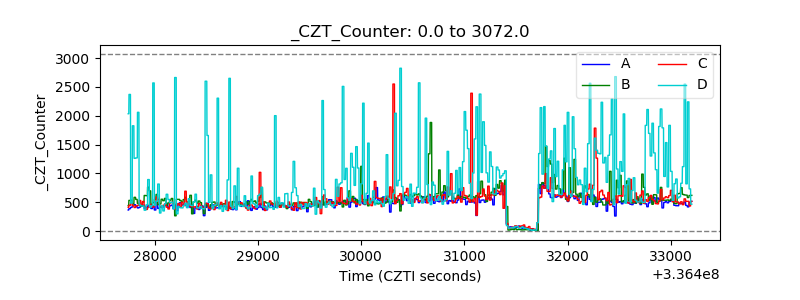 |
| +2.5 Volts monitor |  |
| +5 Volts monitor |  |
| _ROLL_ROT | 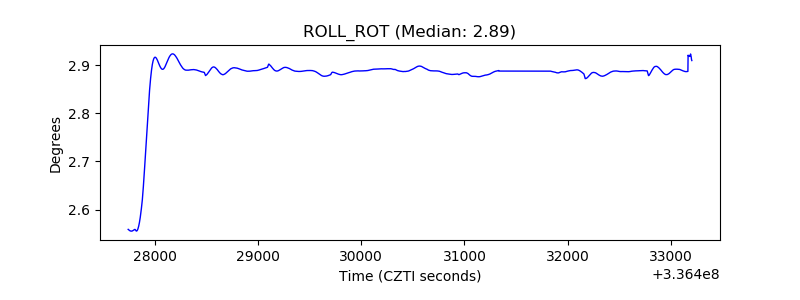 |
| _Roll_DEC | 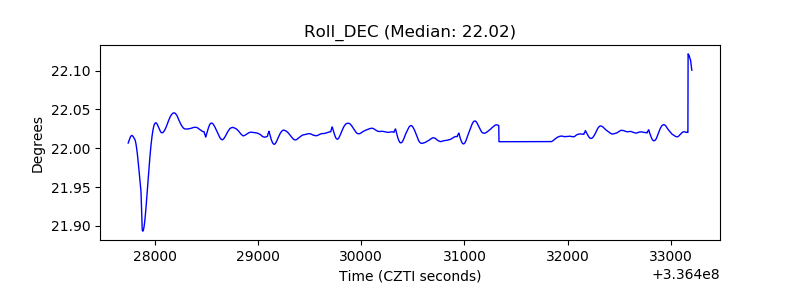 |
| _Roll_RA | 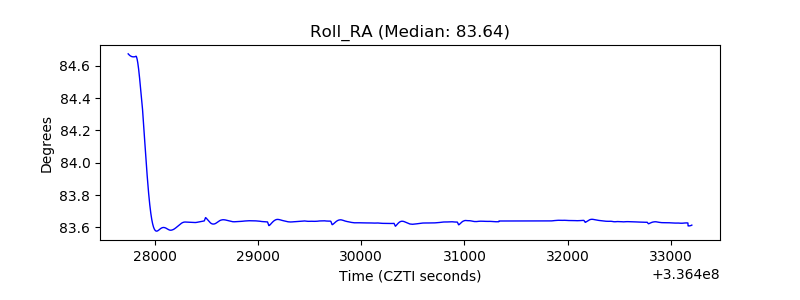 |
| Veto Counter | 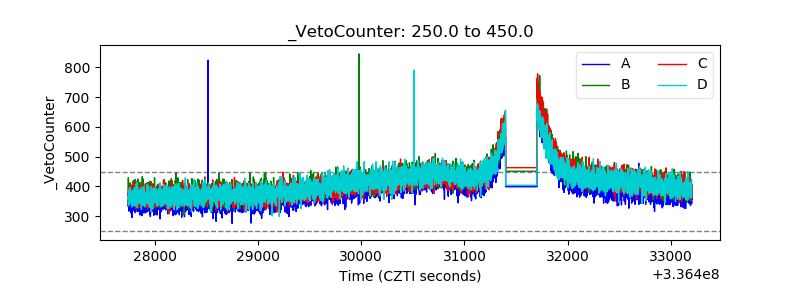 |