| Param | Original file | Final file |
|---|---|---|
| Filename | modeM0/AS1A09_145T01_9000003848_26610cztM0_level2.evt | modeM0/AS1A09_145T01_9000003848_26610cztM0_level2_quad_clean.evt |
| Size (bytes) | 656,277,120 | 105,194,880 |
| Size | 625.9 MB | 100.3 MB |
| Events in quadrant A | 3,839,776 | 685,729 |
| Events in quadrant B | 4,533,131 | 687,450 |
| Events in quadrant C | 4,275,828 | 658,024 |
| Events in quadrant D | 6,714,055 | 627,564 |
| Mode M0 | |||
|---|---|---|---|
| Quadrant | BADHDUFLAG | Total packets | Discarded packets |
| A | 0 | 16057 | 0 |
| B | 0 | 18406 | 0 |
| C | 0 | 17286 | 0 |
| D | 0 | 25149 | 0 |
| Mode M9 | |||
|---|---|---|---|
| Quadrant | BADHDUFLAG | Total packets | Discarded packets |
| A | 0 | 4 | 0 |
| B | 0 | 5 | 0 |
| C | 0 | 5 | 0 |
| D | 0 | 5 | 0 |
| Quadrant | Total seconds | Saturated seconds | Saturation percentage |
|---|---|---|---|
| A | 7574 | 86 | 1.135463% |
| B | 7574 | 180 | 2.376551% |
| C | 7574 | 235 | 3.102720% |
| D | 7574 | 692 | 9.136520% |
Noise dominated data is calculated using 1-second bins in cleaned event files. If a bin has >2000 counts, and if more than 50% of those come from <1% of pixels, then it is considered to be noise-dominated and hence unusable.
| Quadrant | # 1 sec bins | Bins with >0 counts | Bins with >2000 counts | High rate bins dominated by noise | Noise dominated (total time) | Noise dominated (detector-on time) | Marked lightcurve |
|---|---|---|---|---|---|---|---|
| A | 7929 | 7575 | 6 | 6 | 0.08% | 0.08% | 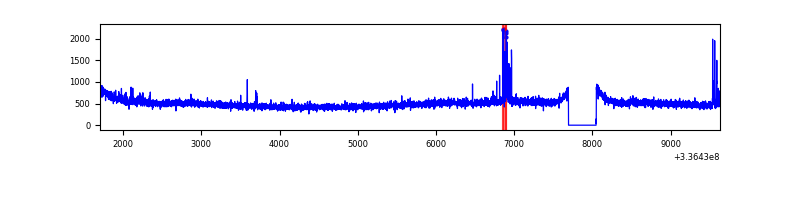 |
| B | 7929 | 7575 | 10 | 10 | 0.13% | 0.13% | 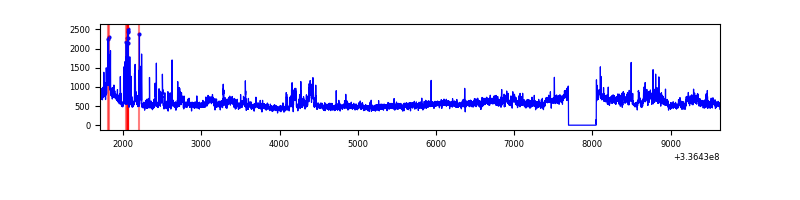 |
| C | 7929 | 7575 | 31 | 31 | 0.39% | 0.41% | 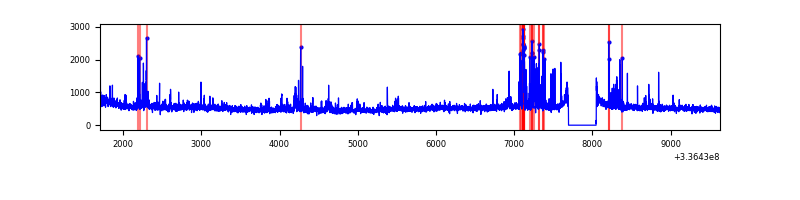 |
| D | 7929 | 7575 | 521 | 521 | 6.57% | 6.88% | 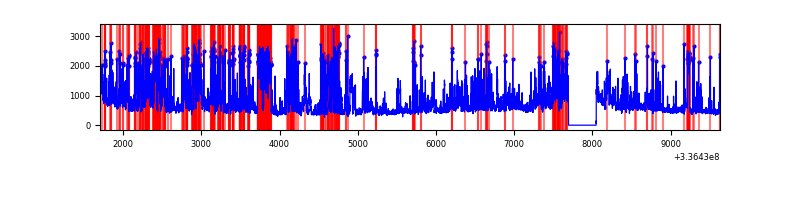 |
Top three noisy pixels from each quadrant. If the there are fewer than three noisy pixels in the level2.evt file, extra rows are filled as -1
| Pixel properties | Quadrant properties | ||||||
|---|---|---|---|---|---|---|---|
| Quadrant | DetID | PixID | Counts | Sigma | Mean | Median | Sigma |
| A | 0 | 13 | 95226 | 483.08 | 970 | 952 | 195.2 |
| A | 13 | 254 | 13257 | 63.05 | 970 | 952 | 195.2 |
| A | 3 | 137 | 8653 | 39.46 | 970 | 952 | 195.2 |
| B | 0 | 189 | 569552 | 3089.26 | 962 | 938 | 184.1 |
| B | 3 | 64 | 106443 | 573.21 | 962 | 938 | 184.1 |
| B | 5 | 172 | 36079 | 190.92 | 962 | 938 | 184.1 |
| C | 15 | 208 | 275260 | 1262.12 | 923 | 930 | 217.4 |
| C | 3 | 233 | 251336 | 1152.05 | 923 | 930 | 217.4 |
| C | 14 | 238 | 148036 | 676.8 | 923 | 930 | 217.4 |
| D | 1 | 52 | 2401537 | 10760.24 | 911 | 887 | 223.1 |
| D | 2 | 250 | 374457 | 1674.42 | 911 | 887 | 223.1 |
| D | 7 | 80 | 331776 | 1483.12 | 911 | 887 | 223.1 |
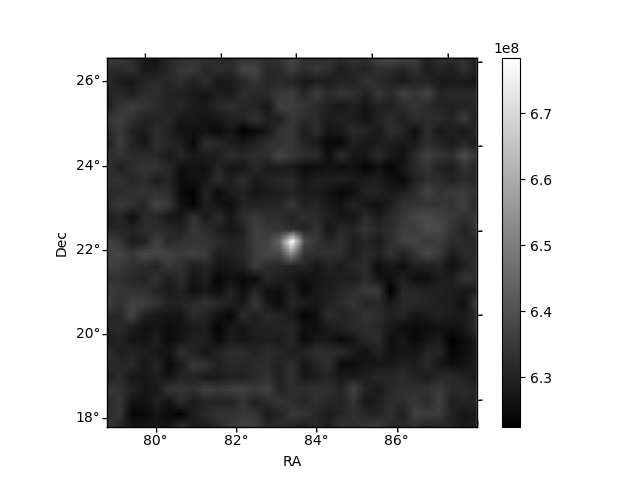
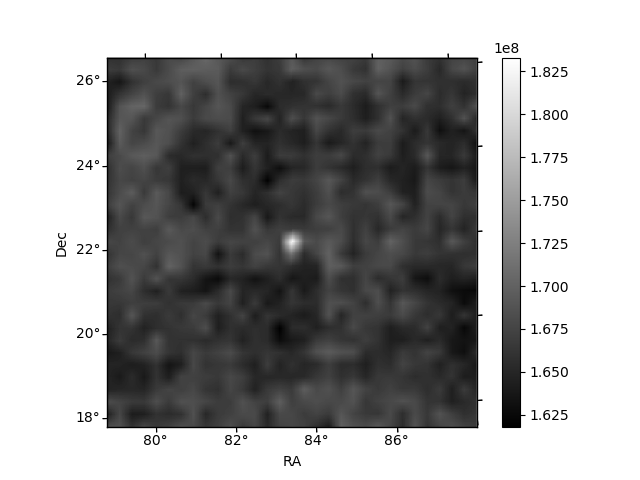
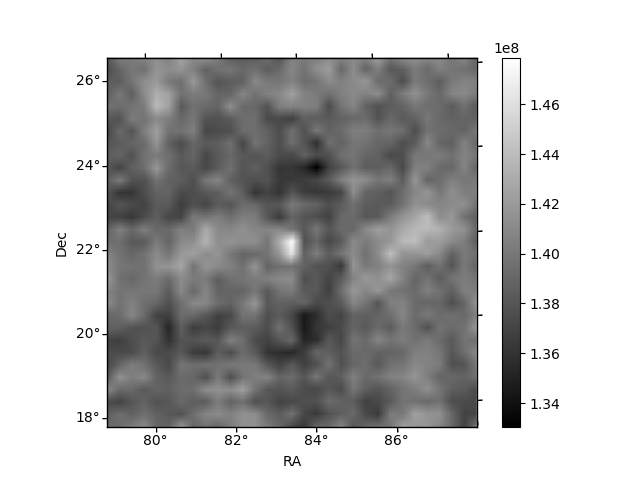
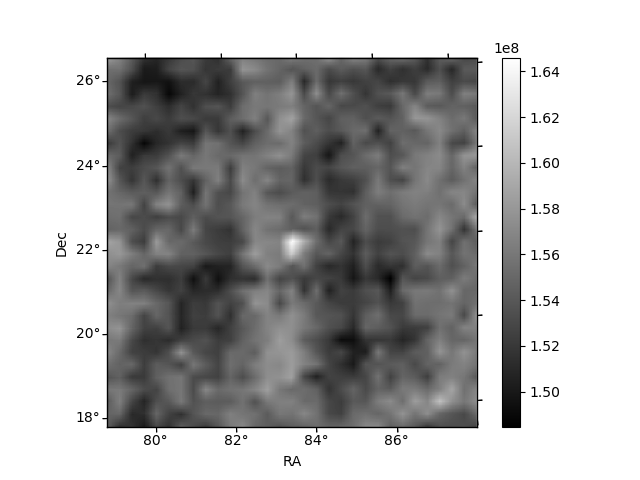
Histogram calculated using DETX and DETY for each event in the final _common_clean file
| Quadrant A | 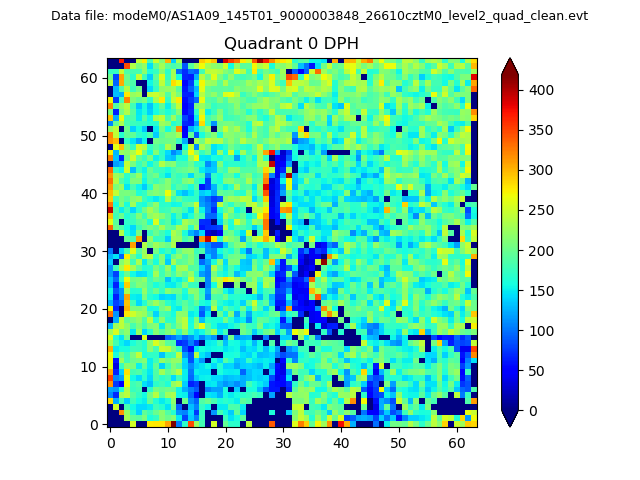 |
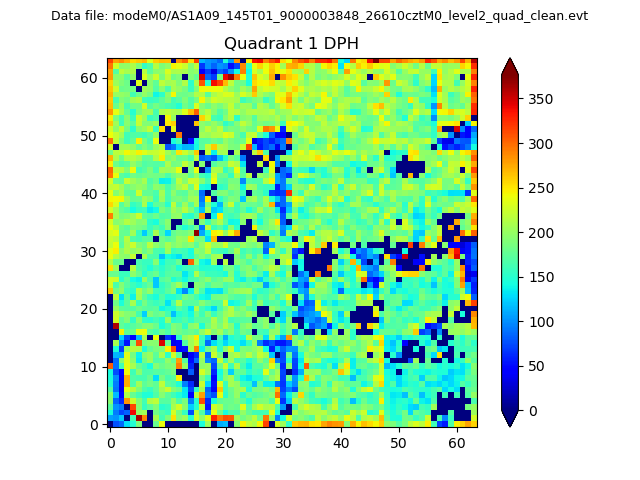 |
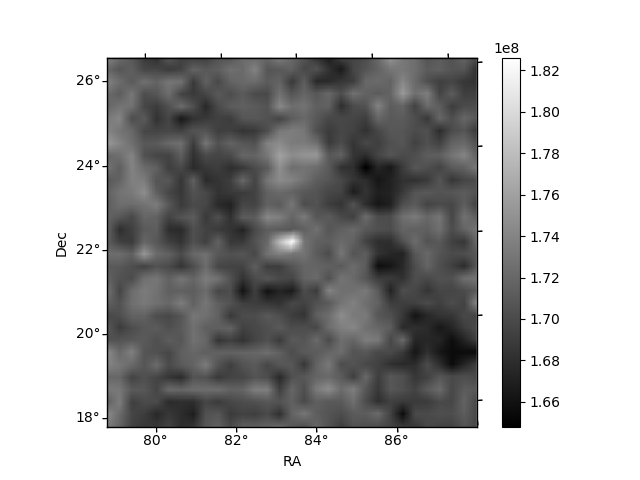
Quadrant B |
|---|---|---|---|
| Quadrant D | 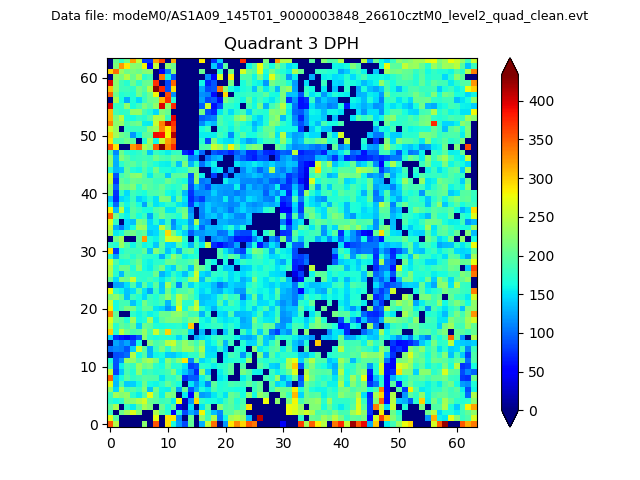 |
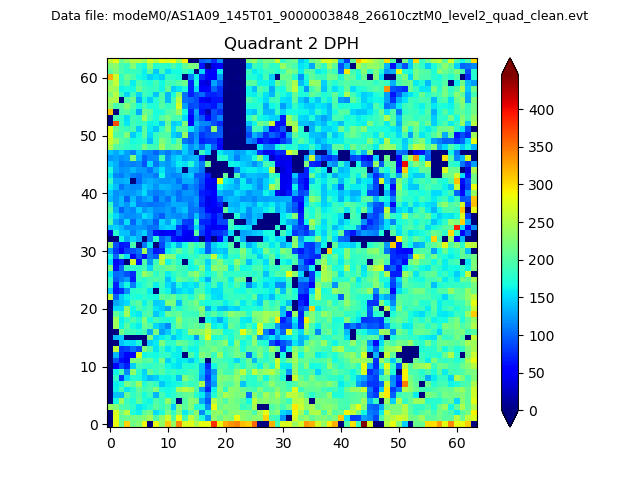 |
Quadrant C |
| Plot type | Count rate plots | Images |
|---|---|---|
| Comparison with Poisson distribution Blue bars denote a histogram of data divided into 1 sec bins. Red curve is a Poisson curve with rate = median count rate of data. |
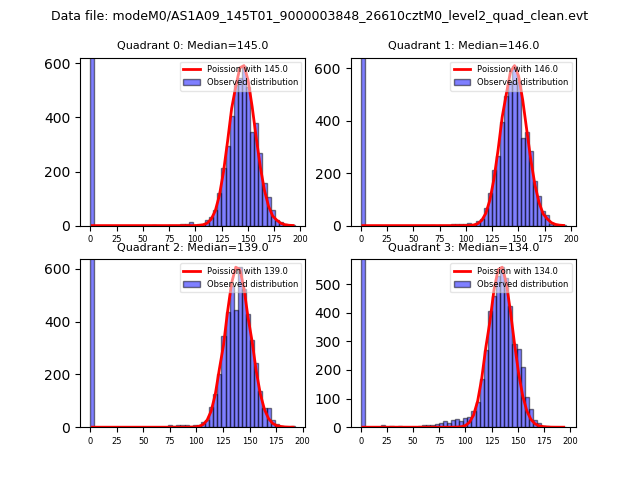 |
 |
| Quadrant-wise count rates Data is divided into 100 sec bins |
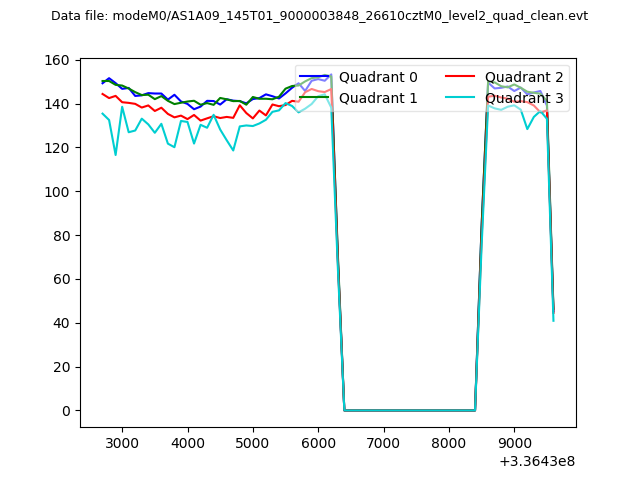 |
|
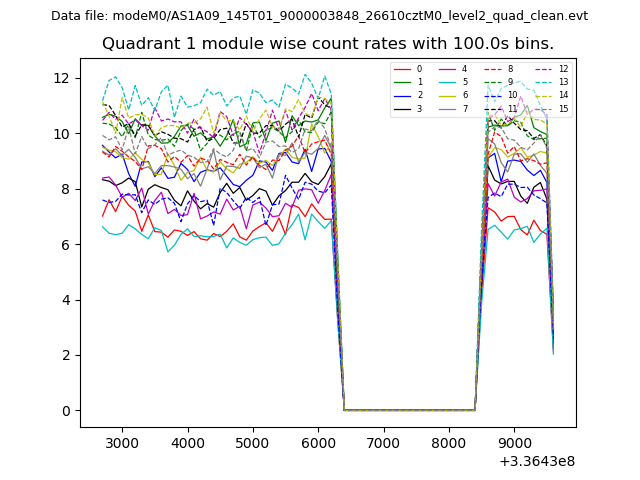
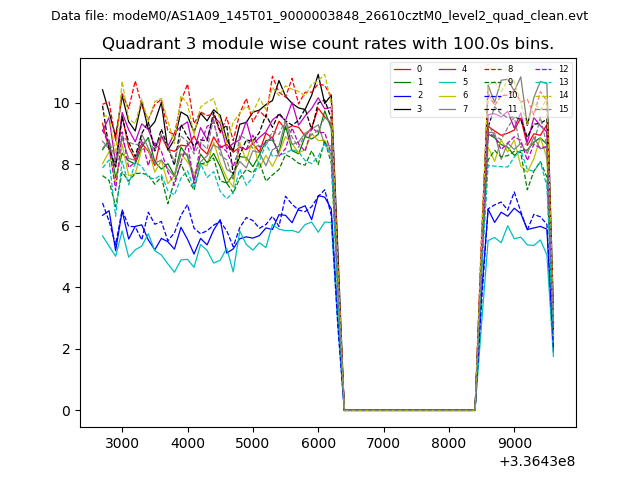
| Module-wise count rates for Quadrant A Data is divided into 100 sec bins |
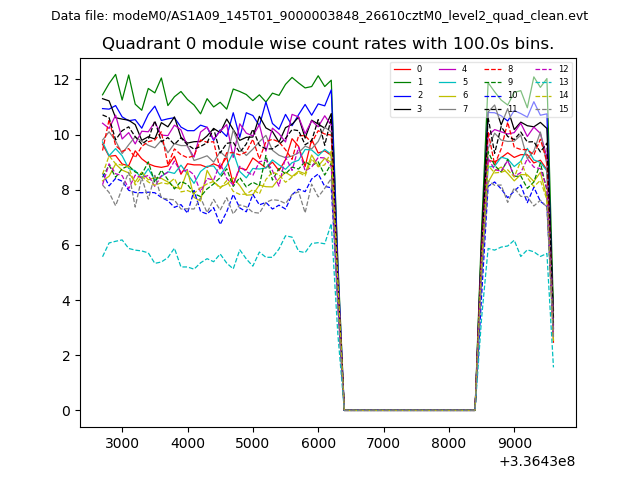 |
 |
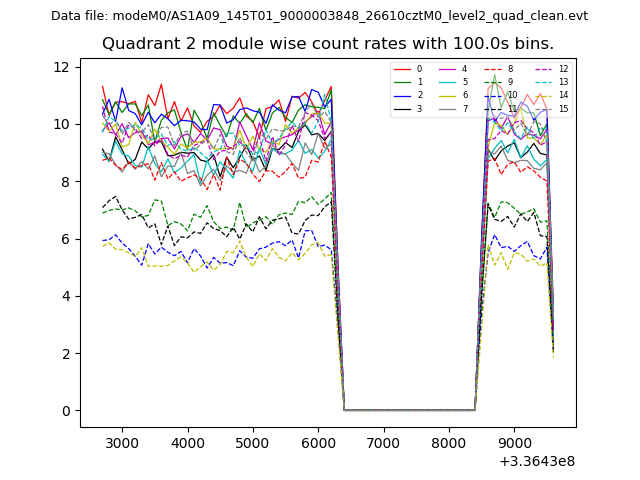
| Module-wise count rates for Quadrant B Data is divided into 100 sec bins |
 |
 |
| Module-wise count rates for Quadrant C Data is divided into 100 sec bins |
 |
 |
| Module-wise count rates for Quadrant D Data is divided into 100 sec bins |
 |
 |
| Parameter | Plot |
|---|---|
| CZT HV Monitor | 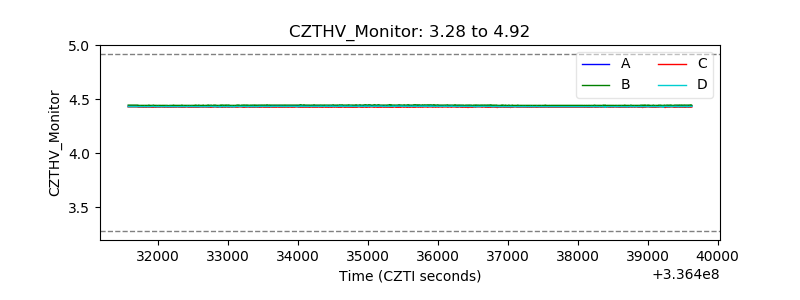 |
| D_VDD | 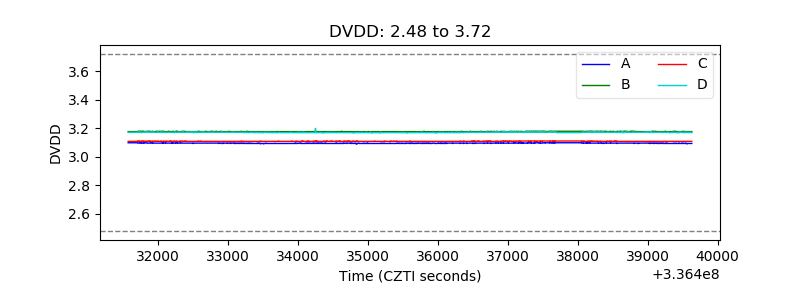 |
| Temperature 1 | 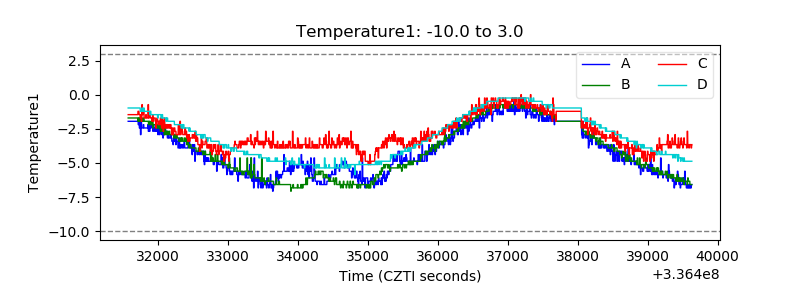 |
| Veto HV Monitor | 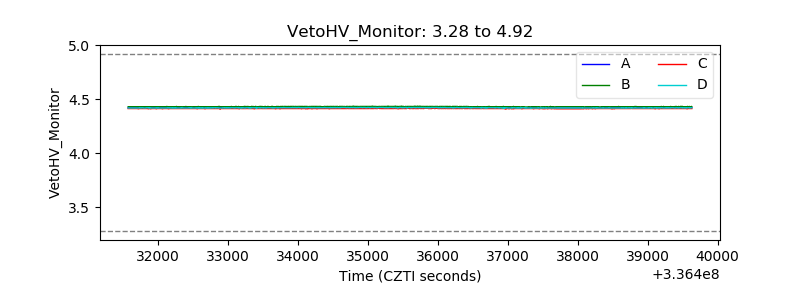 |
| Veto LLD | 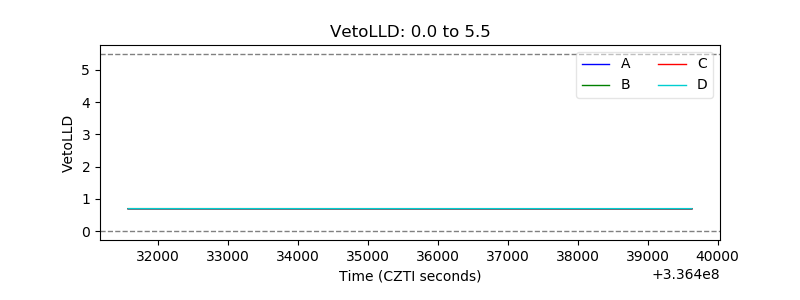 |
| Alpha Counter | 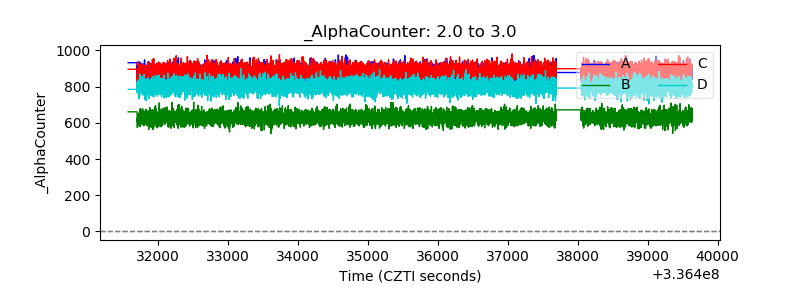 |
| _CPM_Rate | 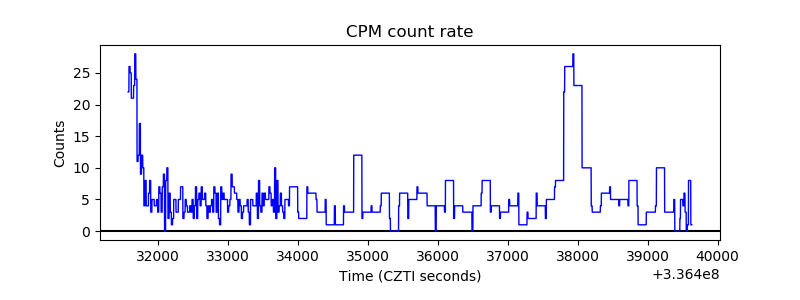 |
| CZT Counter | 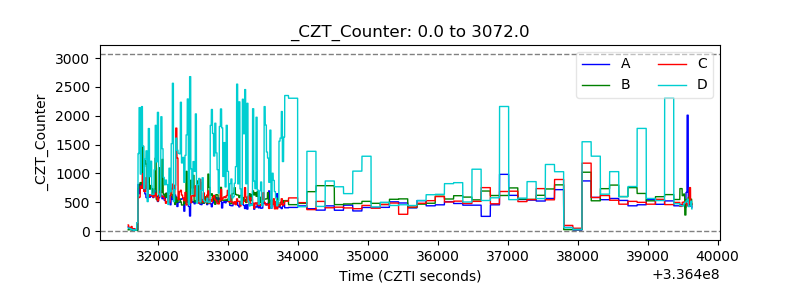 |
| +2.5 Volts monitor |  |
| +5 Volts monitor | 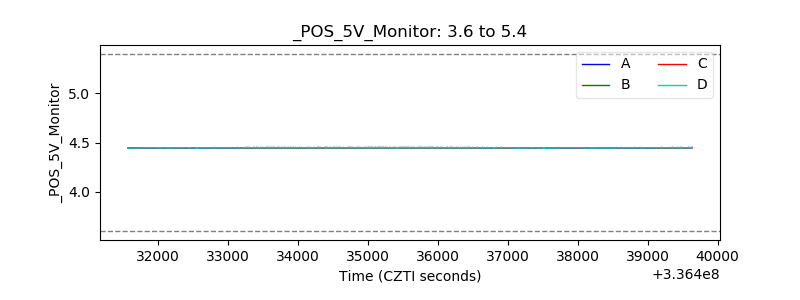 |
| _ROLL_ROT | 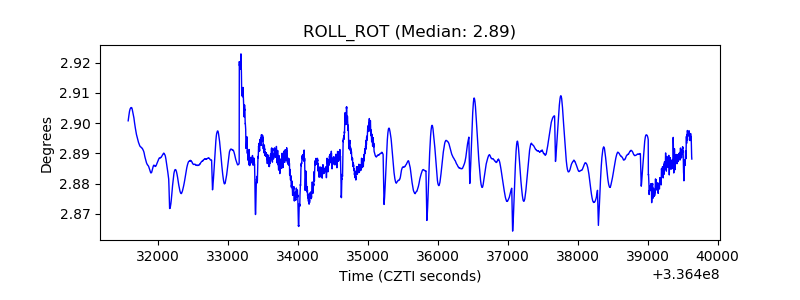 |
| _Roll_DEC | 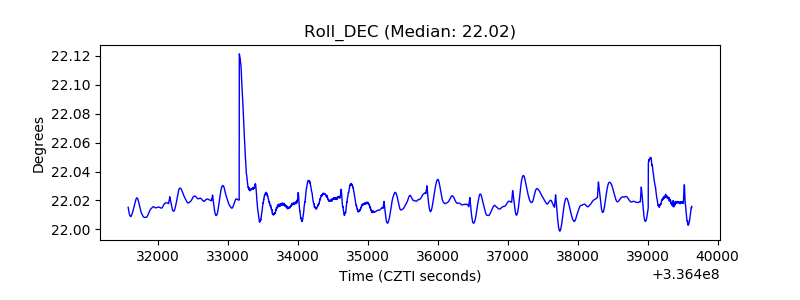 |
| _Roll_RA | 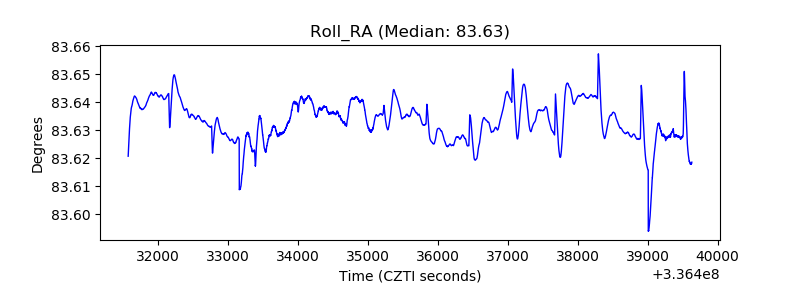 |
| Veto Counter | 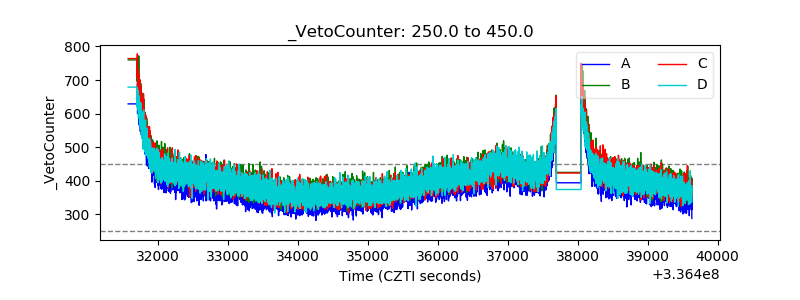 |