| Param | Original file | Final file |
|---|---|---|
| Filename | modeM0/AS1A09_145T01_9000003848_26613cztM0_level2.evt | modeM0/AS1A09_145T01_9000003848_26613cztM0_level2_quad_clean.evt |
| Size (bytes) | 603,720,000 | 91,143,360 |
| Size | 575.8 MB | 86.9 MB |
| Events in quadrant A | 3,625,873 | 608,825 |
| Events in quadrant B | 4,628,429 | 556,811 |
| Events in quadrant C | 4,084,547 | 576,142 |
| Events in quadrant D | 5,444,591 | 505,684 |
| Mode M0 | |||
|---|---|---|---|
| Quadrant | BADHDUFLAG | Total packets | Discarded packets |
| A | 0 | 15124 | 0 |
| B | 0 | 18055 | 0 |
| C | 0 | 16549 | 0 |
| D | 0 | 20762 | 0 |
| Mode M9 | |||
|---|---|---|---|
| Quadrant | BADHDUFLAG | Total packets | Discarded packets |
| A | 0 | 20 | 6 |
| B | 0 | 22 | 8 |
| C | 0 | 20 | 6 |
| D | 0 | 21 | 8 |
| Quadrant | Total seconds | Saturated seconds | Saturation percentage |
|---|---|---|---|
| A | 7185 | 59 | 0.821155% |
| B | 6775 | 155 | 2.287823% |
| C | 7068 | 186 | 2.631579% |
| D | 6496 | 550 | 8.466749% |
Noise dominated data is calculated using 1-second bins in cleaned event files. If a bin has >2000 counts, and if more than 50% of those come from <1% of pixels, then it is considered to be noise-dominated and hence unusable.
| Quadrant | # 1 sec bins | Bins with >0 counts | Bins with >2000 counts | High rate bins dominated by noise | Noise dominated (total time) | Noise dominated (detector-on time) | Marked lightcurve |
|---|---|---|---|---|---|---|---|
| A | 16275 | 8591 | 7 | 7 | 0.04% | 0.08% | 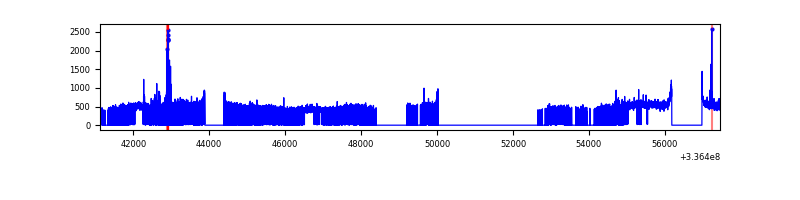 |
| B | 16289 | 8117 | 53 | 53 | 0.33% | 0.65% | 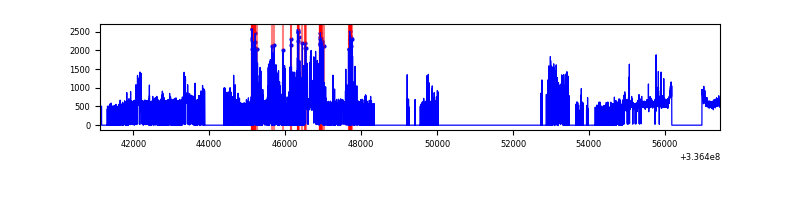 |
| C | 16307 | 8437 | 7 | 7 | 0.04% | 0.08% | 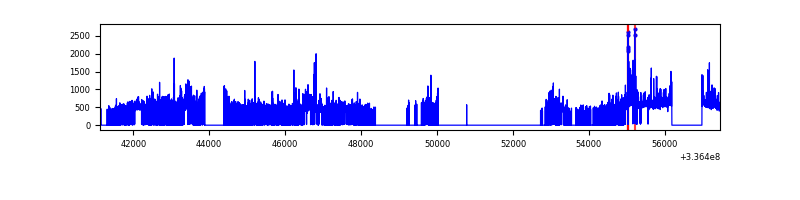 |
| D | 16327 | 7869 | 430 | 430 | 2.63% | 5.46% | 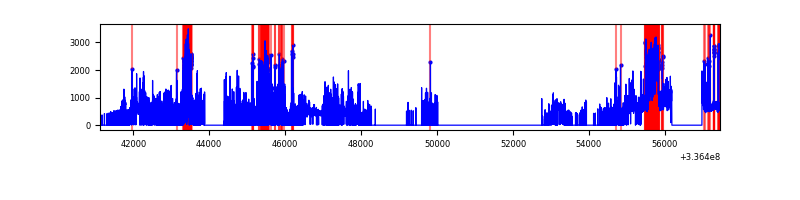 |
Top three noisy pixels from each quadrant. If the there are fewer than three noisy pixels in the level2.evt file, extra rows are filled as -1
| Pixel properties | Quadrant properties | ||||||
|---|---|---|---|---|---|---|---|
| Quadrant | DetID | PixID | Counts | Sigma | Mean | Median | Sigma |
| A | 0 | 13 | 90965 | 485.64 | 913 | 896 | 185.5 |
| A | 13 | 254 | 11942 | 59.56 | 913 | 896 | 185.5 |
| A | 5 | 168 | 11166 | 55.37 | 913 | 896 | 185.5 |
| B | 0 | 189 | 1198135 | 7293.53 | 853 | 833 | 164.2 |
| B | 15 | 32 | 34085 | 202.56 | 853 | 833 | 164.2 |
| B | 0 | 219 | 27902 | 164.89 | 853 | 833 | 164.2 |
| C | 3 | 233 | 514448 | 2552.56 | 853 | 862 | 201.2 |
| C | 14 | 238 | 136786 | 675.55 | 853 | 862 | 201.2 |
| C | 15 | 208 | 108874 | 536.83 | 853 | 862 | 201.2 |
| D | 1 | 52 | 1548733 | 8159.38 | 765 | 743 | 189.7 |
| D | 7 | 80 | 820222 | 4319.43 | 765 | 743 | 189.7 |
| D | 2 | 250 | 146003 | 765.66 | 765 | 743 | 189.7 |
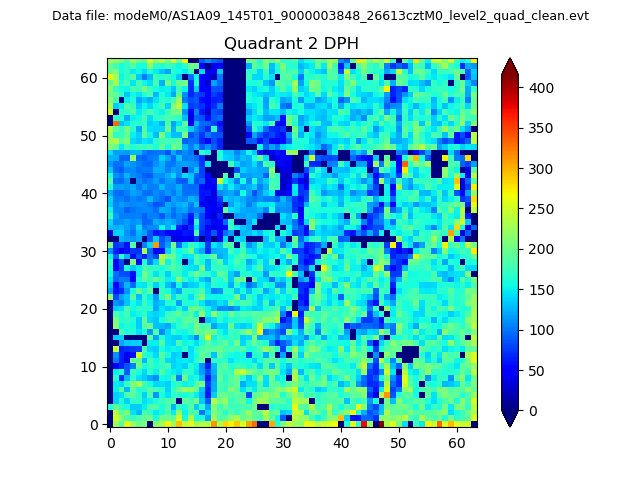
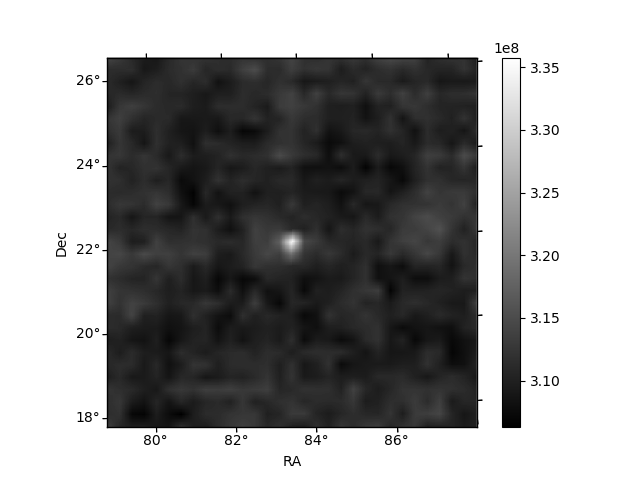
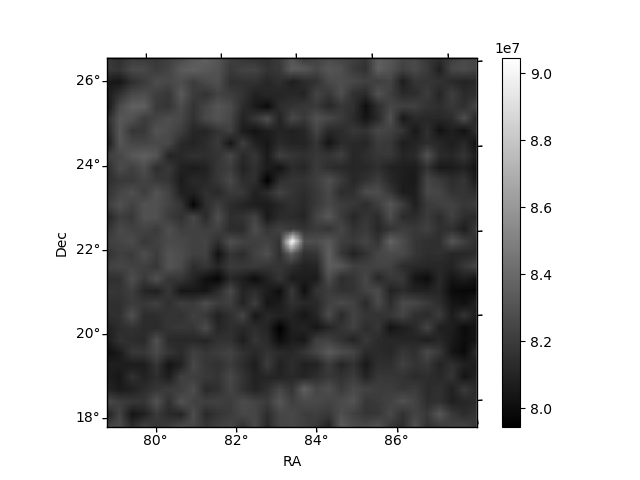
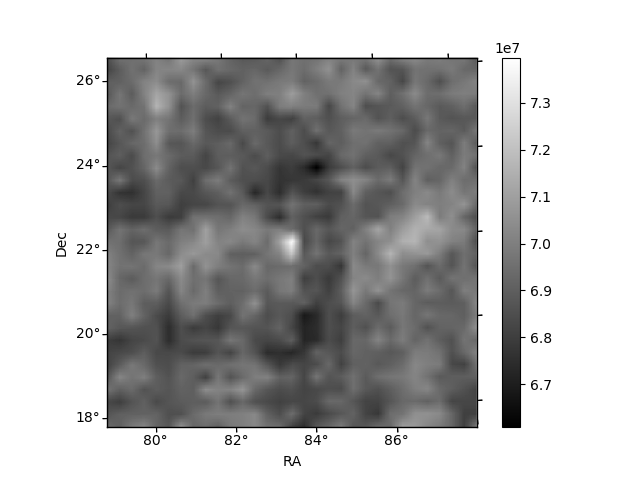
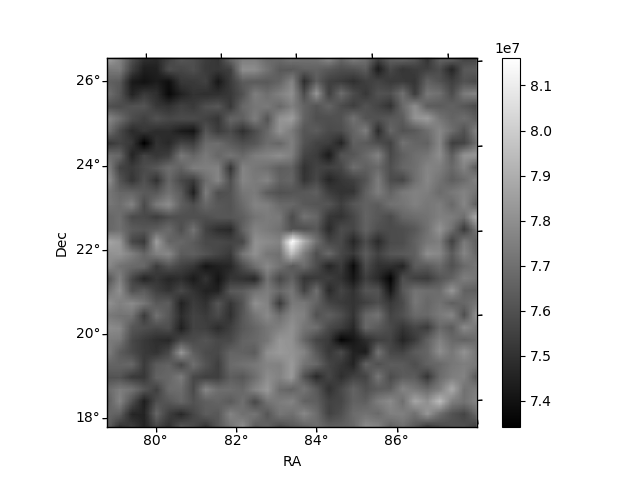
Histogram calculated using DETX and DETY for each event in the final _common_clean file
| Quadrant A | 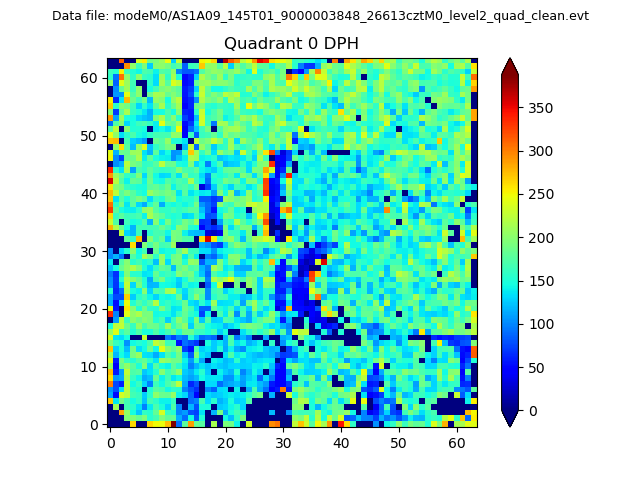 |
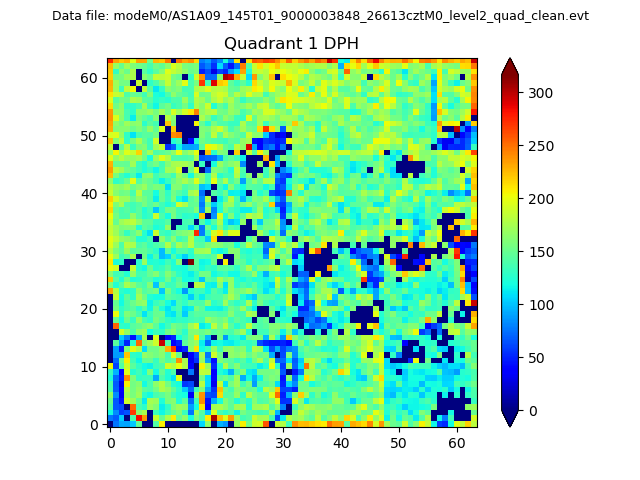 |
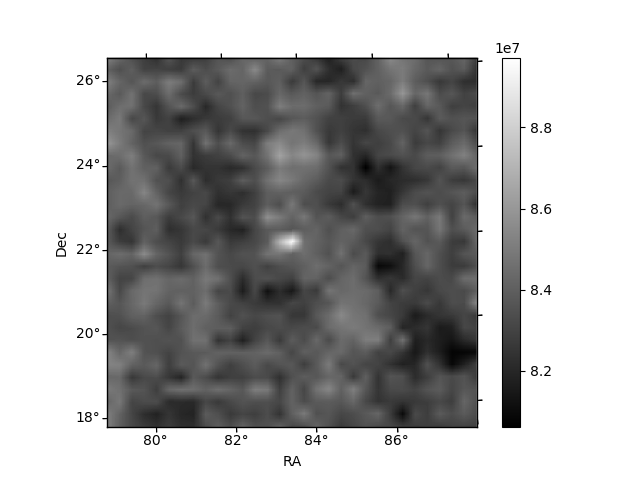
Quadrant B |
|---|---|---|---|
| Quadrant D | 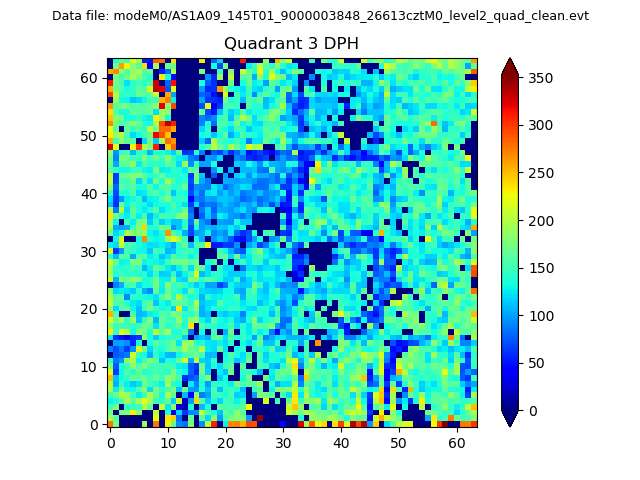 |
 |
Quadrant C |
| Plot type | Count rate plots | Images |
|---|---|---|
| Comparison with Poisson distribution Blue bars denote a histogram of data divided into 1 sec bins. Red curve is a Poisson curve with rate = median count rate of data. |
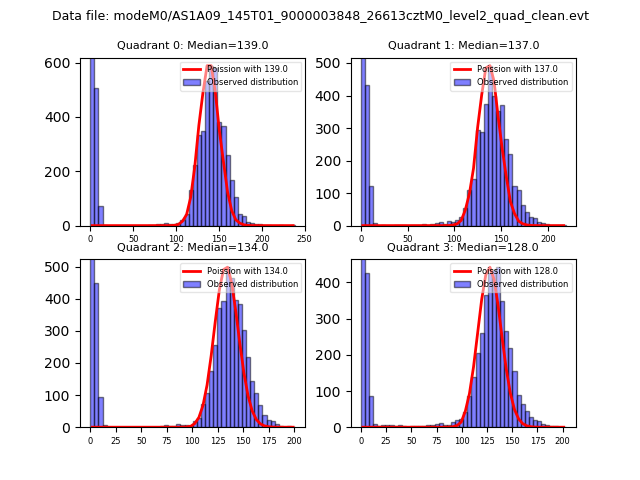 |
 |
| Quadrant-wise count rates Data is divided into 100 sec bins |
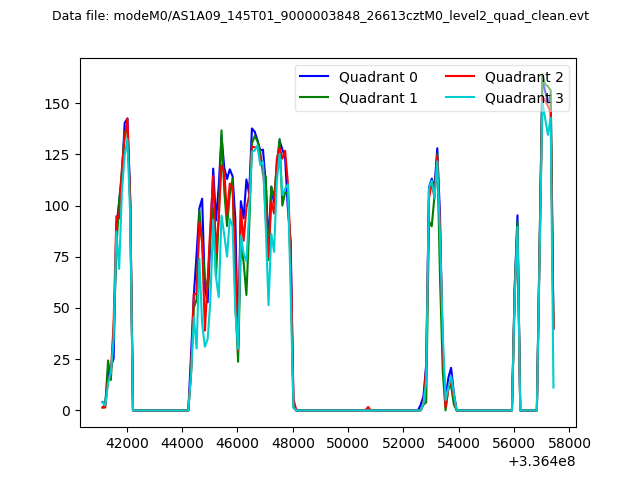 |
|
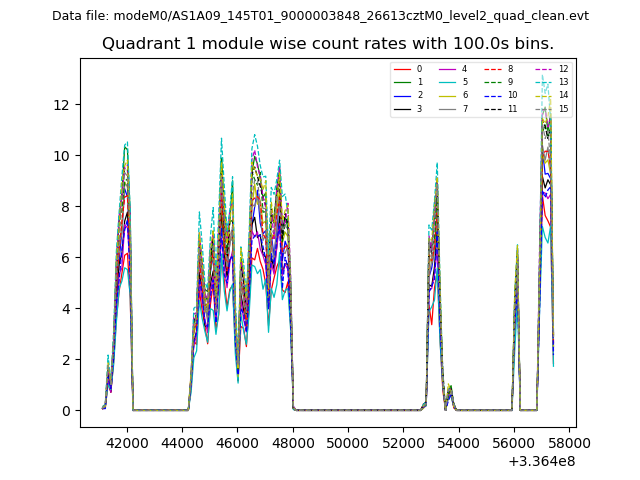
| Module-wise count rates for Quadrant A Data is divided into 100 sec bins |
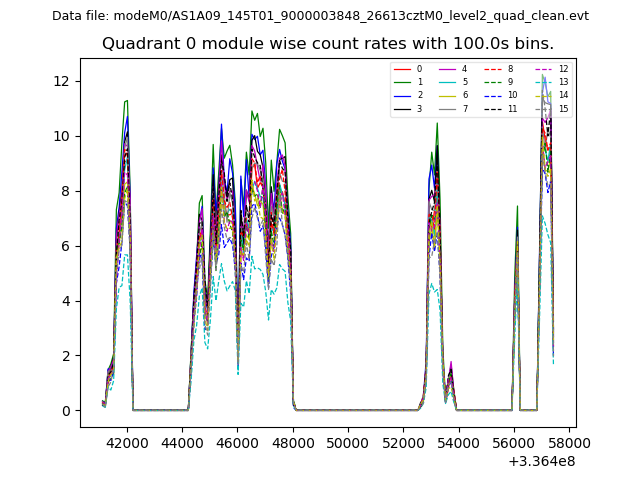 |
 |
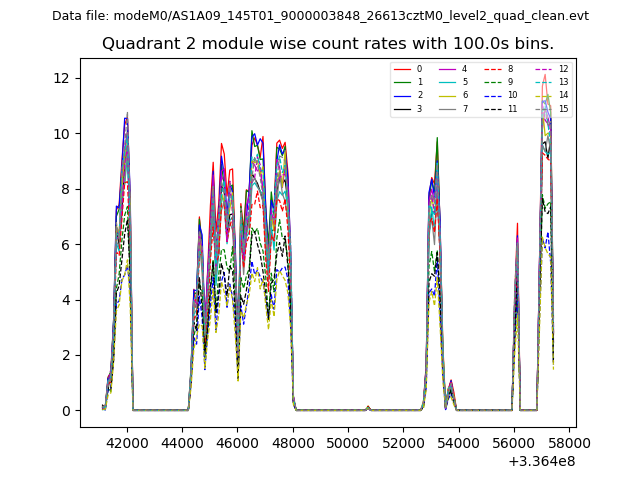
| Module-wise count rates for Quadrant B Data is divided into 100 sec bins |
 |
 |
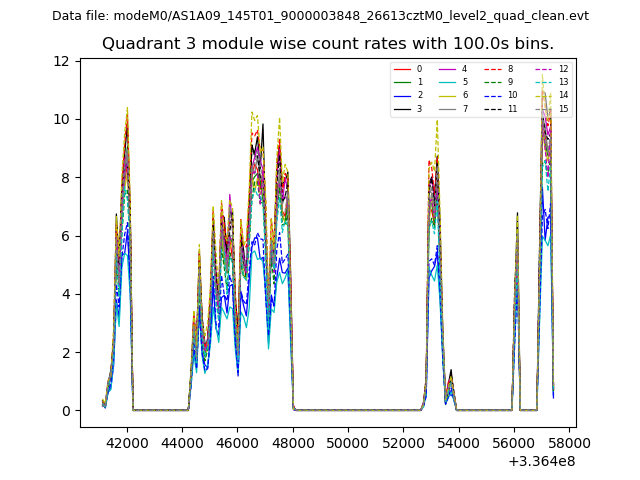
| Module-wise count rates for Quadrant C Data is divided into 100 sec bins |
 |
 |
| Module-wise count rates for Quadrant D Data is divided into 100 sec bins |
 |
 |
| Parameter | Plot |
|---|---|
| CZT HV Monitor | 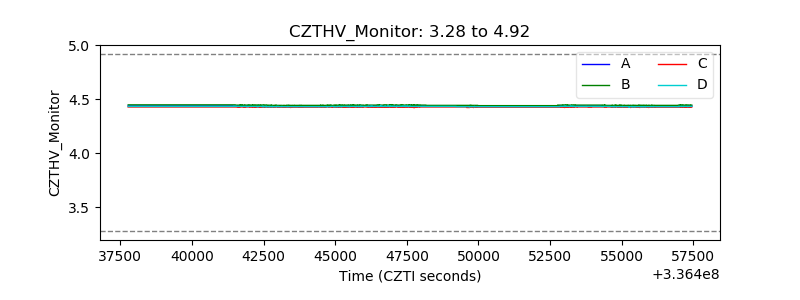 |
| D_VDD | 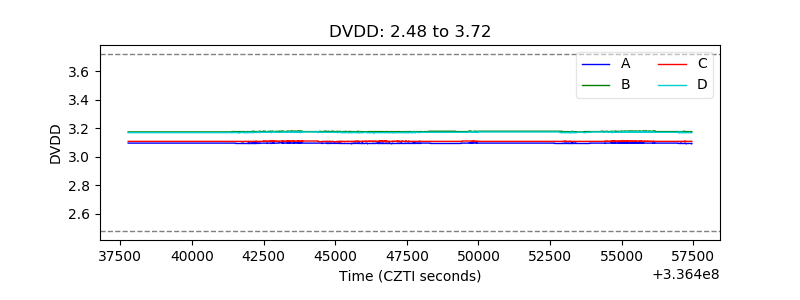 |
| Temperature 1 | 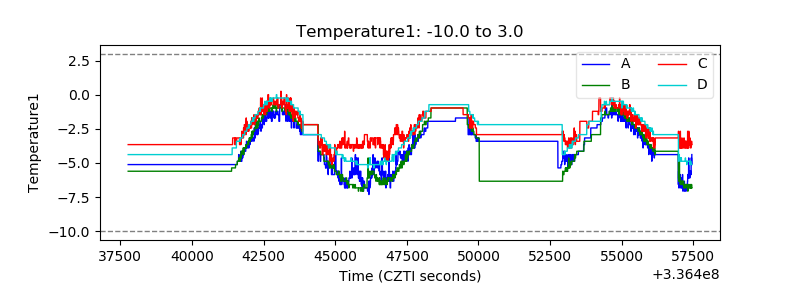 |
| Veto HV Monitor | 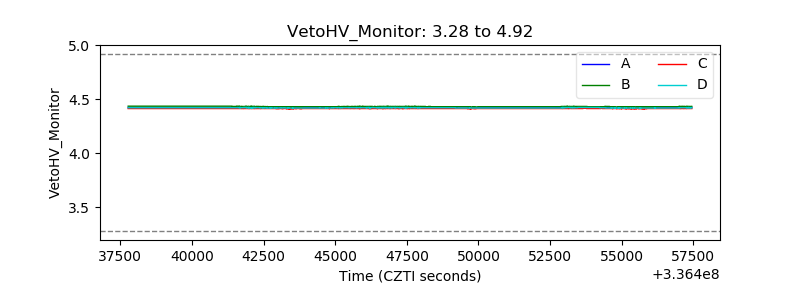 |
| Veto LLD | 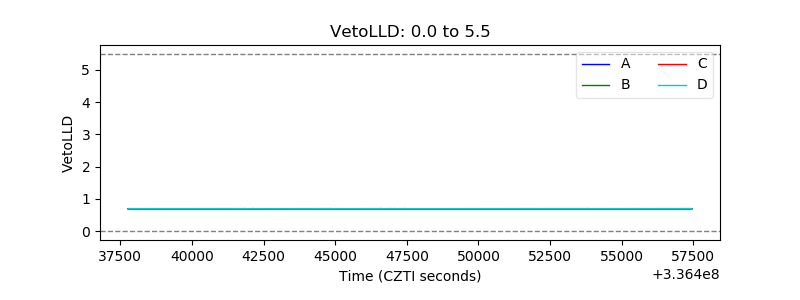 |
| Alpha Counter | 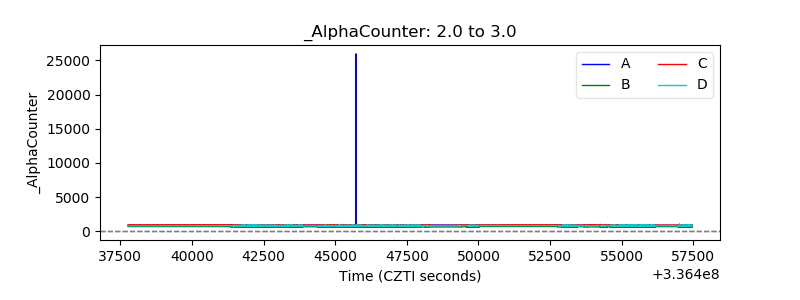 |
| _CPM_Rate | 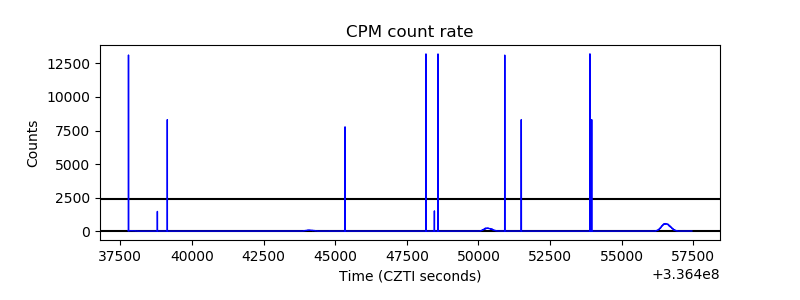 |
| CZT Counter | 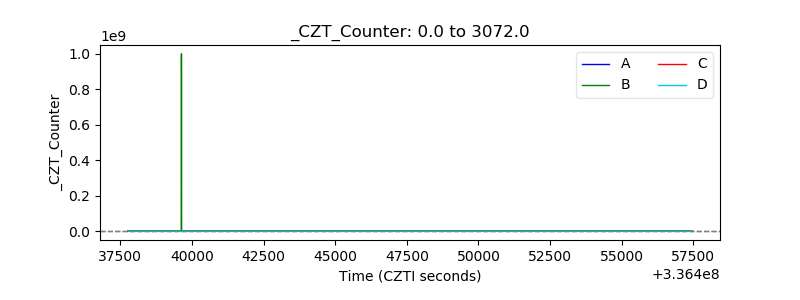 |
| +2.5 Volts monitor |  |
| +5 Volts monitor |  |
| _ROLL_ROT | 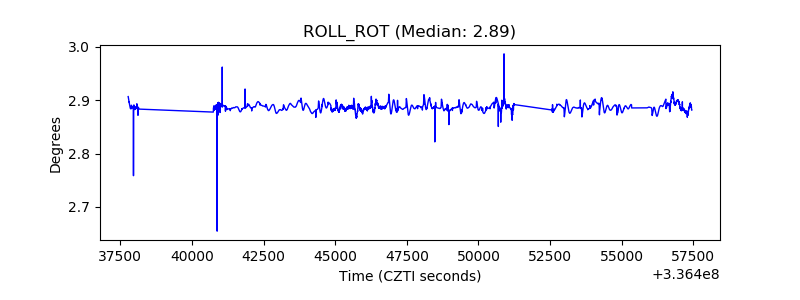 |
| _Roll_DEC | 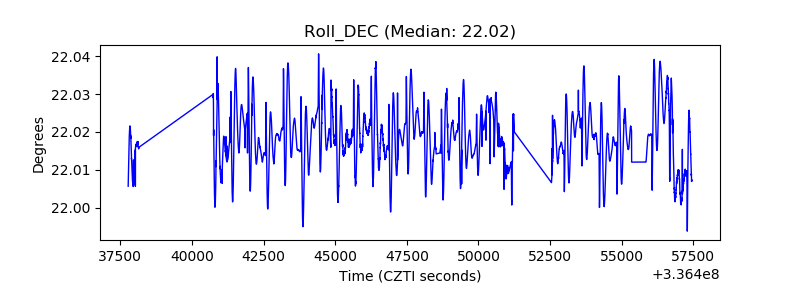 |
| _Roll_RA | 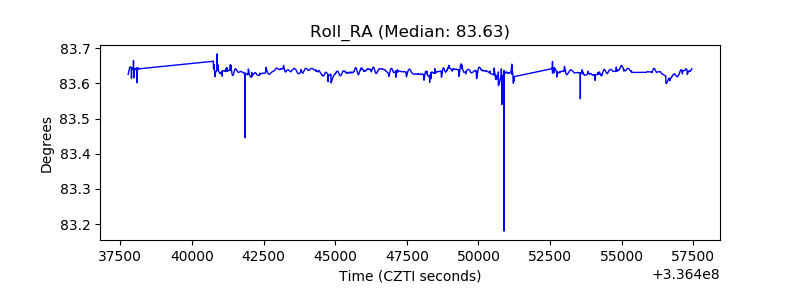 |
| Veto Counter | 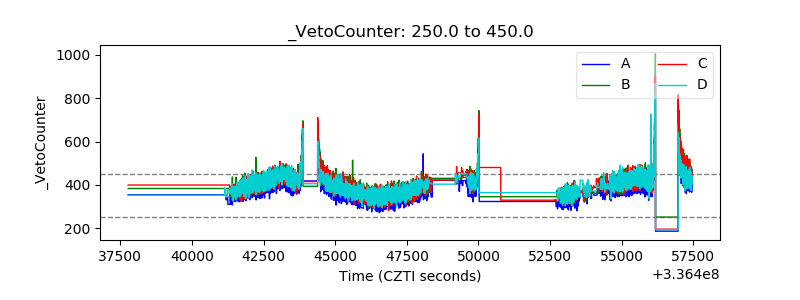 |