| Param | Original file | Final file |
|---|---|---|
| Filename | modeM0/AS1A09_145T01_9000003848_26614cztM0_level2.evt | modeM0/AS1A09_145T01_9000003848_26614cztM0_level2_quad_clean.evt |
| Size (bytes) | 574,441,920 | 104,425,920 |
| Size | 547.8 MB | 99.6 MB |
| Events in quadrant A | 3,554,559 | 691,511 |
| Events in quadrant B | 3,722,683 | 700,492 |
| Events in quadrant C | 3,651,465 | 666,377 |
| Events in quadrant D | 6,004,482 | 626,989 |
| Mode M0 | |||
|---|---|---|---|
| Quadrant | BADHDUFLAG | Total packets | Discarded packets |
| A | 0 | 14796 | 0 |
| B | 0 | 15013 | 0 |
| C | 0 | 15035 | 0 |
| D | 0 | 22586 | 0 |
| Mode M9 | |||
|---|---|---|---|
| Quadrant | BADHDUFLAG | Total packets | Discarded packets |
| A | 0 | 9 | 0 |
| B | 0 | 10 | 0 |
| C | 0 | 10 | 0 |
| D | 0 | 10 | 0 |
| Quadrant | Total seconds | Saturated seconds | Saturation percentage |
|---|---|---|---|
| A | 6846 | 28 | 0.408998% |
| B | 6847 | 39 | 0.569593% |
| C | 6840 | 85 | 1.242690% |
| D | 6837 | 613 | 8.965921% |
Noise dominated data is calculated using 1-second bins in cleaned event files. If a bin has >2000 counts, and if more than 50% of those come from <1% of pixels, then it is considered to be noise-dominated and hence unusable.
| Quadrant | # 1 sec bins | Bins with >0 counts | Bins with >2000 counts | High rate bins dominated by noise | Noise dominated (total time) | Noise dominated (detector-on time) | Marked lightcurve |
|---|---|---|---|---|---|---|---|
| A | 7800 | 6851 | 2 | 2 | 0.03% | 0.03% | 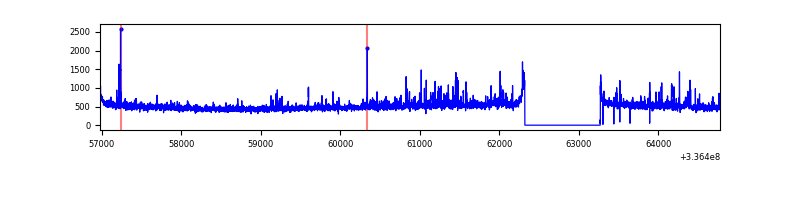 |
| B | 7800 | 6850 | 2 | 2 | 0.03% | 0.03% | 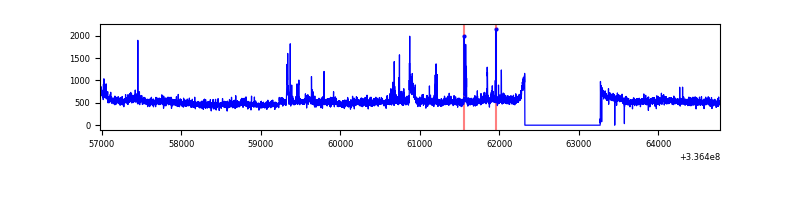 |
| C | 7799 | 6850 | 1 | 1 | 0.01% | 0.01% | 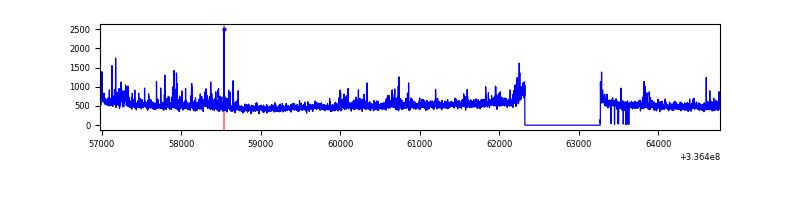 |
| D | 7799 | 6849 | 564 | 564 | 7.23% | 8.23% | 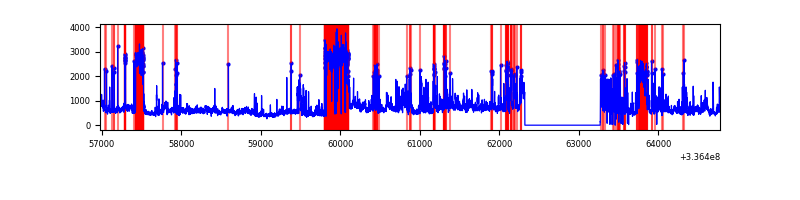 |
Top three noisy pixels from each quadrant. If the there are fewer than three noisy pixels in the level2.evt file, extra rows are filled as -1
| Pixel properties | Quadrant properties | ||||||
|---|---|---|---|---|---|---|---|
| Quadrant | DetID | PixID | Counts | Sigma | Mean | Median | Sigma |
| A | 0 | 13 | 245381 | 1421.09 | 855 | 841 | 172.1 |
| A | 5 | 168 | 12946 | 70.35 | 855 | 841 | 172.1 |
| A | 13 | 254 | 11377 | 61.23 | 855 | 841 | 172.1 |
| B | 0 | 189 | 285085 | 1746.57 | 852 | 835 | 162.7 |
| B | 5 | 172 | 55225 | 334.2 | 852 | 835 | 162.7 |
| B | 12 | 111 | 19081 | 112.11 | 852 | 835 | 162.7 |
| C | 3 | 233 | 337248 | 1759.13 | 812 | 819 | 191.2 |
| C | 14 | 238 | 130018 | 675.56 | 812 | 819 | 191.2 |
| C | 15 | 208 | 18412 | 91.99 | 812 | 819 | 191.2 |
| D | 1 | 52 | 1506937 | 7887.9 | 779 | 760 | 190.9 |
| D | 7 | 80 | 1226318 | 6418.29 | 779 | 760 | 190.9 |
| D | 2 | 250 | 314810 | 1644.69 | 779 | 760 | 190.9 |
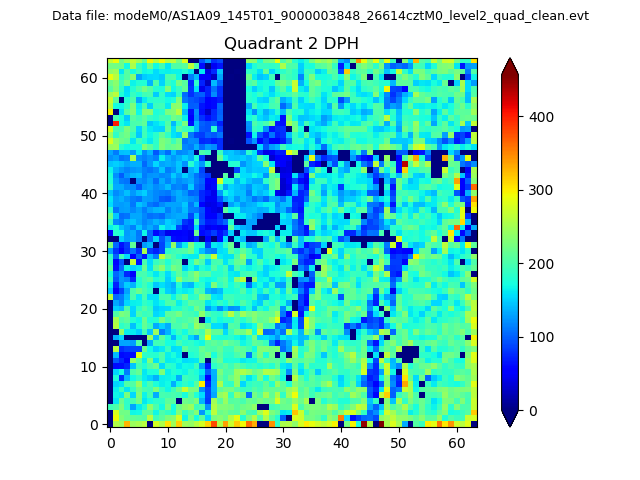
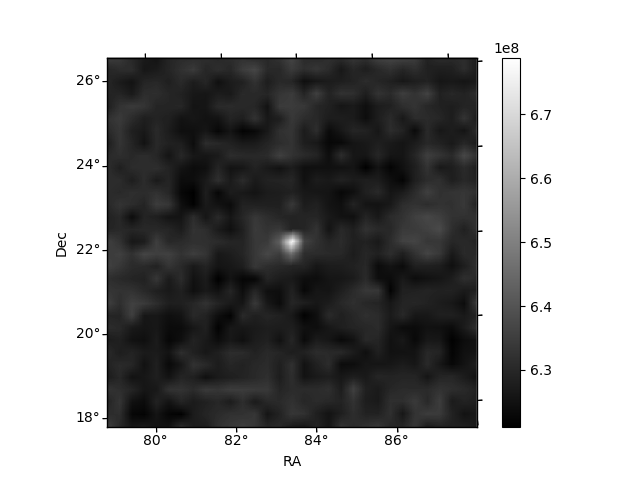
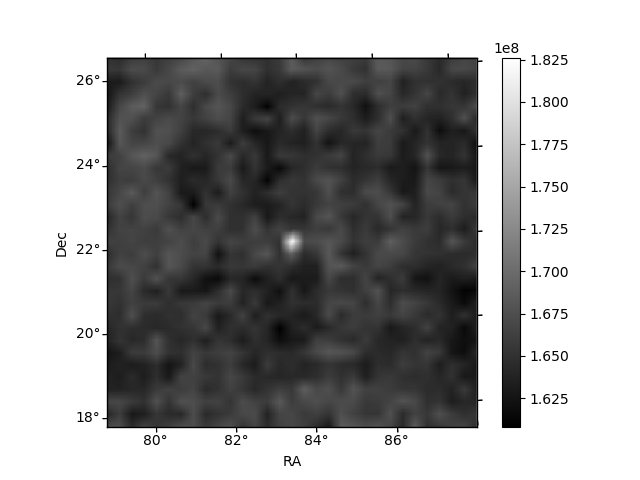
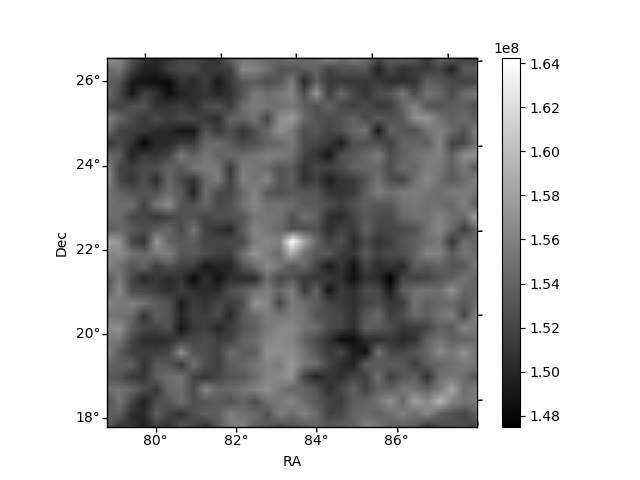
Histogram calculated using DETX and DETY for each event in the final _common_clean file
| Quadrant A | 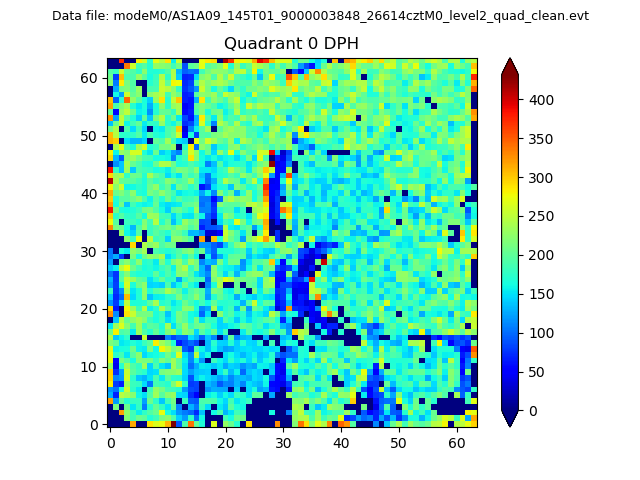 |
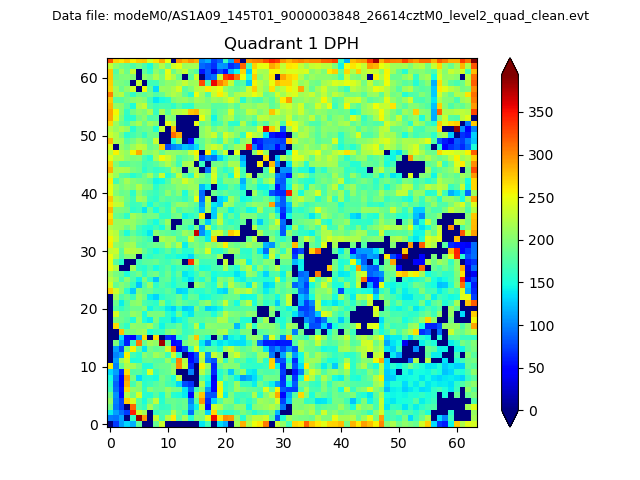 |
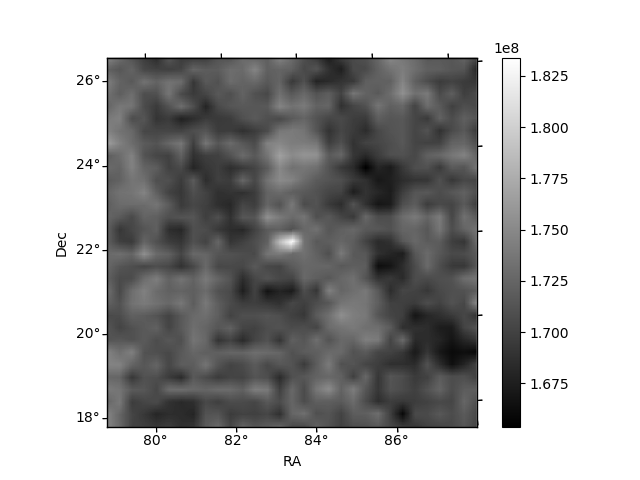
Quadrant B |
|---|---|---|---|
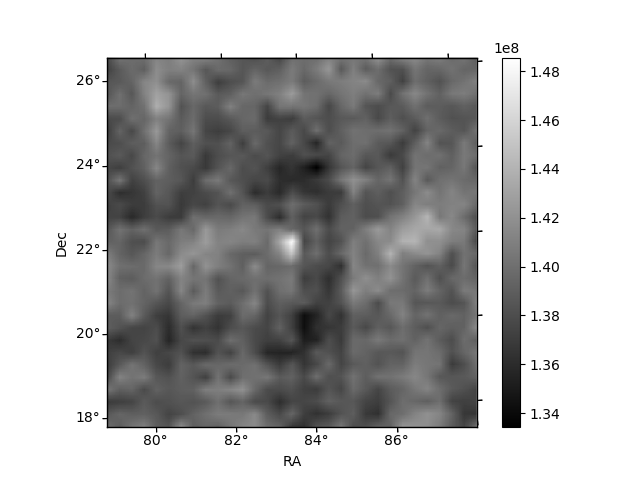
| Quadrant D | 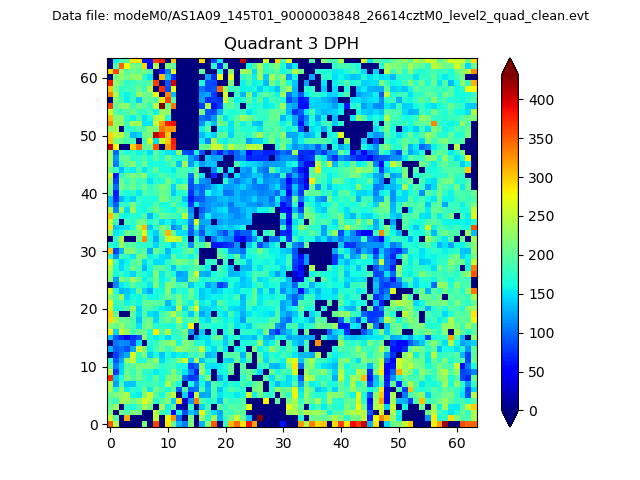 |
 |
Quadrant C |
| Plot type | Count rate plots | Images |
|---|---|---|
| Comparison with Poisson distribution Blue bars denote a histogram of data divided into 1 sec bins. Red curve is a Poisson curve with rate = median count rate of data. |
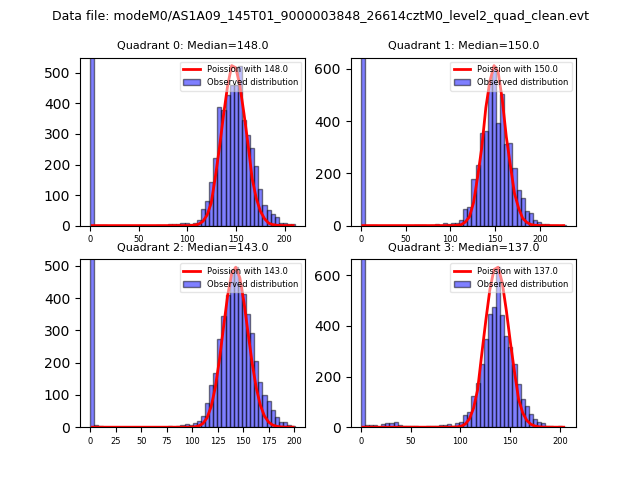 |
 |
| Quadrant-wise count rates Data is divided into 100 sec bins |
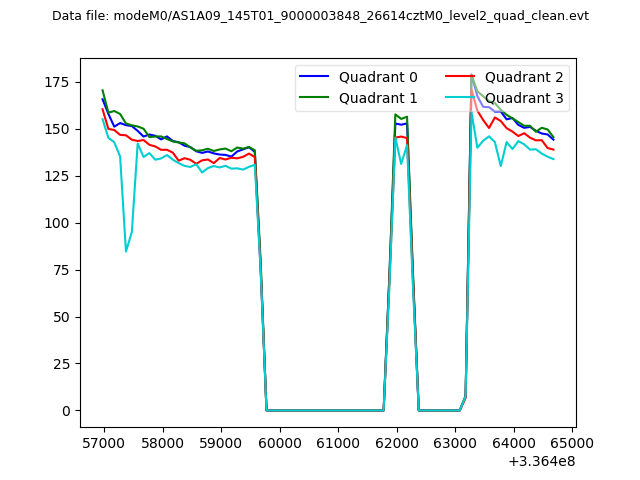 |
|
| Module-wise count rates for Quadrant A Data is divided into 100 sec bins |
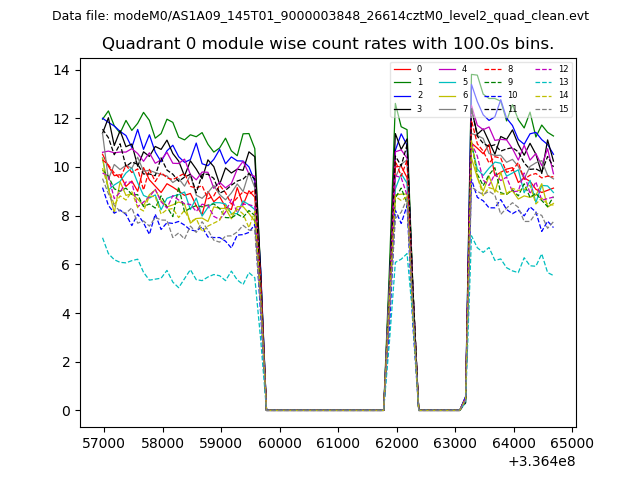 |
 |
| Module-wise count rates for Quadrant B Data is divided into 100 sec bins |
 |
 |
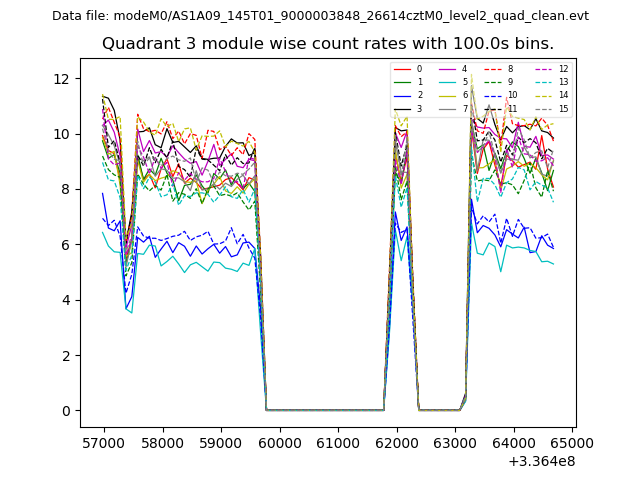
| Module-wise count rates for Quadrant C Data is divided into 100 sec bins |
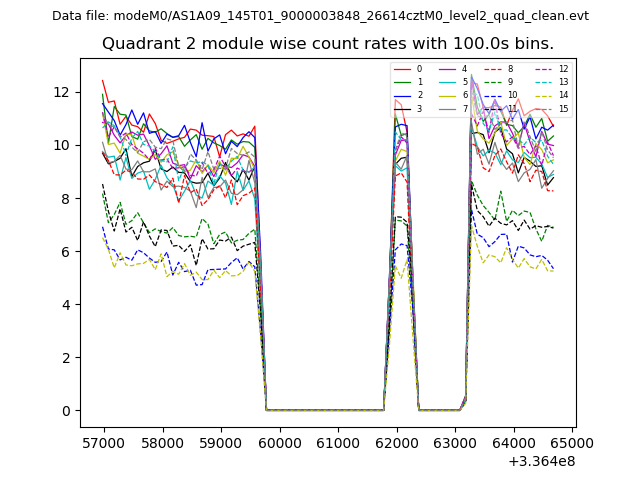 |
 |
| Module-wise count rates for Quadrant D Data is divided into 100 sec bins |
 |
 |
| Parameter | Plot |
|---|---|
| CZT HV Monitor |  |
| D_VDD | 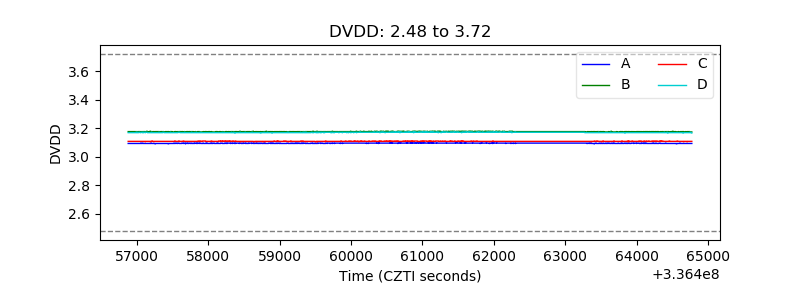 |
| Temperature 1 | 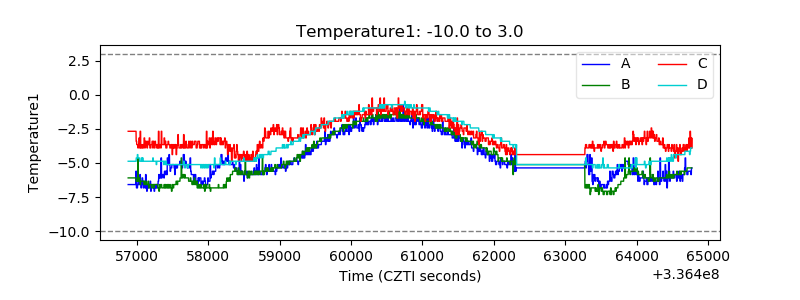 |
| Veto HV Monitor | 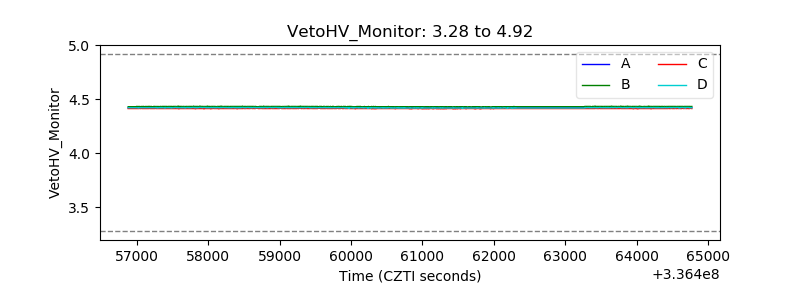 |
| Veto LLD | 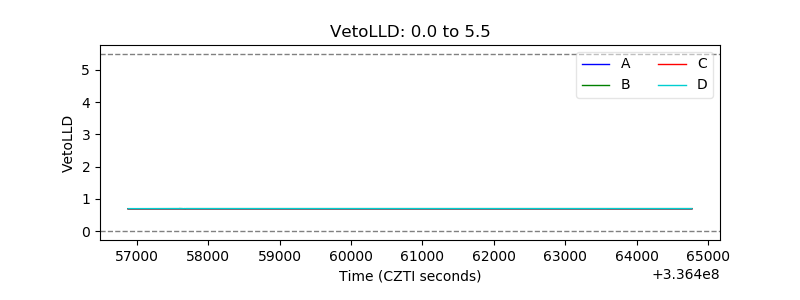 |
| Alpha Counter |  |
| _CPM_Rate | 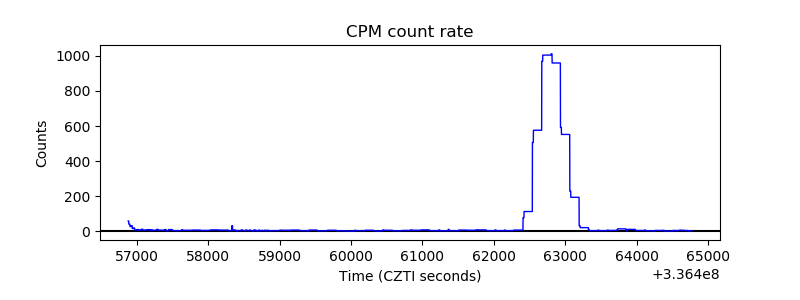 |
| CZT Counter | 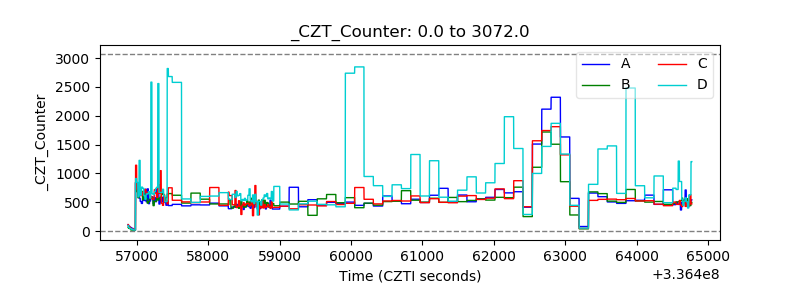 |
| +2.5 Volts monitor | 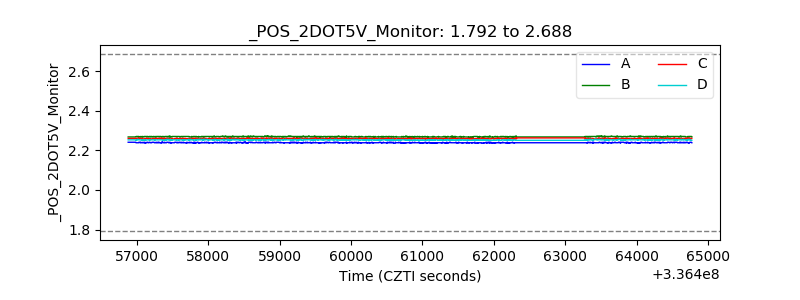 |
| +5 Volts monitor | 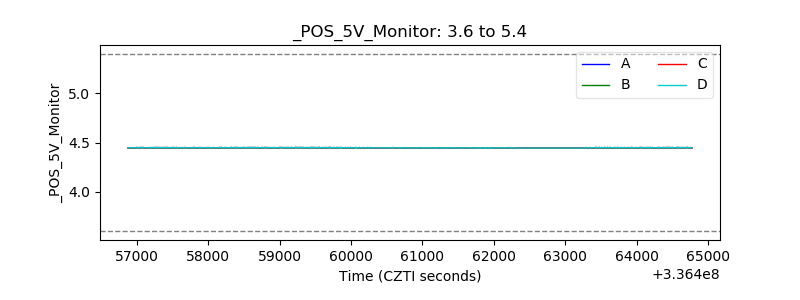 |
| _ROLL_ROT | 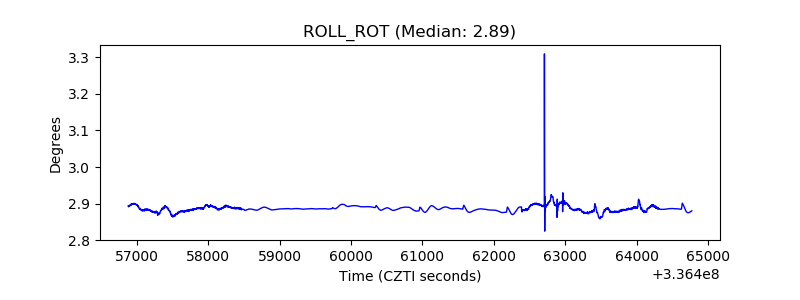 |
| _Roll_DEC |  |
| _Roll_RA | 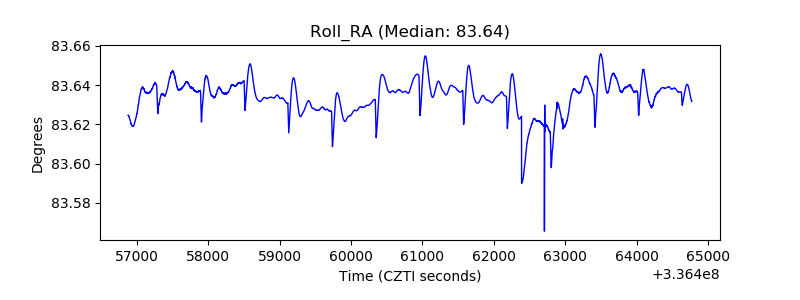 |
| Veto Counter |  |