| Param | Original file | Final file |
|---|---|---|
| Filename | modeM0/AS1A09_145T01_9000003848_26616cztM0_level2.evt | modeM0/AS1A09_145T01_9000003848_26616cztM0_level2_quad_clean.evt |
| Size (bytes) | 2,481,935,040 | 407,027,520 |
| Size | 2.3 GB | 388.2 MB |
| Events in quadrant A | 14,595,612 | 2,675,888 |
| Events in quadrant B | 18,492,920 | 2,681,832 |
| Events in quadrant C | 15,494,016 | 2,583,815 |
| Events in quadrant D | 24,662,345 | 2,424,752 |
| Mode M0 | |||
|---|---|---|---|
| Quadrant | BADHDUFLAG | Total packets | Discarded packets |
| A | 0 | 61024 | 0 |
| B | 0 | 73108 | 0 |
| C | 0 | 63699 | 0 |
| D | 0 | 93500 | 0 |
| Mode M9 | |||
|---|---|---|---|
| Quadrant | BADHDUFLAG | Total packets | Discarded packets |
| A | 0 | 37 | 0 |
| B | 0 | 37 | 0 |
| C | 0 | 37 | 0 |
| D | 0 | 37 | 0 |
| Quadrant | Total seconds | Saturated seconds | Saturation percentage |
|---|---|---|---|
| A | 28529 | 205 | 0.718567% |
| B | 28529 | 594 | 2.082092% |
| C | 28529 | 481 | 1.686004% |
| D | 28530 | 2464 | 8.636523% |
Noise dominated data is calculated using 1-second bins in cleaned event files. If a bin has >2000 counts, and if more than 50% of those come from <1% of pixels, then it is considered to be noise-dominated and hence unusable.
| Quadrant | # 1 sec bins | Bins with >0 counts | Bins with >2000 counts | High rate bins dominated by noise | Noise dominated (total time) | Noise dominated (detector-on time) | Marked lightcurve |
|---|---|---|---|---|---|---|---|
| A | 32474 | 28532 | 44 | 44 | 0.14% | 0.15% | 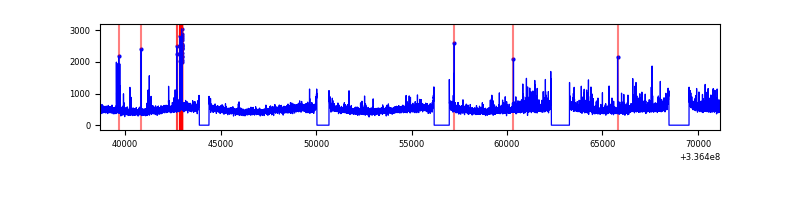 |
| B | 32474 | 28532 | 191 | 191 | 0.59% | 0.67% | 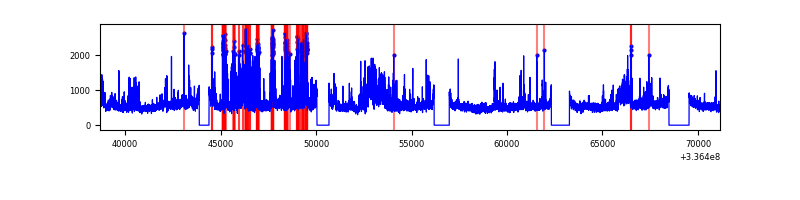 |
| C | 32474 | 28532 | 34 | 34 | 0.10% | 0.12% | 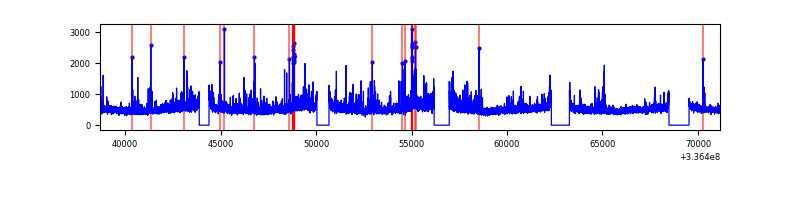 |
| D | 32475 | 28533 | 2063 | 2063 | 6.35% | 7.23% | 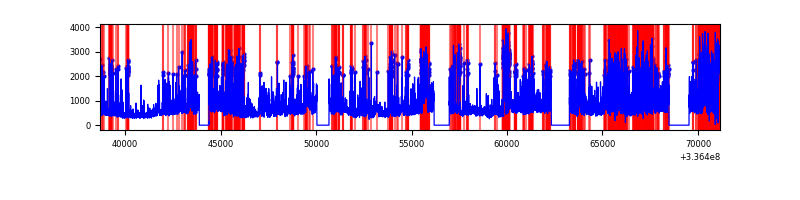 |
Top three noisy pixels from each quadrant. If the there are fewer than three noisy pixels in the level2.evt file, extra rows are filled as -1
| Pixel properties | Quadrant properties | ||||||
|---|---|---|---|---|---|---|---|
| Quadrant | DetID | PixID | Counts | Sigma | Mean | Median | Sigma |
| A | 0 | 13 | 777948 | 1085.51 | 3570 | 3504 | 713.4 |
| A | 13 | 254 | 47497 | 61.66 | 3570 | 3504 | 713.4 |
| A | 5 | 168 | 46389 | 60.11 | 3570 | 3504 | 713.4 |
| B | 0 | 189 | 4209278 | 6292.29 | 3538 | 3465 | 668.4 |
| B | 5 | 172 | 96391 | 139.03 | 3538 | 3465 | 668.4 |
| B | 12 | 111 | 80109 | 114.67 | 3538 | 3465 | 668.4 |
| C | 3 | 233 | 1396357 | 1750.83 | 3398 | 3437 | 795.6 |
| C | 14 | 238 | 544738 | 680.39 | 3398 | 3437 | 795.6 |
| C | 15 | 208 | 310371 | 385.8 | 3398 | 3437 | 795.6 |
| D | 1 | 52 | 7545386 | 9329.29 | 3310 | 3222 | 808.4 |
| D | 7 | 80 | 3327858 | 4112.41 | 3310 | 3222 | 808.4 |
| D | 2 | 250 | 1129233 | 1392.82 | 3310 | 3222 | 808.4 |
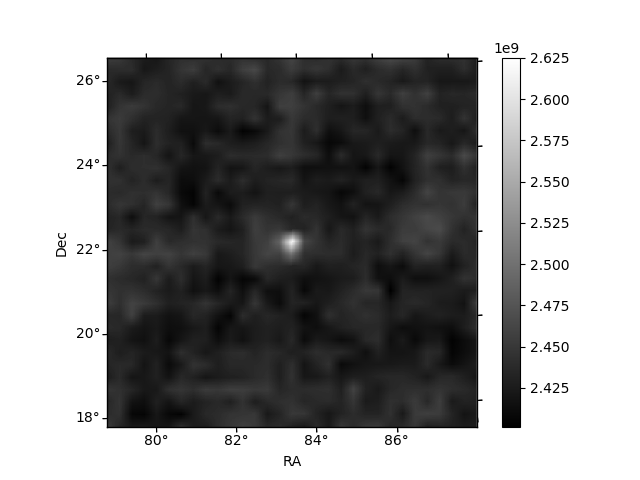
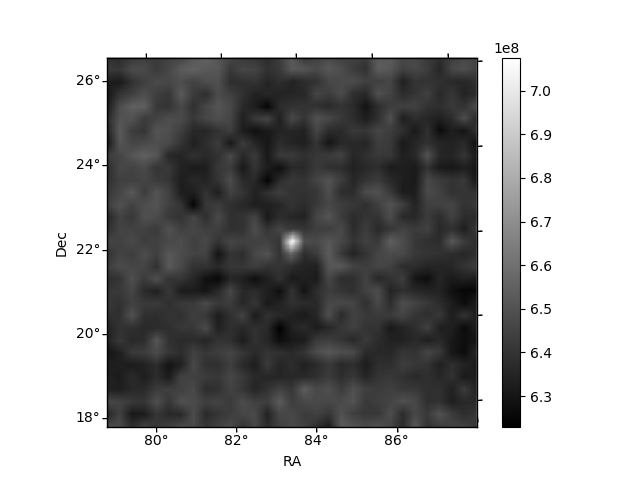
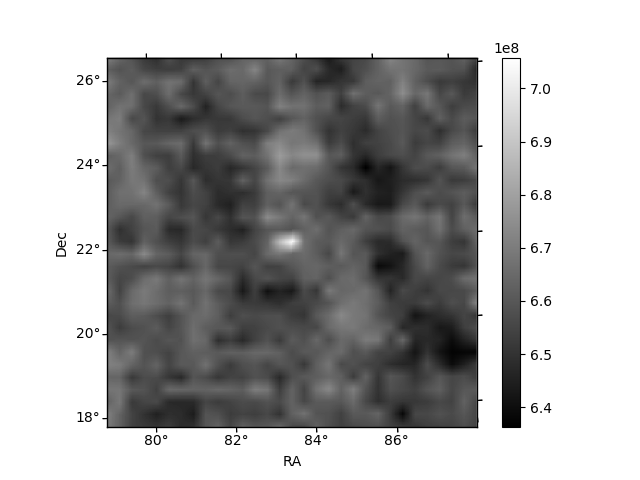
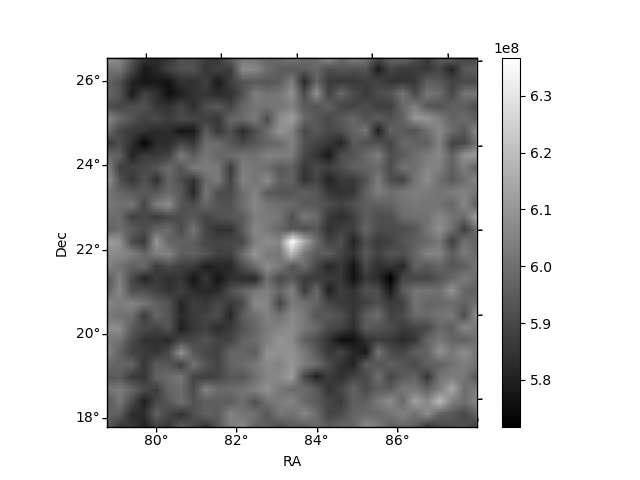
Histogram calculated using DETX and DETY for each event in the final _common_clean file
| Quadrant A | 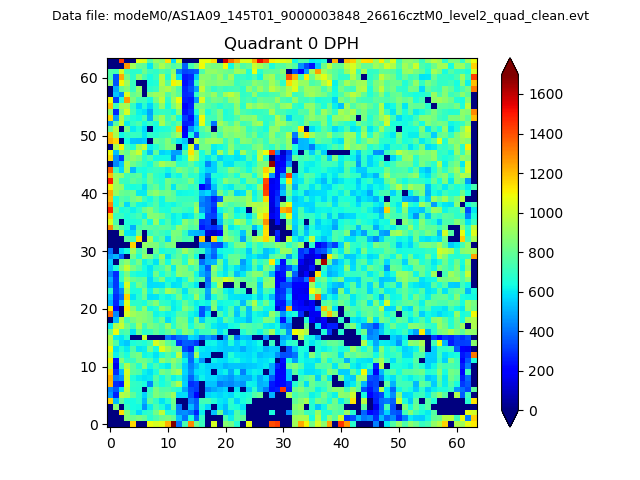 |
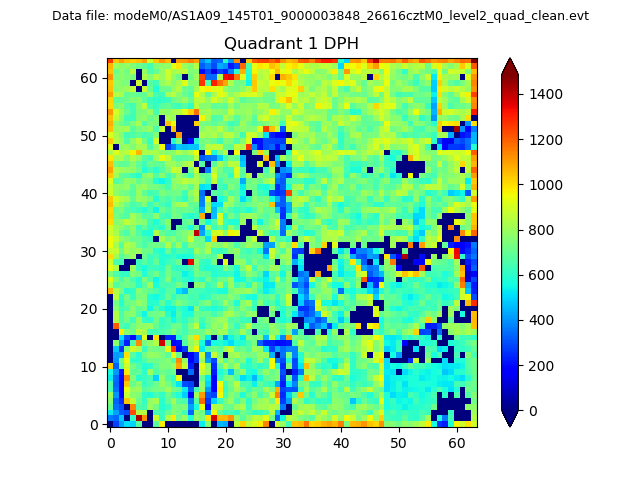 |
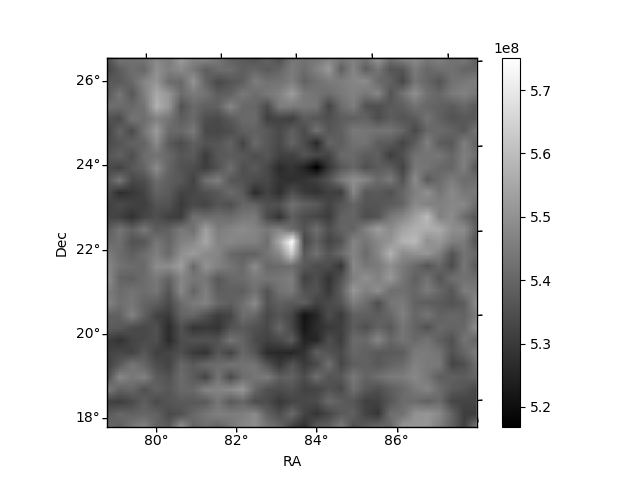
Quadrant B |
|---|---|---|---|
| Quadrant D |  |
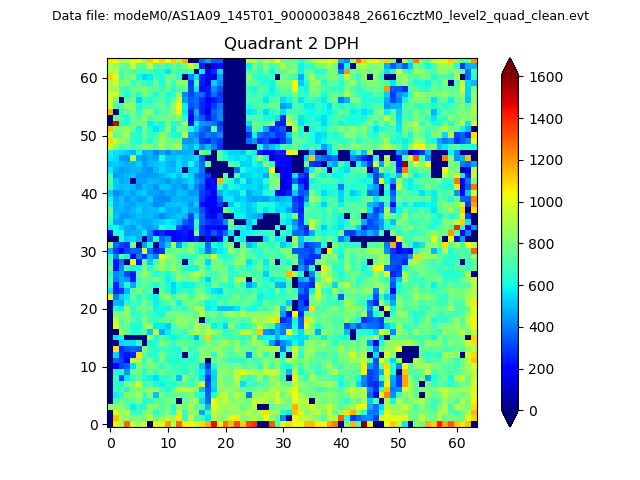 |
Quadrant C |
| Plot type | Count rate plots | Images |
|---|---|---|
| Comparison with Poisson distribution Blue bars denote a histogram of data divided into 1 sec bins. Red curve is a Poisson curve with rate = median count rate of data. |
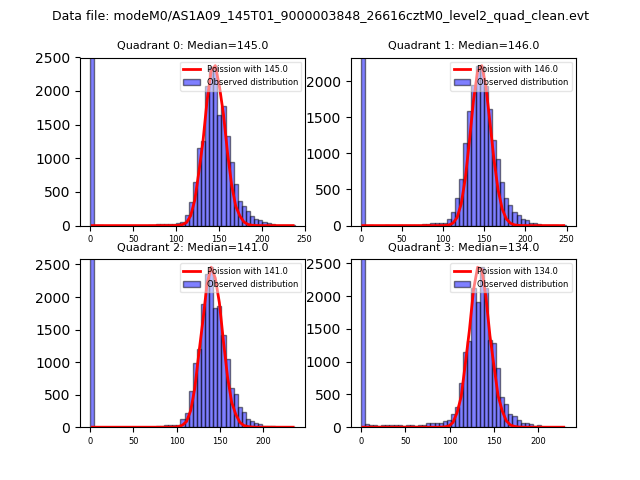 |
 |
| Quadrant-wise count rates Data is divided into 100 sec bins |
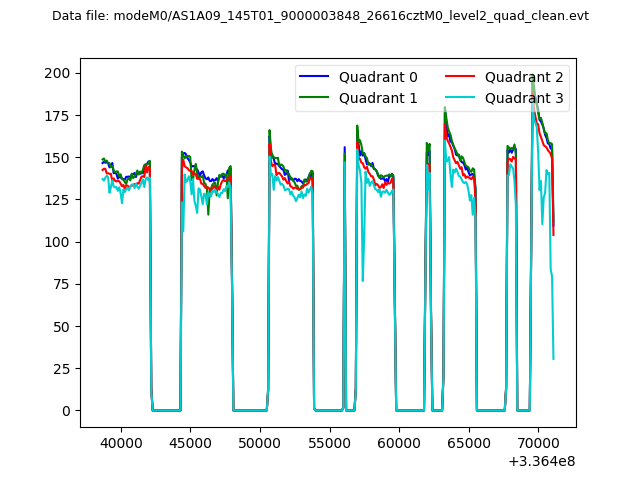 |
|
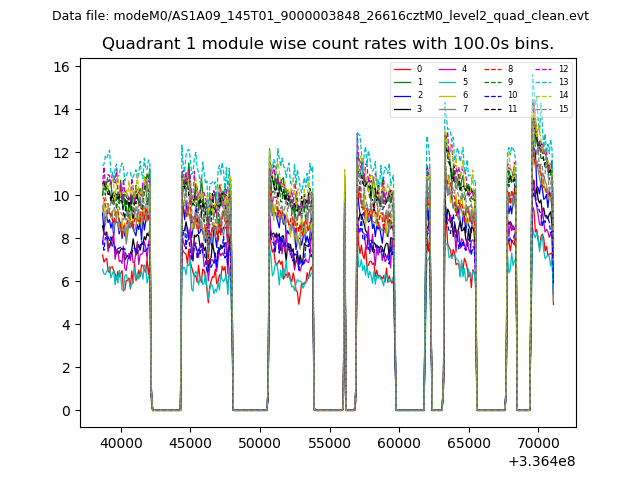
| Module-wise count rates for Quadrant A Data is divided into 100 sec bins |
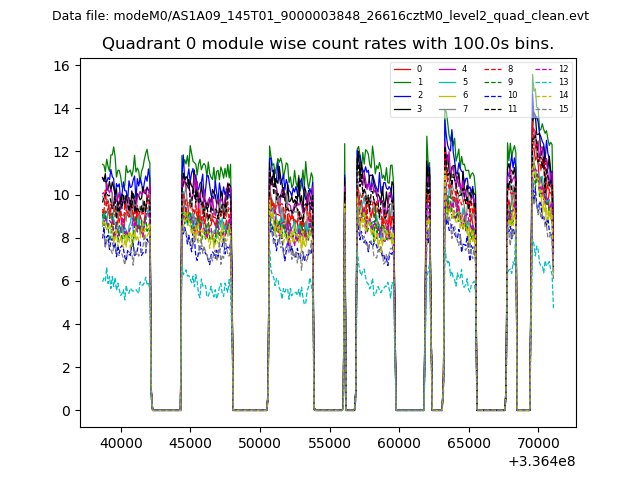 |
 |
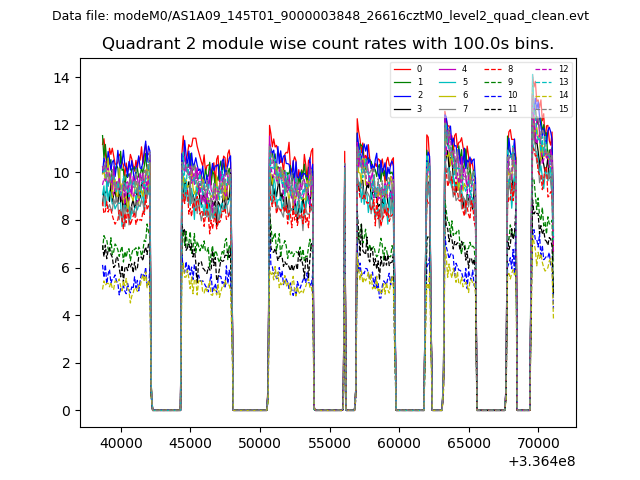
| Module-wise count rates for Quadrant B Data is divided into 100 sec bins |
 |
 |
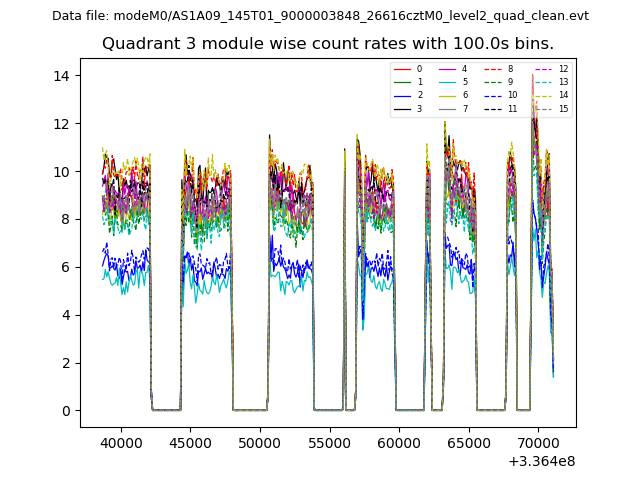
| Module-wise count rates for Quadrant C Data is divided into 100 sec bins |
 |
 |
| Module-wise count rates for Quadrant D Data is divided into 100 sec bins |
 |
 |
| Parameter | Plot |
|---|---|
| CZT HV Monitor | 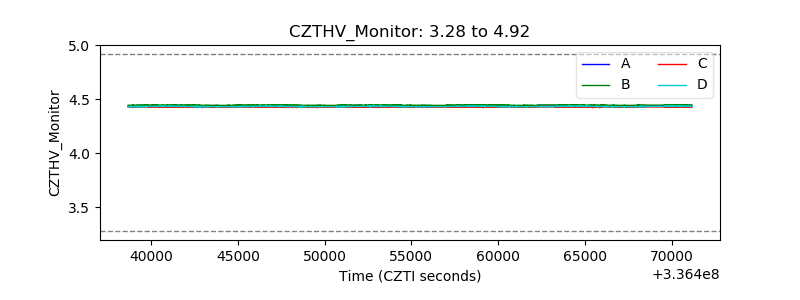 |
| D_VDD | 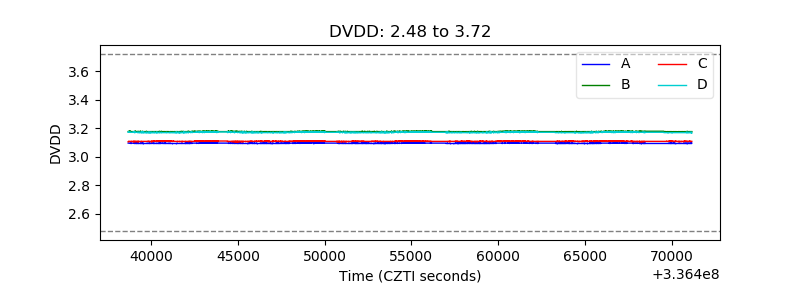 |
| Temperature 1 | 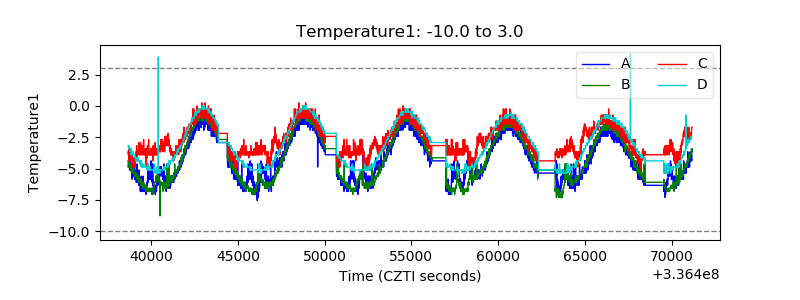 |
| Veto HV Monitor | 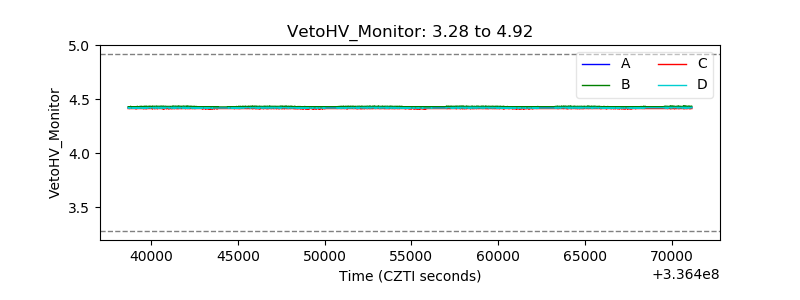 |
| Veto LLD | 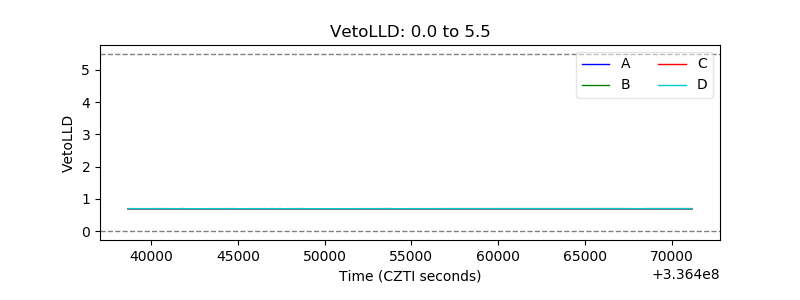 |
| Alpha Counter | 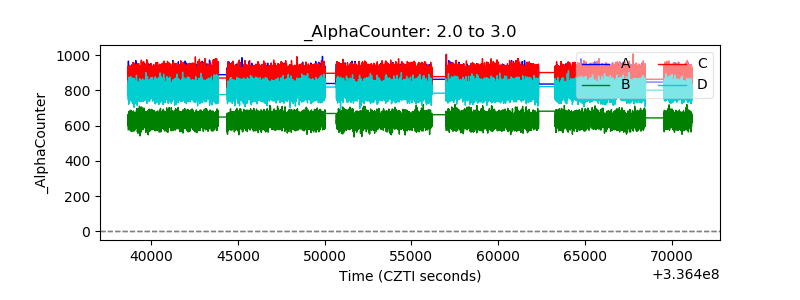 |
| _CPM_Rate | 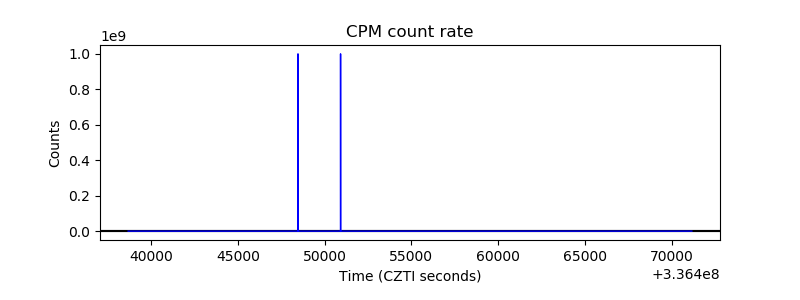 |
| CZT Counter | 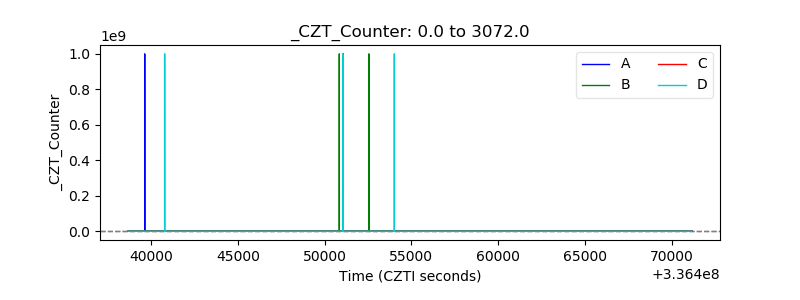 |
| +2.5 Volts monitor |  |
| +5 Volts monitor |  |
| _ROLL_ROT | 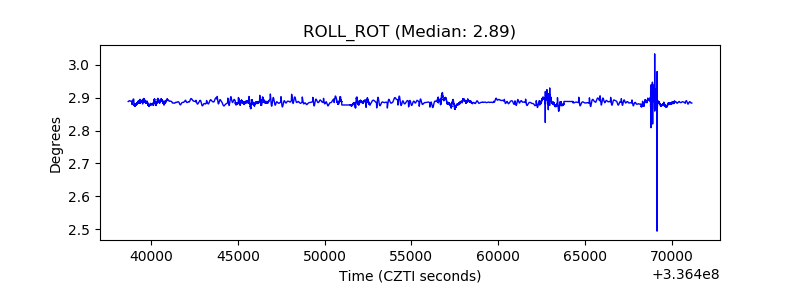 |
| _Roll_DEC | 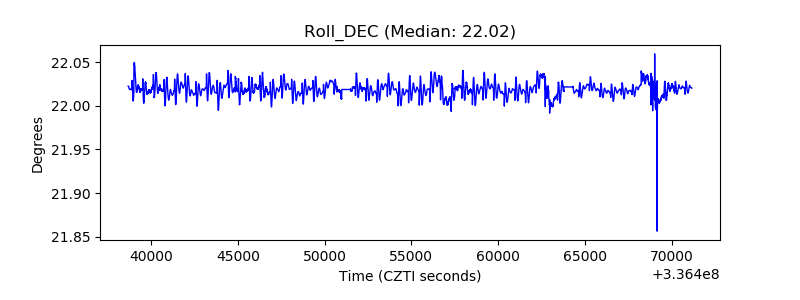 |
| _Roll_RA | 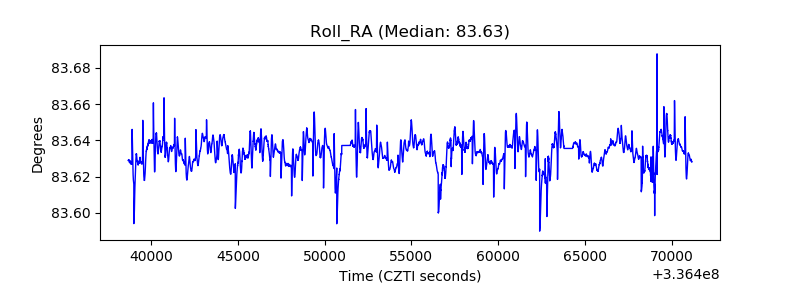 |
| Veto Counter | 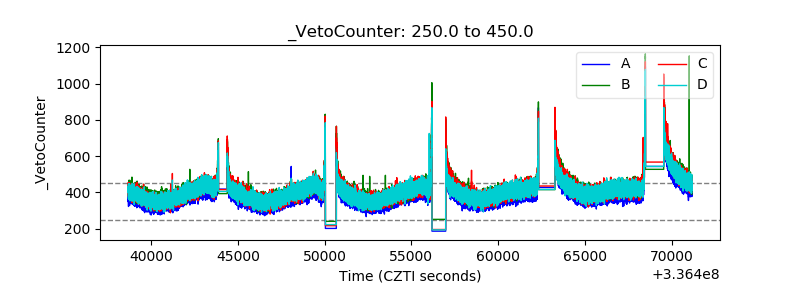 |