| Param | Original file | Final file |
|---|---|---|
| Filename | modeM0/AS1A09_145T01_9000003848_26617cztM0_level2.evt | modeM0/AS1A09_145T01_9000003848_26617cztM0_level2_quad_clean.evt |
| Size (bytes) | 584,380,800 | 83,004,480 |
| Size | 557.3 MB | 79.2 MB |
| Events in quadrant A | 3,008,626 | 559,997 |
| Events in quadrant B | 3,544,765 | 562,688 |
| Events in quadrant C | 2,863,923 | 536,855 |
| Events in quadrant D | 7,909,400 | 470,044 |
| Mode M0 | |||
|---|---|---|---|
| Quadrant | BADHDUFLAG | Total packets | Discarded packets |
| A | 0 | 12126 | 0 |
| B | 0 | 14357 | 0 |
| C | 0 | 11685 | 0 |
| D | 0 | 27356 | 0 |
| Mode M9 | |||
|---|---|---|---|
| Quadrant | BADHDUFLAG | Total packets | Discarded packets |
| A | 0 | 12 | 0 |
| B | 0 | 12 | 0 |
| C | 0 | 12 | 0 |
| D | 0 | 12 | 0 |
| Quadrant | Total seconds | Saturated seconds | Saturation percentage |
|---|---|---|---|
| A | 5482 | 34 | 0.620212% |
| B | 5482 | 89 | 1.623495% |
| C | 5483 | 50 | 0.911910% |
| D | 5483 | 1866 | 34.032464% |
Noise dominated data is calculated using 1-second bins in cleaned event files. If a bin has >2000 counts, and if more than 50% of those come from <1% of pixels, then it is considered to be noise-dominated and hence unusable.
| Quadrant | # 1 sec bins | Bins with >0 counts | Bins with >2000 counts | High rate bins dominated by noise | Noise dominated (total time) | Noise dominated (detector-on time) | Marked lightcurve |
|---|---|---|---|---|---|---|---|
| A | 6692 | 5483 | 0 | 0 | 0.00% | 0.00% | 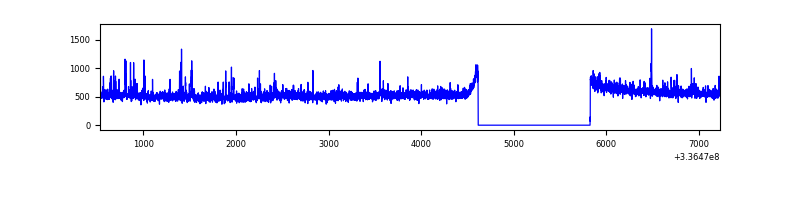 |
| B | 6692 | 5483 | 13 | 13 | 0.19% | 0.24% | 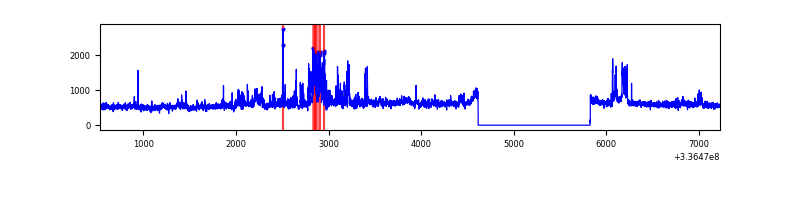 |
| C | 6693 | 5484 | 0 | 0 | 0.00% | 0.00% | 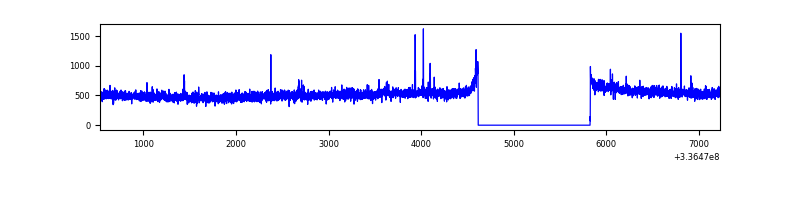 |
| D | 6693 | 5484 | 1694 | 1694 | 25.31% | 30.89% | 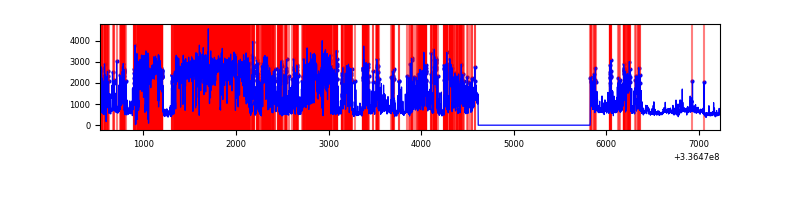 |
Top three noisy pixels from each quadrant. If the there are fewer than three noisy pixels in the level2.evt file, extra rows are filled as -1
| Pixel properties | Quadrant properties | ||||||
|---|---|---|---|---|---|---|---|
| Quadrant | DetID | PixID | Counts | Sigma | Mean | Median | Sigma |
| A | 0 | 13 | 143533 | 958.1 | 739 | 728 | 149.0 |
| A | 5 | 168 | 17266 | 110.96 | 739 | 728 | 149.0 |
| A | 13 | 254 | 9019 | 55.63 | 739 | 728 | 149.0 |
| B | 0 | 189 | 657338 | 4828.39 | 722 | 708 | 136.0 |
| B | 5 | 172 | 18049 | 127.51 | 722 | 708 | 136.0 |
| B | 12 | 111 | 15874 | 111.52 | 722 | 708 | 136.0 |
| C | 14 | 238 | 114142 | 699.88 | 695 | 702 | 162.1 |
| C | 3 | 233 | 21646 | 129.22 | 695 | 702 | 162.1 |
| C | 15 | 208 | 15049 | 88.52 | 695 | 702 | 162.1 |
| D | 1 | 52 | 3716170 | 25570.04 | 591 | 575 | 145.3 |
| D | 7 | 80 | 1680188 | 11558.78 | 591 | 575 | 145.3 |
| D | 2 | 250 | 217700 | 1494.21 | 591 | 575 | 145.3 |
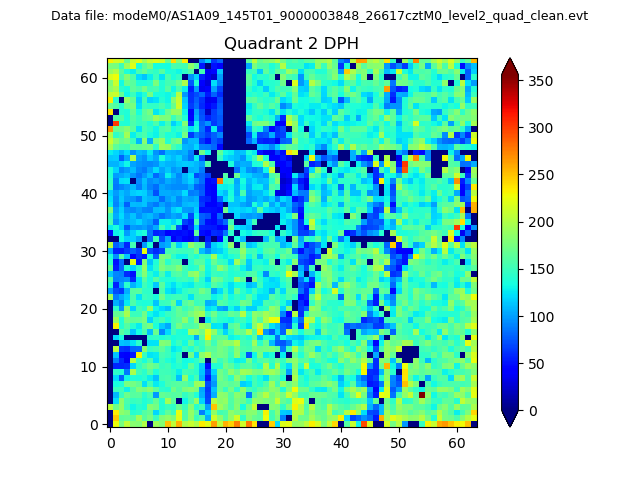
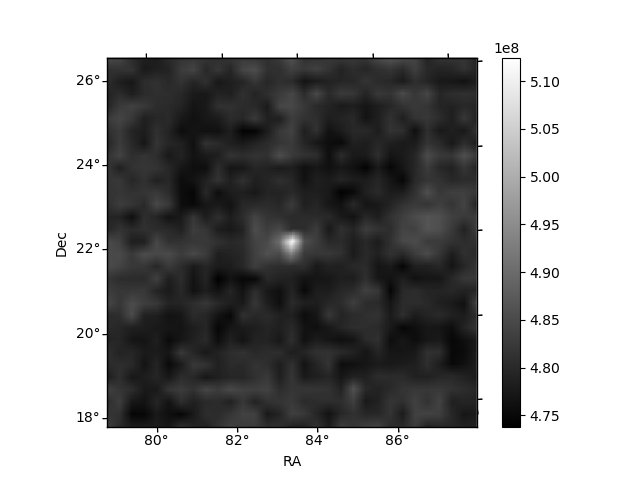
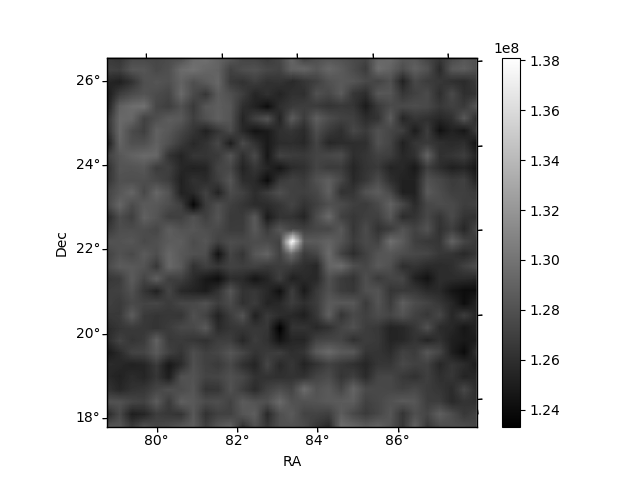
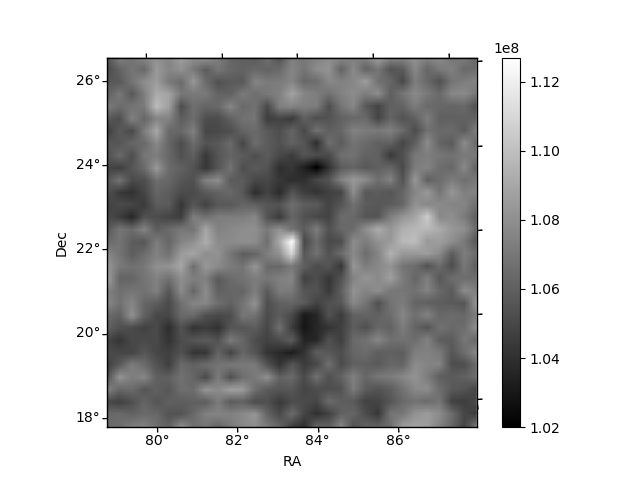
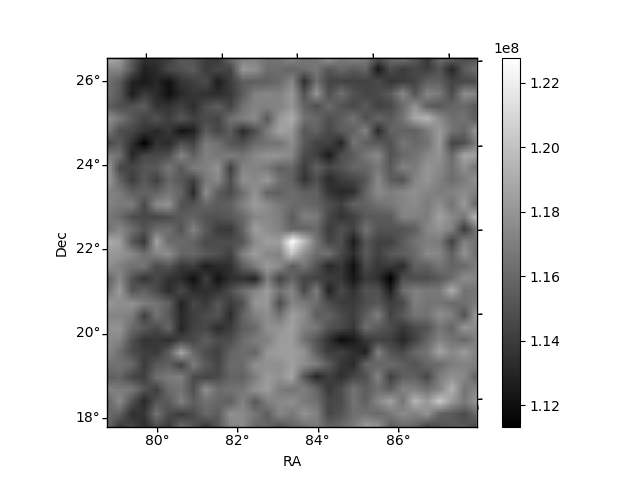
Histogram calculated using DETX and DETY for each event in the final _common_clean file
| Quadrant A | 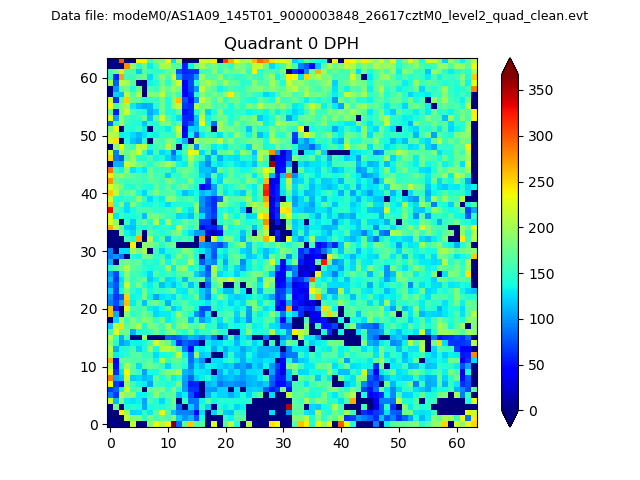 |
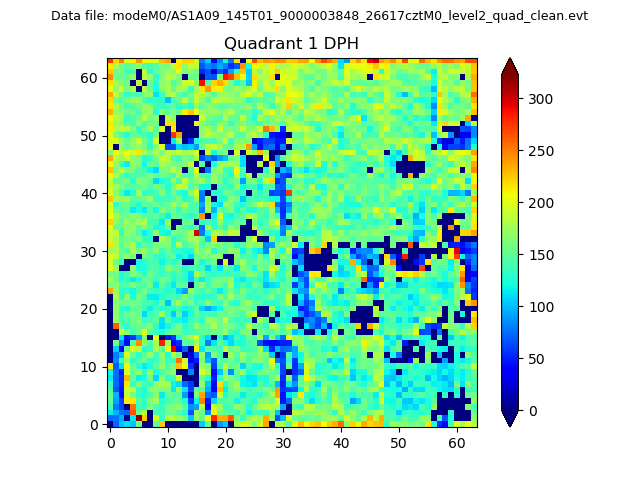 |
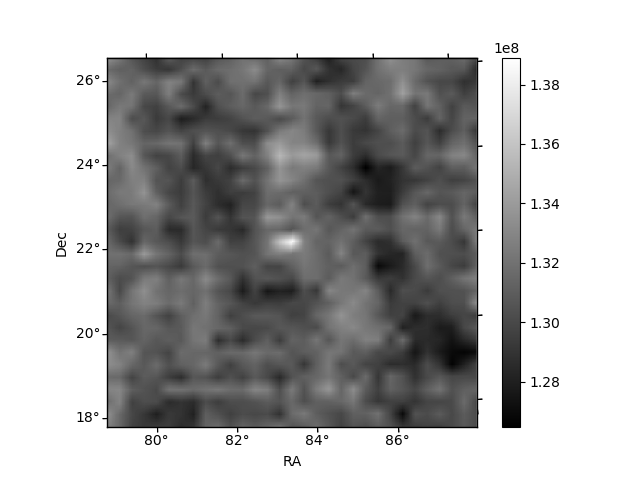
Quadrant B |
|---|---|---|---|
| Quadrant D | 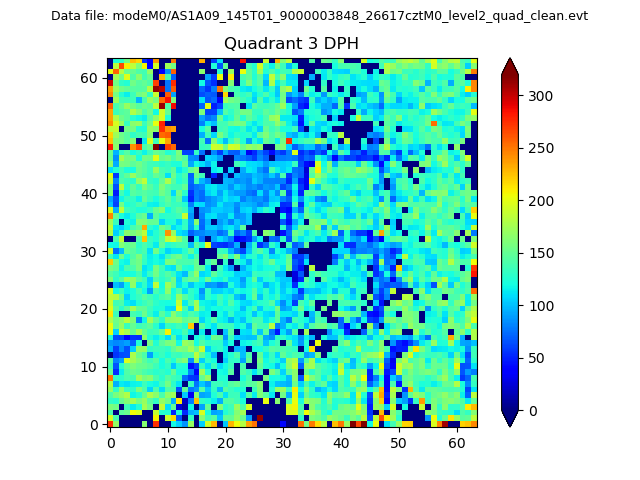 |
 |
Quadrant C |
| Plot type | Count rate plots | Images |
|---|---|---|
| Comparison with Poisson distribution Blue bars denote a histogram of data divided into 1 sec bins. Red curve is a Poisson curve with rate = median count rate of data. |
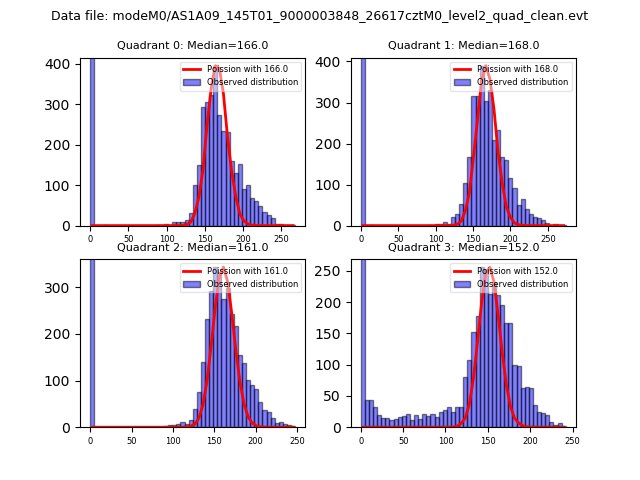 |
 |
| Quadrant-wise count rates Data is divided into 100 sec bins |
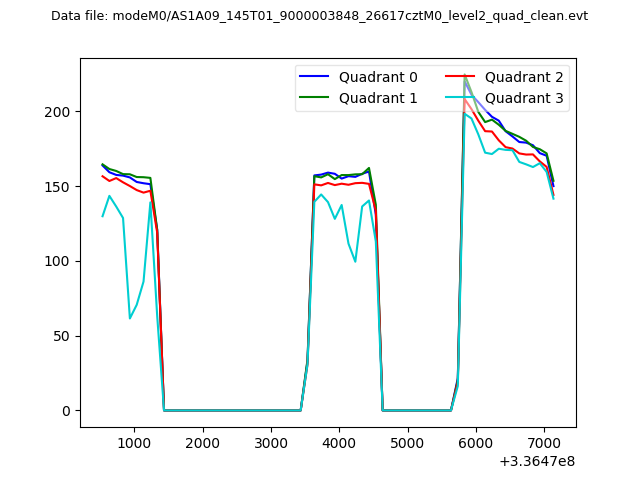 |
|
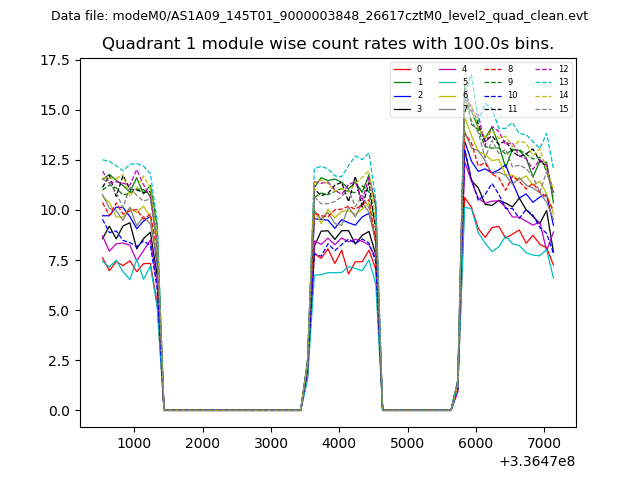
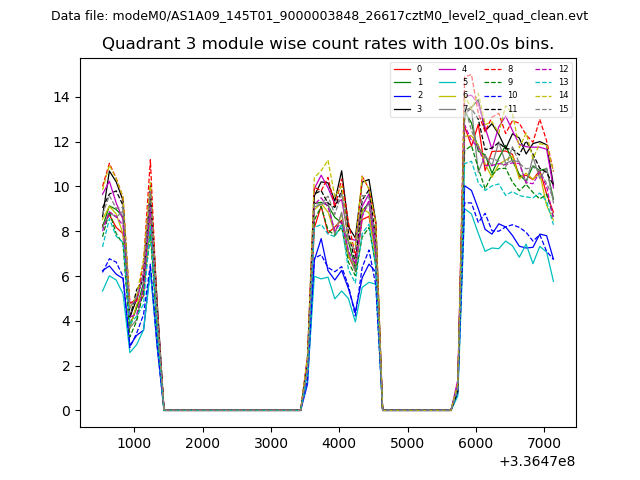
| Module-wise count rates for Quadrant A Data is divided into 100 sec bins |
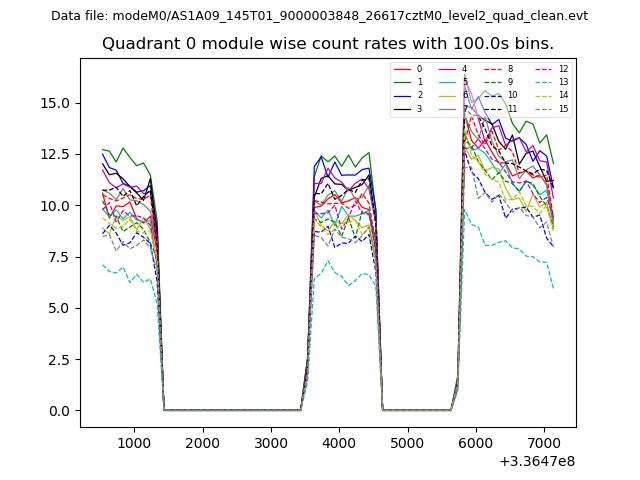 |
 |
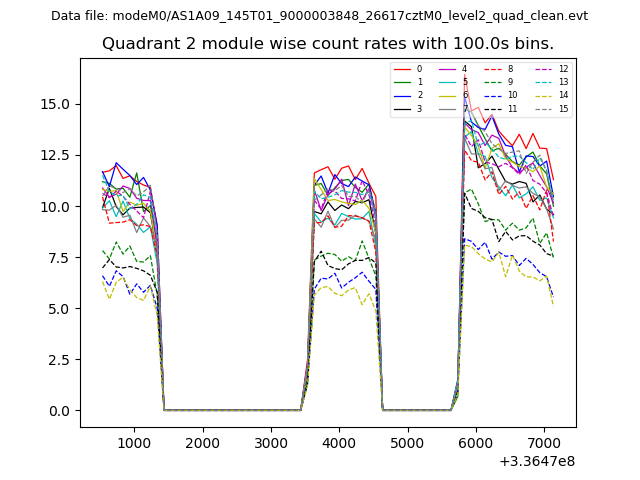
| Module-wise count rates for Quadrant B Data is divided into 100 sec bins |
 |
 |
| Module-wise count rates for Quadrant C Data is divided into 100 sec bins |
 |
 |
| Module-wise count rates for Quadrant D Data is divided into 100 sec bins |
 |
 |
| Parameter | Plot |
|---|---|
| CZT HV Monitor | 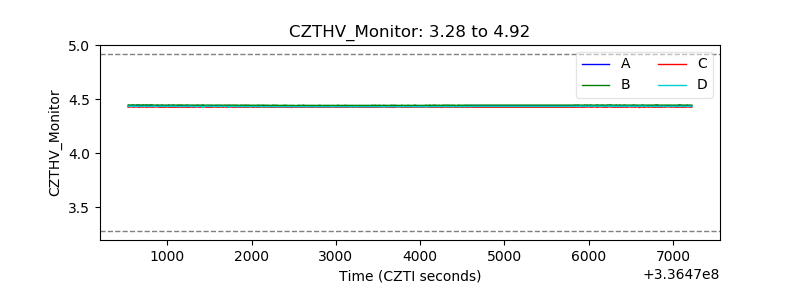 |
| D_VDD | 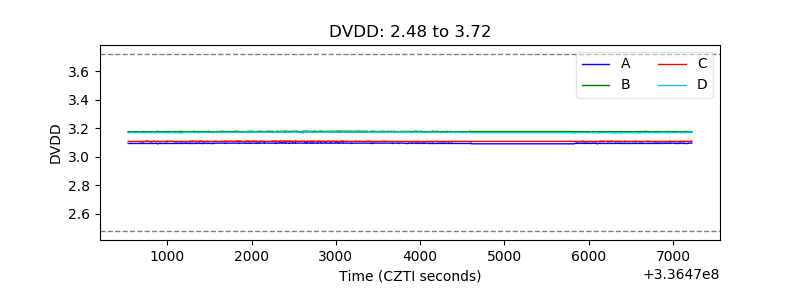 |
| Temperature 1 | 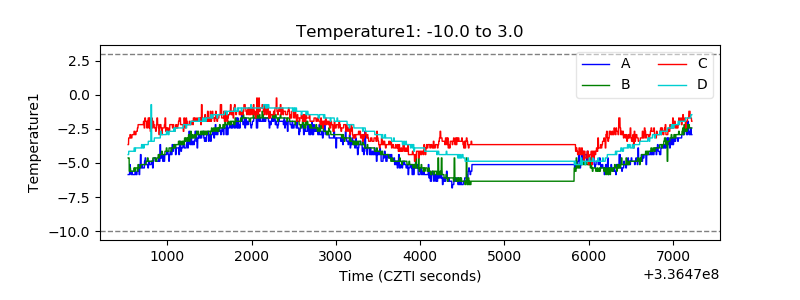 |
| Veto HV Monitor | 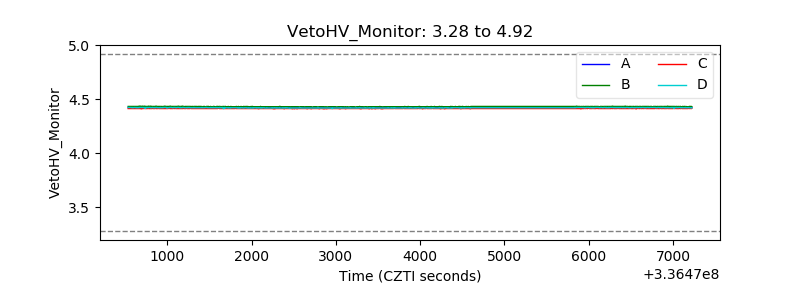 |
| Veto LLD | 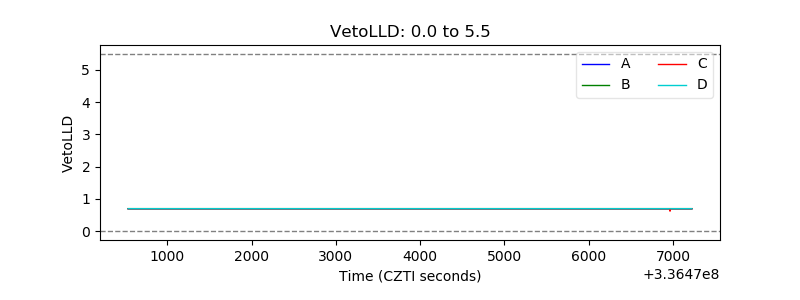 |
| Alpha Counter | 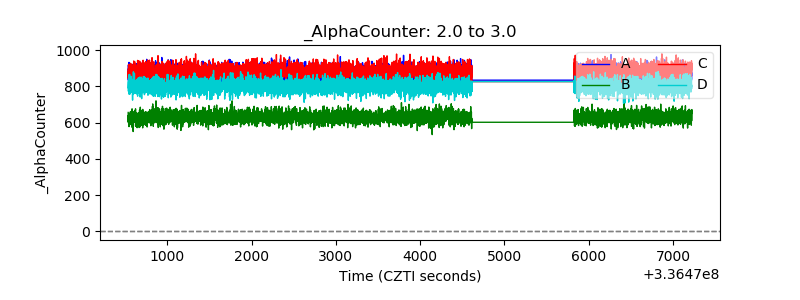 |
| _CPM_Rate | 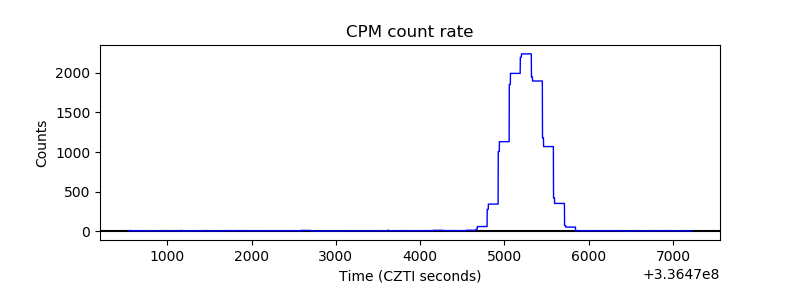 |
| CZT Counter | 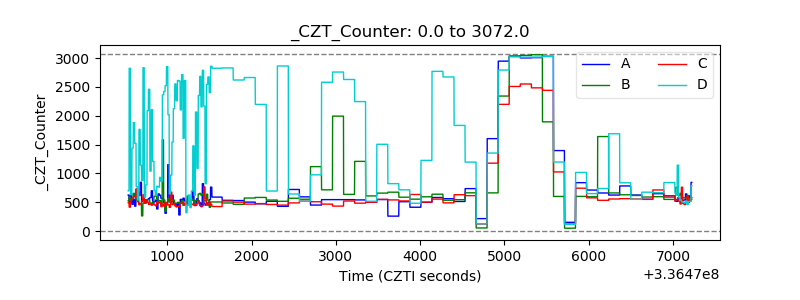 |
| +2.5 Volts monitor | 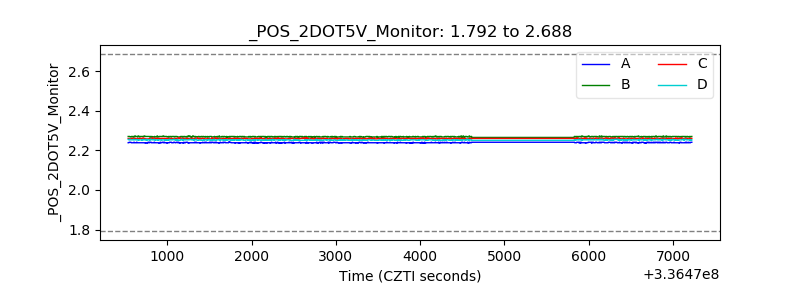 |
| +5 Volts monitor |  |
| _ROLL_ROT | 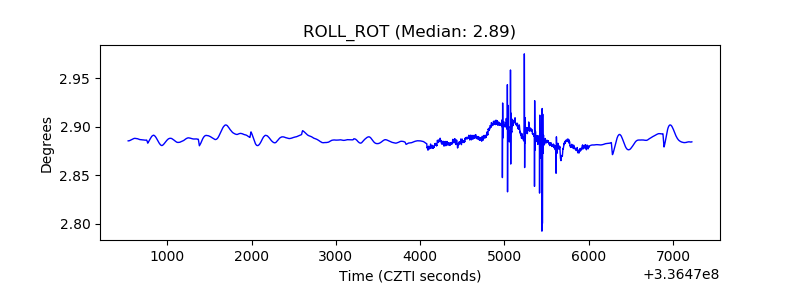 |
| _Roll_DEC | 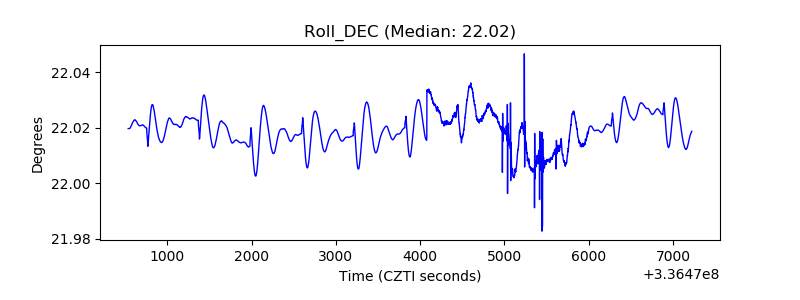 |
| _Roll_RA | 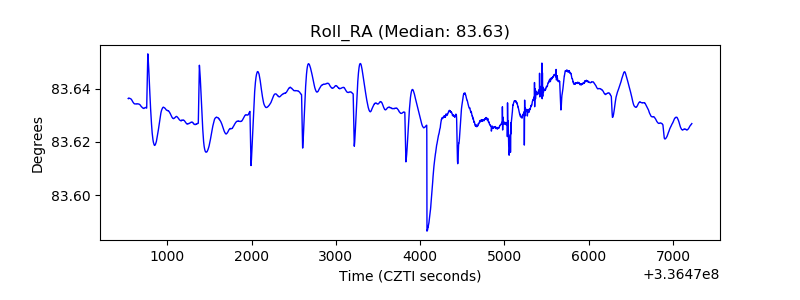 |
| Veto Counter | 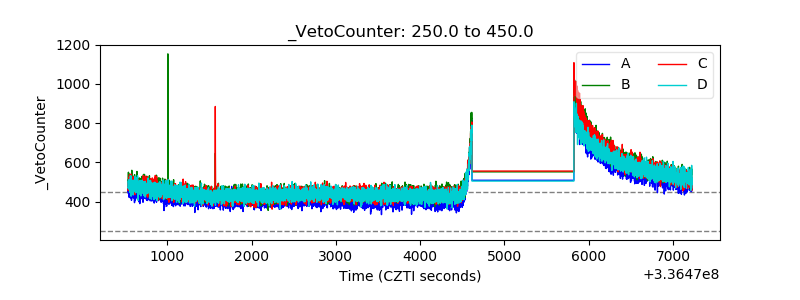 |