| Param | Original file | Final file |
|---|---|---|
| Filename | modeM0/AS1A09_145T01_9000003848_26618cztM0_level2.evt | modeM0/AS1A09_145T01_9000003848_26618cztM0_level2_quad_clean.evt |
| Size (bytes) | 558,253,440 | 84,104,640 |
| Size | 532.4 MB | 80.2 MB |
| Events in quadrant A | 3,242,584 | 573,172 |
| Events in quadrant B | 3,559,005 | 574,505 |
| Events in quadrant C | 3,117,337 | 545,146 |
| Events in quadrant D | 6,605,115 | 458,963 |
| Mode M0 | |||
|---|---|---|---|
| Quadrant | BADHDUFLAG | Total packets | Discarded packets |
| A | 0 | 13047 | 0 |
| B | 0 | 14693 | 0 |
| C | 0 | 12597 | 0 |
| D | 0 | 23459 | 0 |
| Mode M9 | |||
|---|---|---|---|
| Quadrant | BADHDUFLAG | Total packets | Discarded packets |
| A | 0 | 13 | 0 |
| B | 0 | 13 | 0 |
| C | 0 | 13 | 0 |
| D | 0 | 13 | 0 |
| Quadrant | Total seconds | Saturated seconds | Saturation percentage |
|---|---|---|---|
| A | 5642 | 42 | 0.744417% |
| B | 5643 | 48 | 0.850611% |
| C | 5643 | 60 | 1.063264% |
| D | 5642 | 1717 | 30.432471% |
Noise dominated data is calculated using 1-second bins in cleaned event files. If a bin has >2000 counts, and if more than 50% of those come from <1% of pixels, then it is considered to be noise-dominated and hence unusable.
| Quadrant | # 1 sec bins | Bins with >0 counts | Bins with >2000 counts | High rate bins dominated by noise | Noise dominated (total time) | Noise dominated (detector-on time) | Marked lightcurve |
|---|---|---|---|---|---|---|---|
| A | 6932 | 5643 | 0 | 0 | 0.00% | 0.00% | 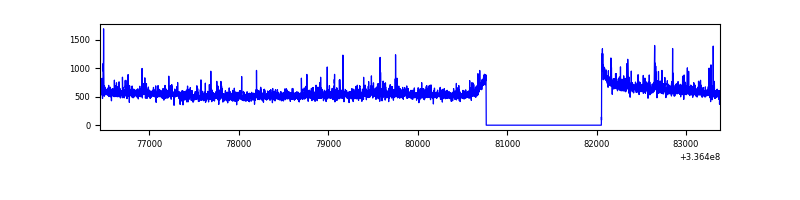 |
| B | 6933 | 5644 | 2 | 2 | 0.03% | 0.04% | 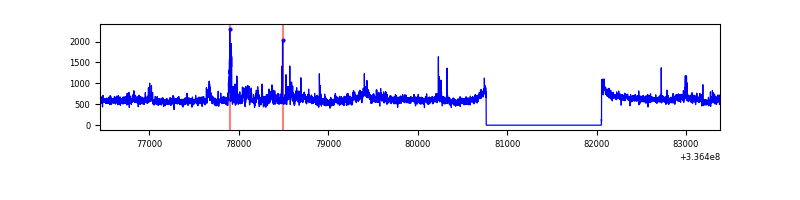 |
| C | 6933 | 5644 | 2 | 2 | 0.03% | 0.04% | 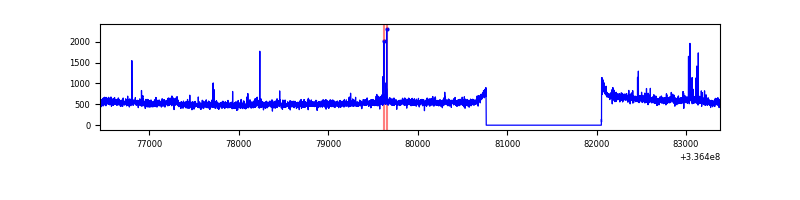 |
| D | 6932 | 5643 | 1035 | 1035 | 14.93% | 18.34% | 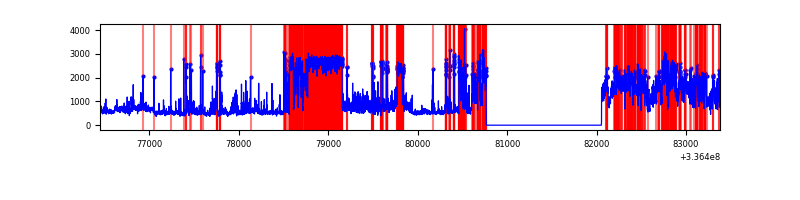 |
Top three noisy pixels from each quadrant. If the there are fewer than three noisy pixels in the level2.evt file, extra rows are filled as -1
| Pixel properties | Quadrant properties | ||||||
|---|---|---|---|---|---|---|---|
| Quadrant | DetID | PixID | Counts | Sigma | Mean | Median | Sigma |
| A | 0 | 13 | 151088 | 939.24 | 799 | 788 | 160.0 |
| A | 5 | 168 | 16268 | 96.74 | 799 | 788 | 160.0 |
| A | 13 | 254 | 9047 | 51.61 | 799 | 788 | 160.0 |
| B | 0 | 189 | 406503 | 2792.32 | 778 | 762 | 145.3 |
| B | 5 | 172 | 49307 | 334.09 | 778 | 762 | 145.3 |
| B | 15 | 33 | 31000 | 208.1 | 778 | 762 | 145.3 |
| C | 14 | 238 | 121876 | 698.14 | 749 | 756 | 173.5 |
| C | 3 | 233 | 38687 | 218.63 | 749 | 756 | 173.5 |
| C | 15 | 208 | 36710 | 207.24 | 749 | 756 | 173.5 |
| D | 7 | 80 | 3257513 | 20907.03 | 640 | 626 | 155.8 |
| D | 1 | 52 | 808468 | 5185.8 | 640 | 626 | 155.8 |
| D | 2 | 250 | 54019 | 342.75 | 640 | 626 | 155.8 |
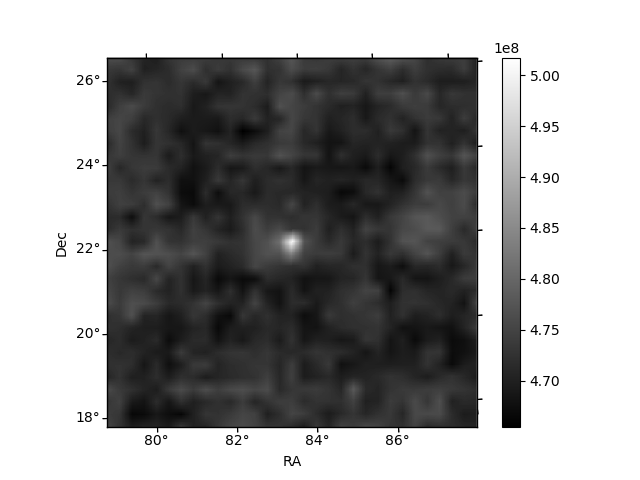
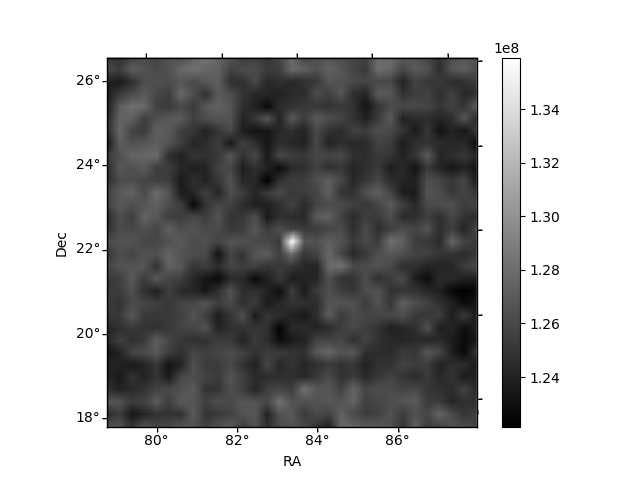
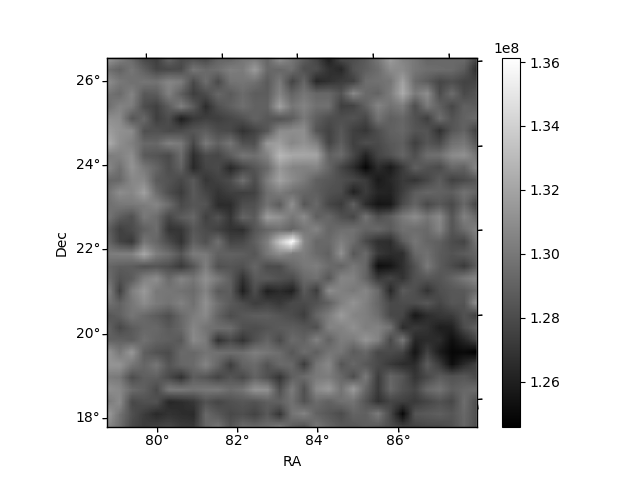
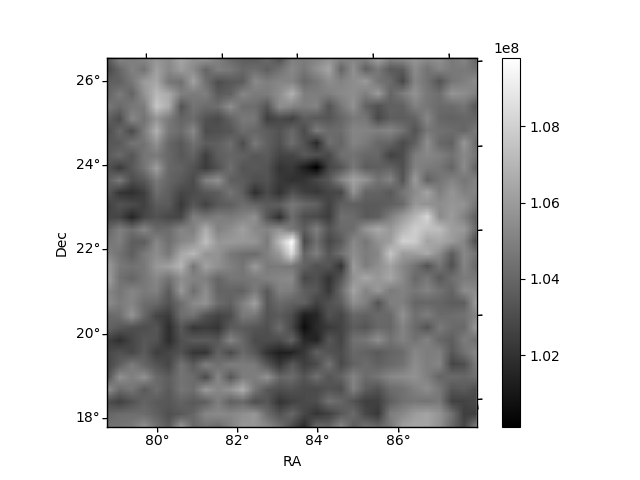
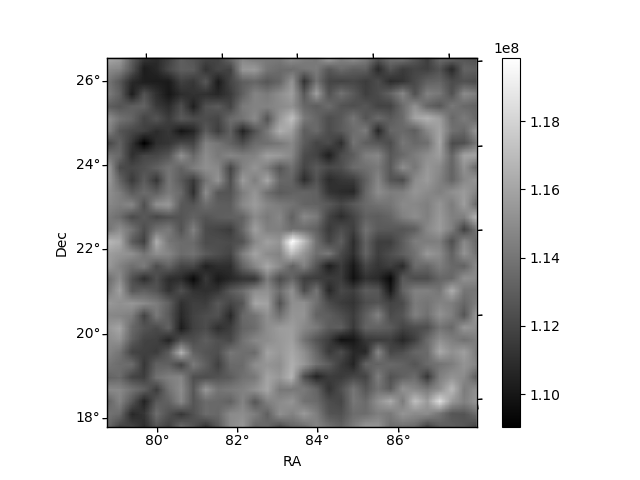
Histogram calculated using DETX and DETY for each event in the final _common_clean file
| Quadrant A | 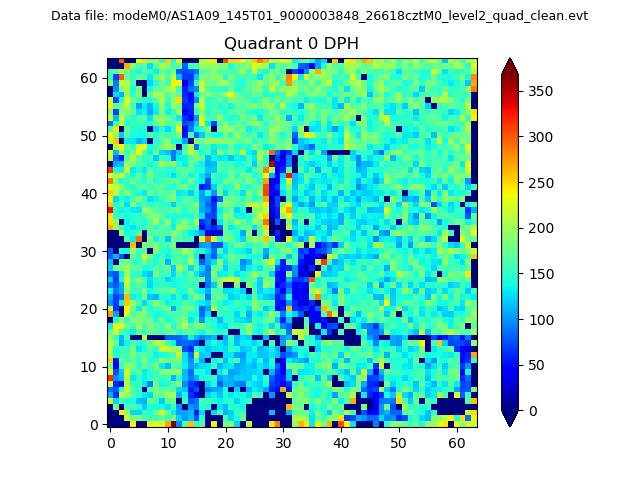 |
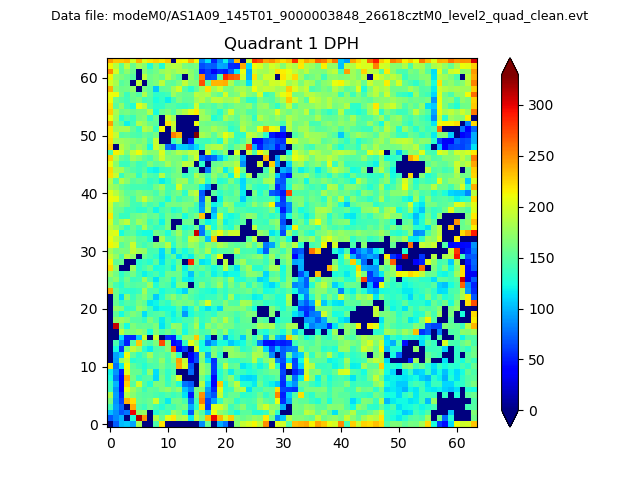 |
Quadrant B |
|---|---|---|---|
| Quadrant D | 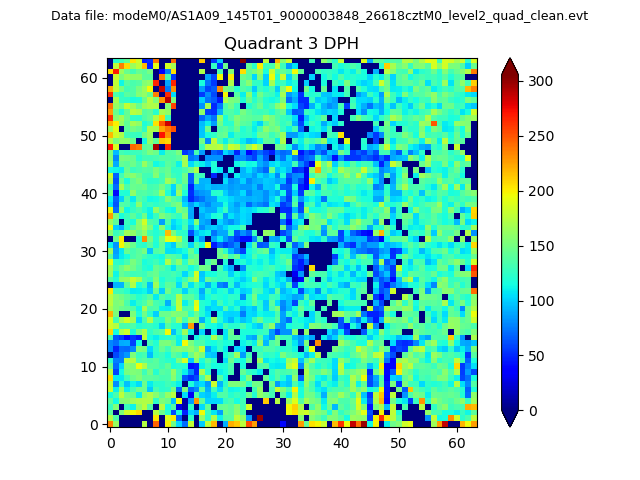 |
 |
Quadrant C |
| Plot type | Count rate plots | Images |
|---|---|---|
| Comparison with Poisson distribution Blue bars denote a histogram of data divided into 1 sec bins. Red curve is a Poisson curve with rate = median count rate of data. |
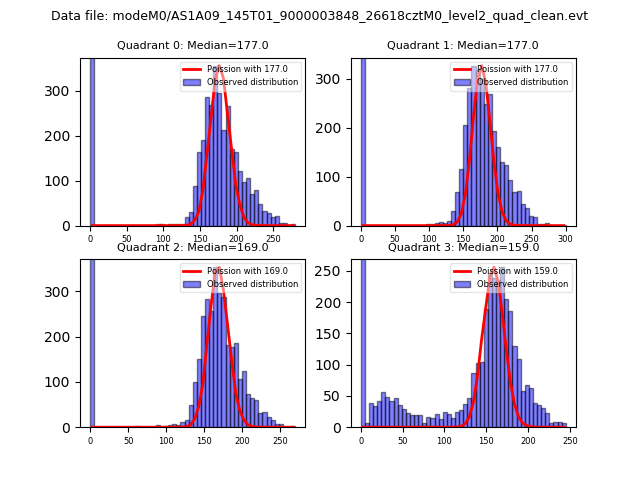 |
 |
| Quadrant-wise count rates Data is divided into 100 sec bins |
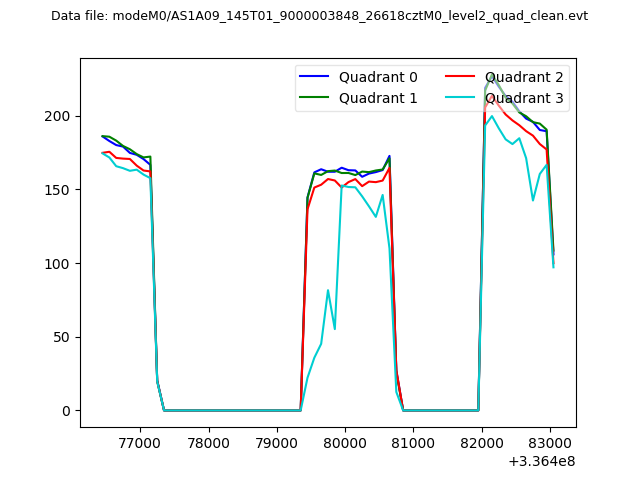 |
|
| Module-wise count rates for Quadrant A Data is divided into 100 sec bins |
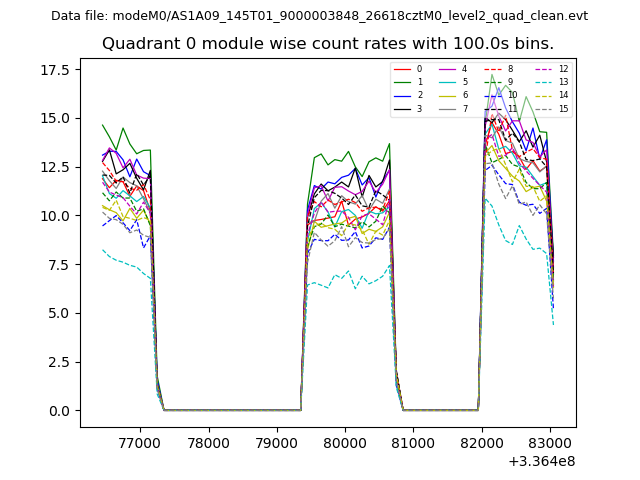 |
 |
| Module-wise count rates for Quadrant B Data is divided into 100 sec bins |
 |
 |
| Module-wise count rates for Quadrant C Data is divided into 100 sec bins |
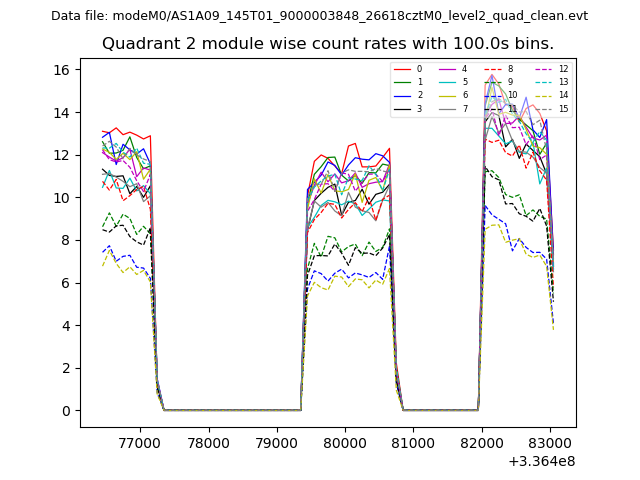 |
 |
| Module-wise count rates for Quadrant D Data is divided into 100 sec bins |
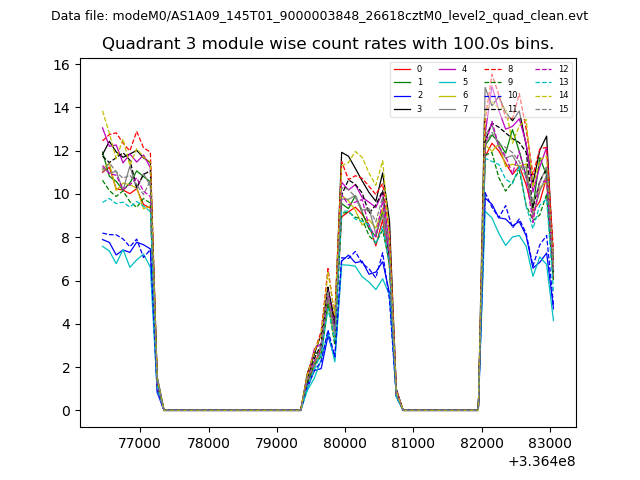 |
 |
| Parameter | Plot |
|---|---|
| CZT HV Monitor |  |
| D_VDD | 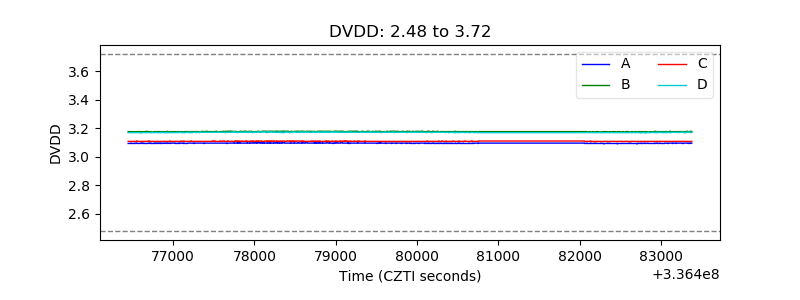 |
| Temperature 1 | 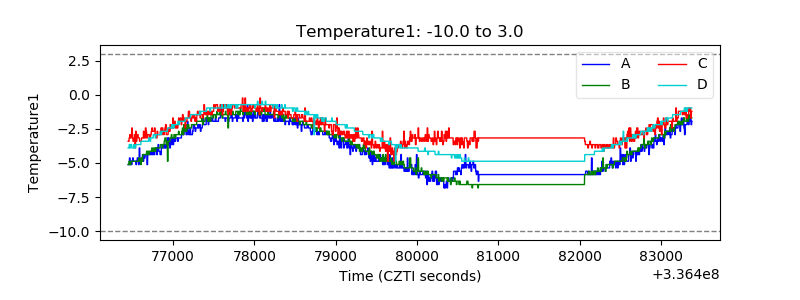 |
| Veto HV Monitor | 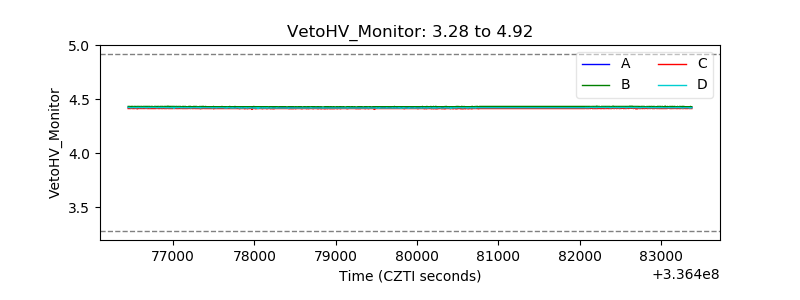 |
| Veto LLD |  |
| Alpha Counter |  |
| _CPM_Rate | 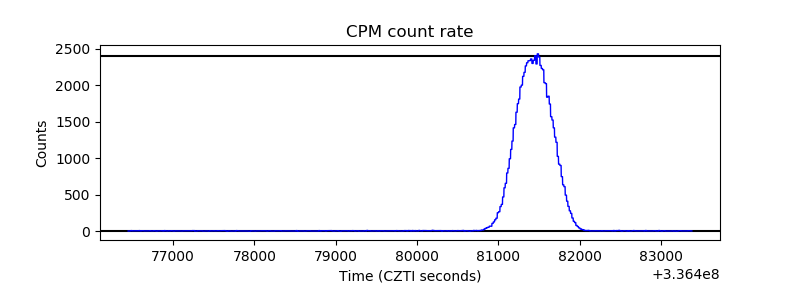 |
| CZT Counter | 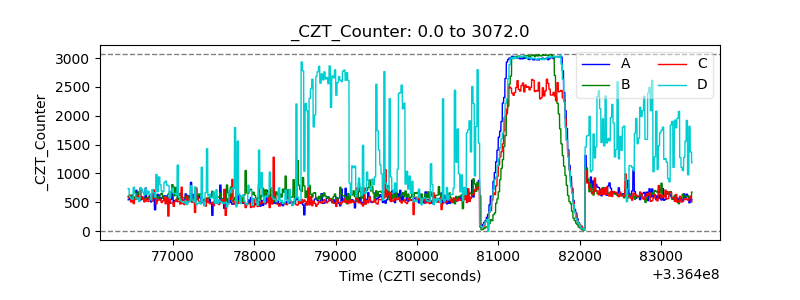 |
| +2.5 Volts monitor | 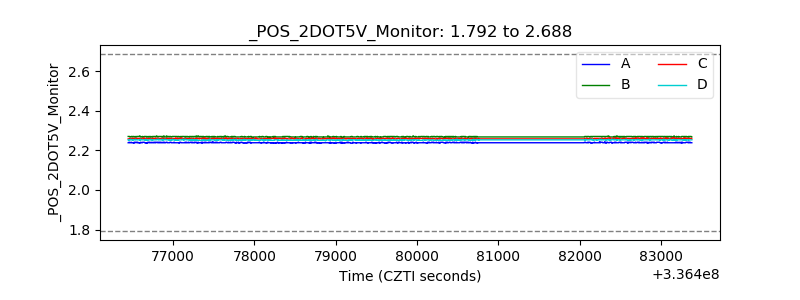 |
| +5 Volts monitor |  |
| _ROLL_ROT | 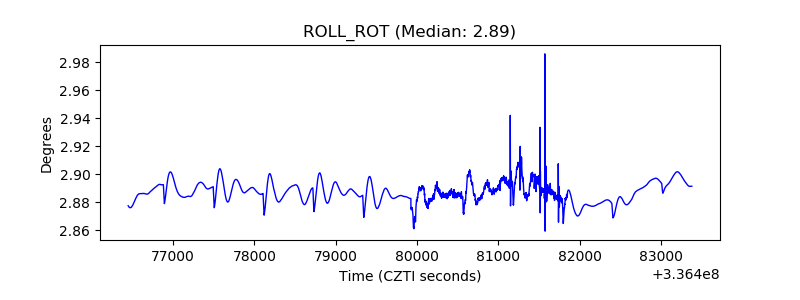 |
| _Roll_DEC |  |
| _Roll_RA | 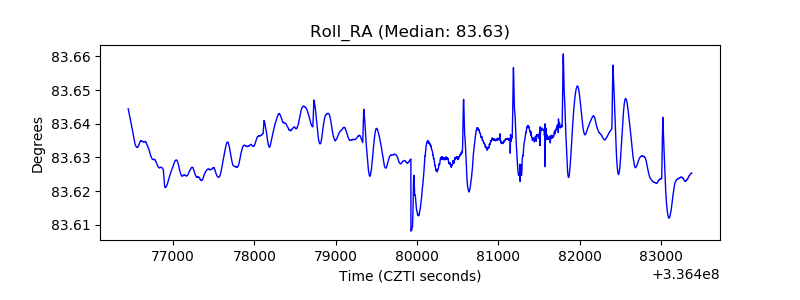 |
| Veto Counter |  |