| Param | Original file | Final file |
|---|---|---|
| Filename | modeM0/AS1A09_145T01_9000003848_26619cztM0_level2.evt | modeM0/AS1A09_145T01_9000003848_26619cztM0_level2_quad_clean.evt |
| Size (bytes) | 550,563,840 | 76,443,840 |
| Size | 525.1 MB | 72.9 MB |
| Events in quadrant A | 3,254,803 | 507,335 |
| Events in quadrant B | 3,557,633 | 508,880 |
| Events in quadrant C | 3,169,885 | 483,963 |
| Events in quadrant D | 6,314,036 | 424,066 |
| Mode M0 | |||
|---|---|---|---|
| Quadrant | BADHDUFLAG | Total packets | Discarded packets |
| A | 0 | 13119 | 0 |
| B | 0 | 14893 | 0 |
| C | 0 | 12749 | 0 |
| D | 0 | 22530 | 0 |
| Mode M9 | |||
|---|---|---|---|
| Quadrant | BADHDUFLAG | Total packets | Discarded packets |
| A | 0 | 14 | 0 |
| B | 0 | 14 | 0 |
| C | 0 | 14 | 0 |
| D | 0 | 14 | 0 |
| Quadrant | Total seconds | Saturated seconds | Saturation percentage |
|---|---|---|---|
| A | 5584 | 28 | 0.501433% |
| B | 5584 | 41 | 0.734241% |
| C | 5584 | 66 | 1.181948% |
| D | 5584 | 868 | 15.544413% |
Noise dominated data is calculated using 1-second bins in cleaned event files. If a bin has >2000 counts, and if more than 50% of those come from <1% of pixels, then it is considered to be noise-dominated and hence unusable.
| Quadrant | # 1 sec bins | Bins with >0 counts | Bins with >2000 counts | High rate bins dominated by noise | Noise dominated (total time) | Noise dominated (detector-on time) | Marked lightcurve |
|---|---|---|---|---|---|---|---|
| A | 6949 | 5585 | 6 | 6 | 0.09% | 0.11% | 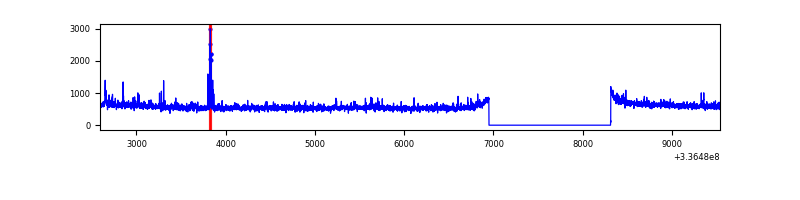 |
| B | 6949 | 5585 | 4 | 4 | 0.06% | 0.07% | 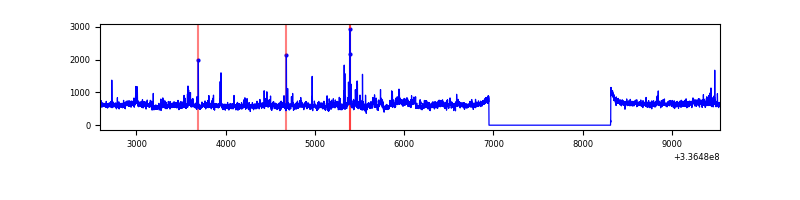 |
| C | 6949 | 5585 | 3 | 3 | 0.04% | 0.05% | 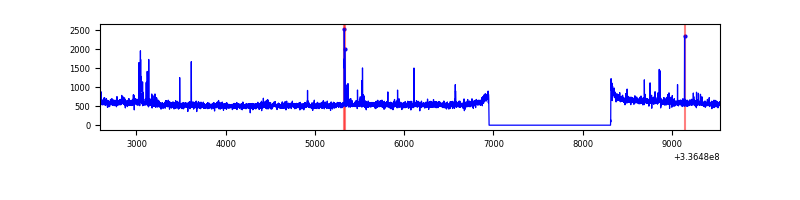 |
| D | 6949 | 5585 | 859 | 859 | 12.36% | 15.38% | 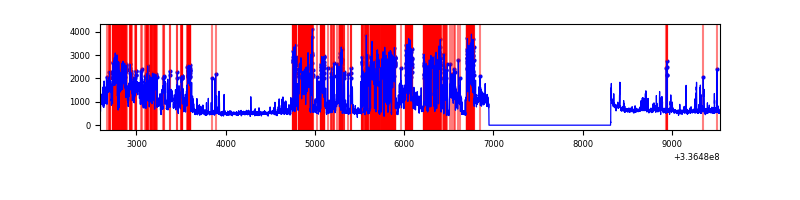 |
Top three noisy pixels from each quadrant. If the there are fewer than three noisy pixels in the level2.evt file, extra rows are filled as -1
| Pixel properties | Quadrant properties | ||||||
|---|---|---|---|---|---|---|---|
| Quadrant | DetID | PixID | Counts | Sigma | Mean | Median | Sigma |
| A | 0 | 13 | 137192 | 856.96 | 805 | 796 | 159.2 |
| A | 5 | 168 | 15545 | 92.67 | 805 | 796 | 159.2 |
| A | 13 | 254 | 9023 | 51.69 | 805 | 796 | 159.2 |
| B | 0 | 189 | 393786 | 2686.87 | 784 | 770 | 146.3 |
| B | 0 | 245 | 43799 | 294.17 | 784 | 770 | 146.3 |
| B | 5 | 172 | 22339 | 147.45 | 784 | 770 | 146.3 |
| C | 14 | 238 | 126028 | 715.38 | 758 | 768 | 175.1 |
| C | 15 | 208 | 66812 | 377.19 | 758 | 768 | 175.1 |
| C | 3 | 233 | 20732 | 114.02 | 758 | 768 | 175.1 |
| D | 1 | 52 | 2767122 | 14719.64 | 728 | 712 | 187.9 |
| D | 7 | 80 | 692244 | 3679.54 | 728 | 712 | 187.9 |
| D | 2 | 250 | 46675 | 244.56 | 728 | 712 | 187.9 |
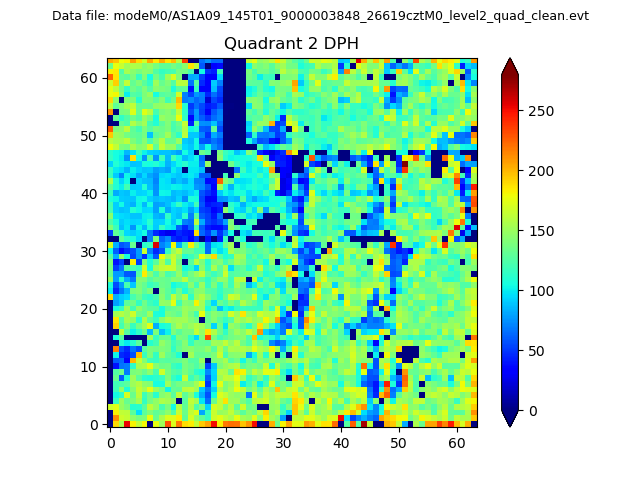
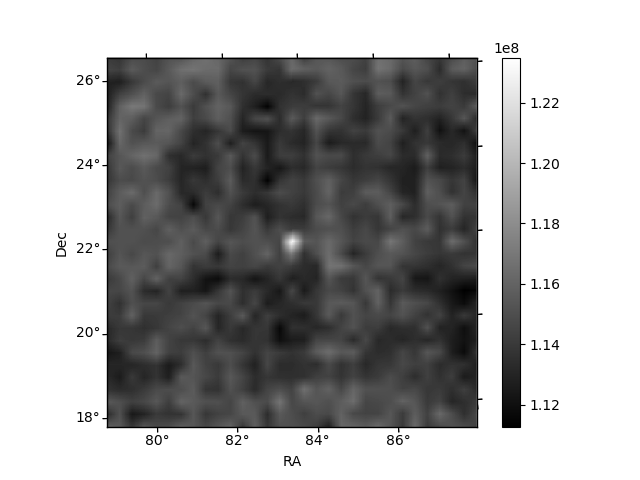
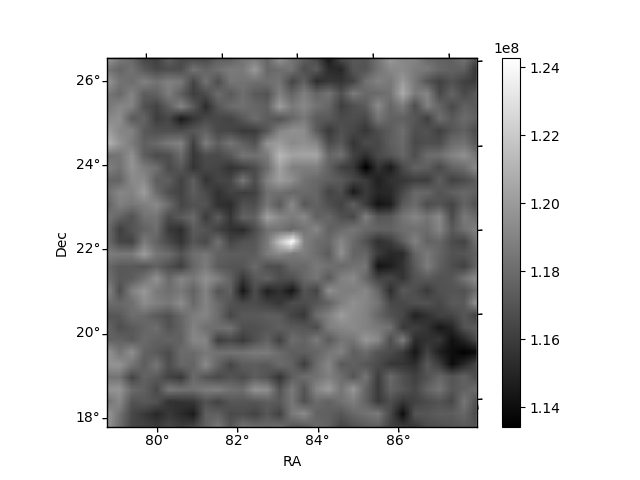
Histogram calculated using DETX and DETY for each event in the final _common_clean file
| Quadrant A | 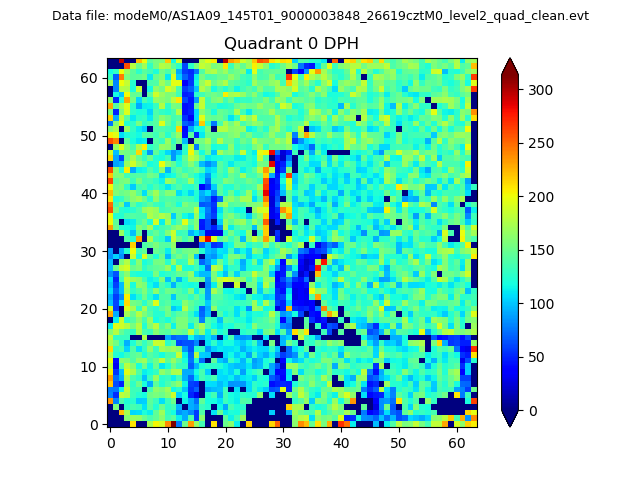 |
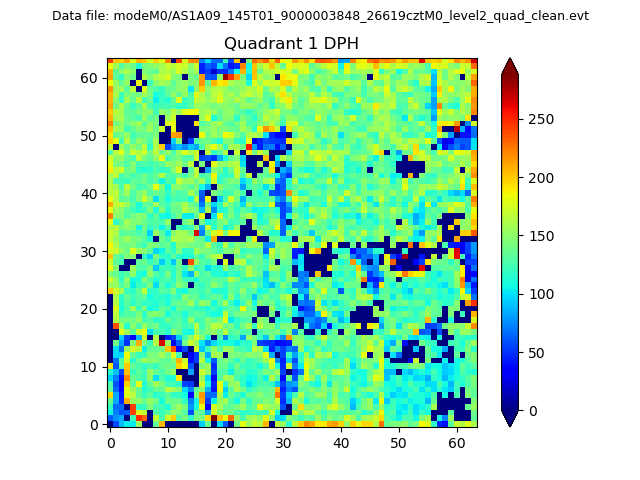 |
Quadrant B |
|---|---|---|---|
| Quadrant D | 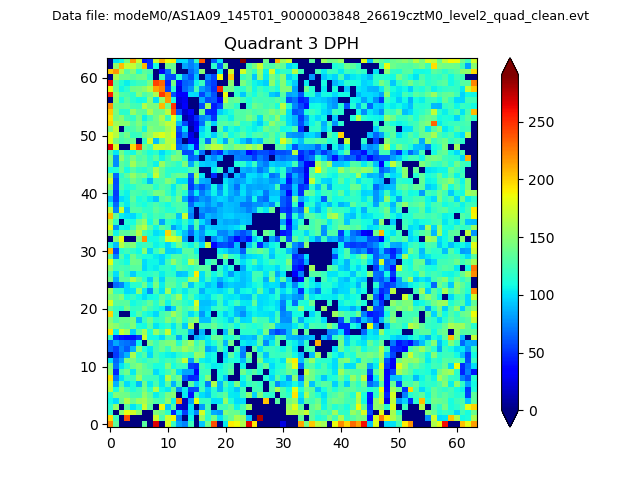 |
 |
Quadrant C |
| Plot type | Count rate plots | Images |
|---|---|---|
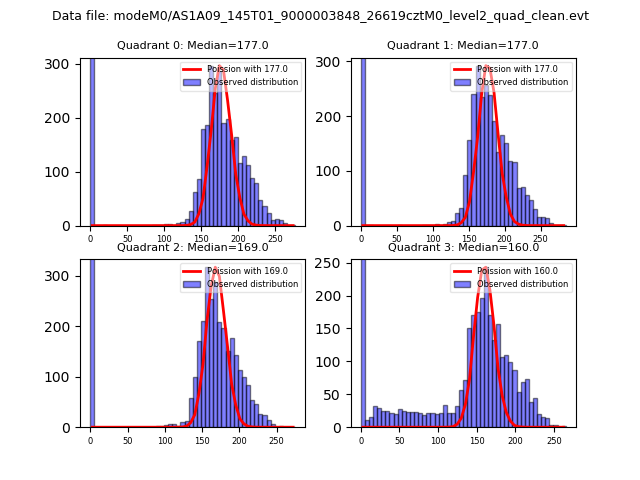
| Comparison with Poisson distribution Blue bars denote a histogram of data divided into 1 sec bins. Red curve is a Poisson curve with rate = median count rate of data. |
 |
 |
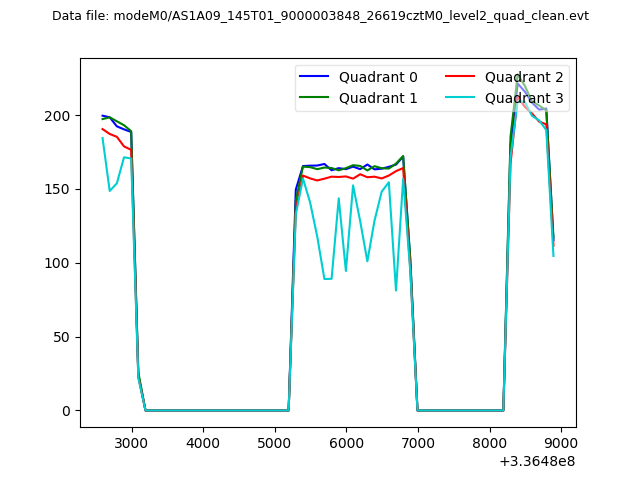
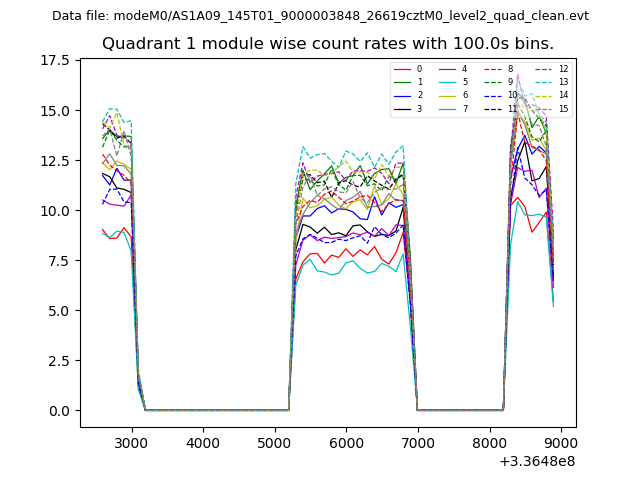
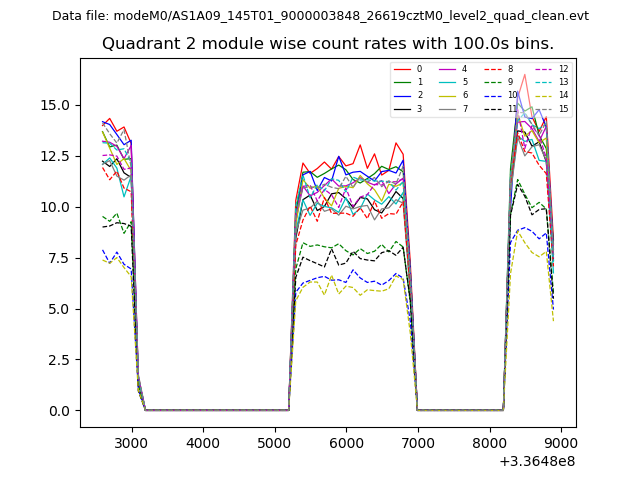
| Quadrant-wise count rates Data is divided into 100 sec bins |
 |
|
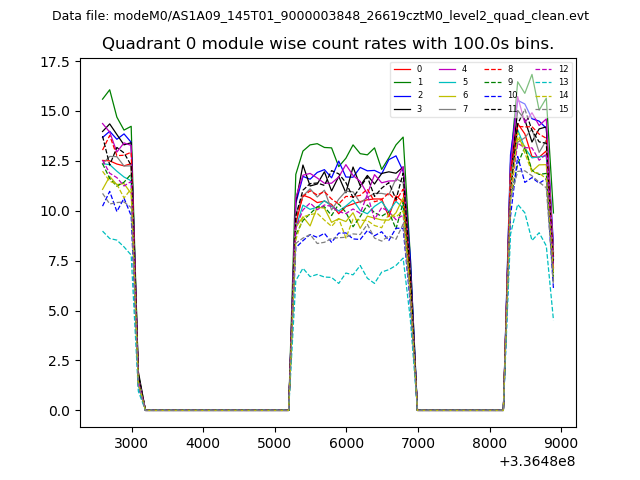
| Module-wise count rates for Quadrant A Data is divided into 100 sec bins |
 |
 |
| Module-wise count rates for Quadrant B Data is divided into 100 sec bins |
 |
 |
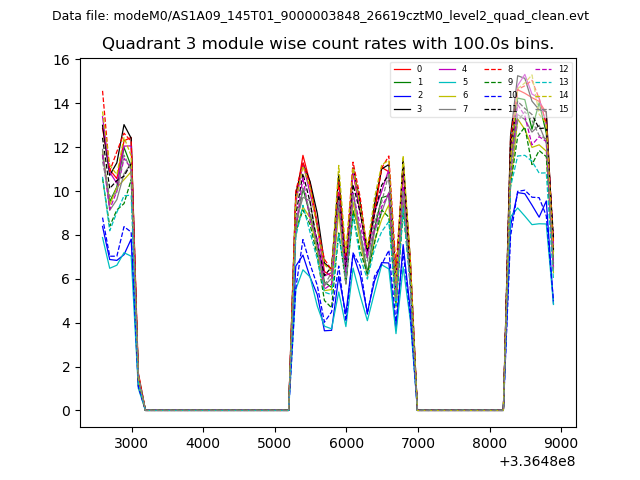
| Module-wise count rates for Quadrant C Data is divided into 100 sec bins |
 |
 |
| Module-wise count rates for Quadrant D Data is divided into 100 sec bins |
 |
 |
| Parameter | Plot |
|---|---|
| CZT HV Monitor | 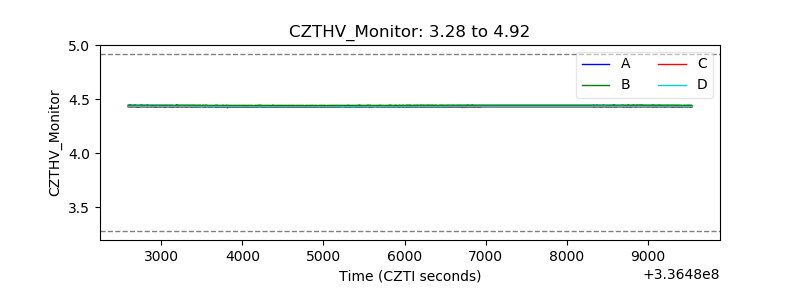 |
| D_VDD | 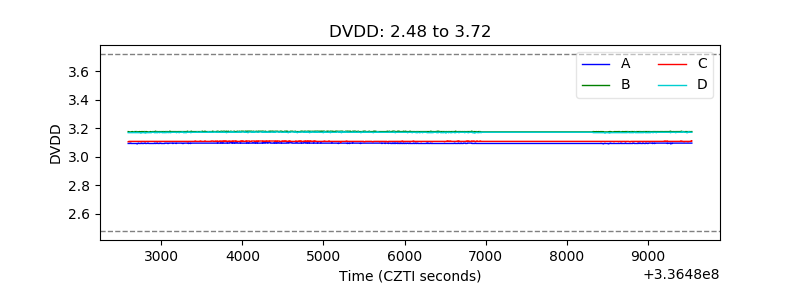 |
| Temperature 1 | 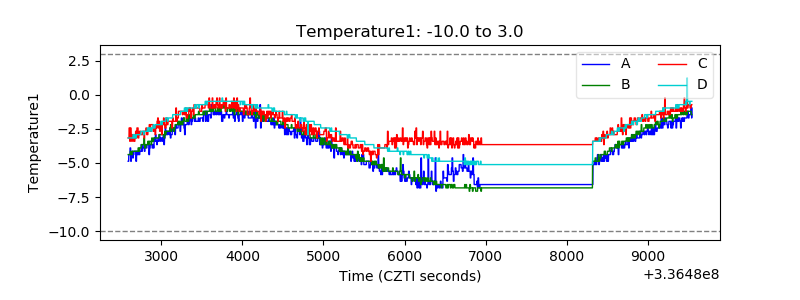 |
| Veto HV Monitor | 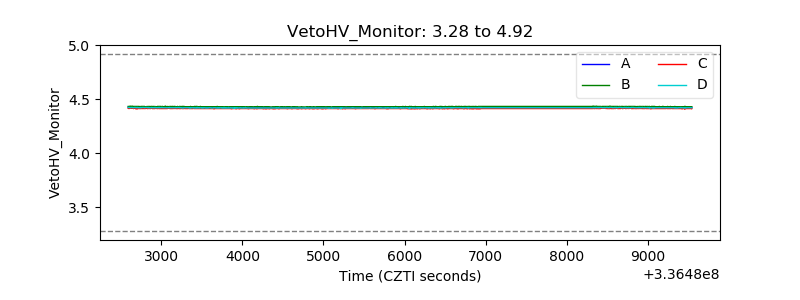 |
| Veto LLD | 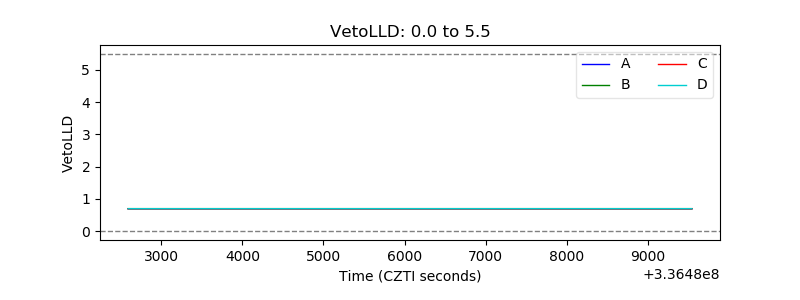 |
| Alpha Counter | 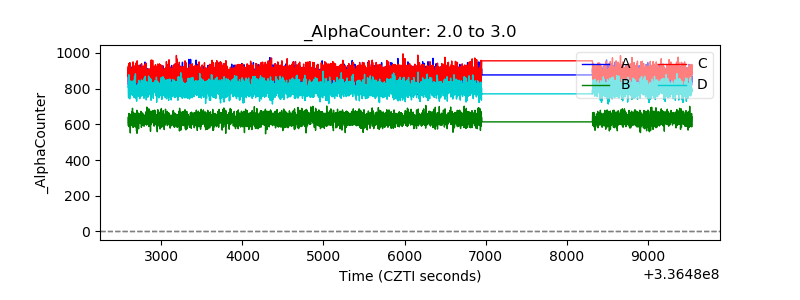 |
| _CPM_Rate | 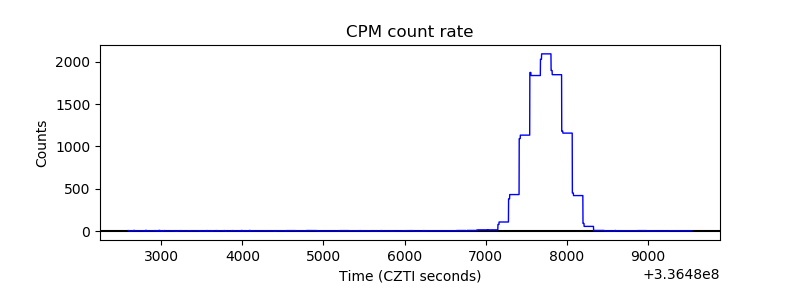 |
| CZT Counter | 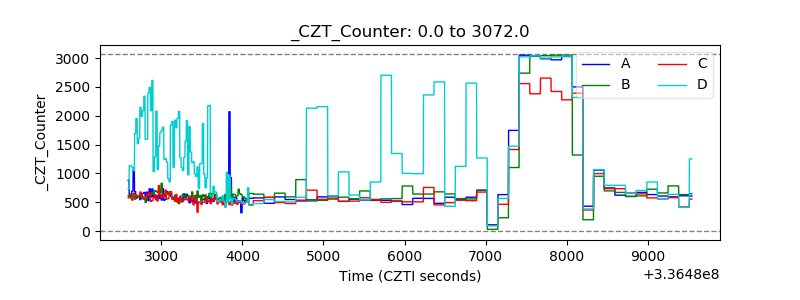 |
| +2.5 Volts monitor |  |
| +5 Volts monitor |  |
| _ROLL_ROT | 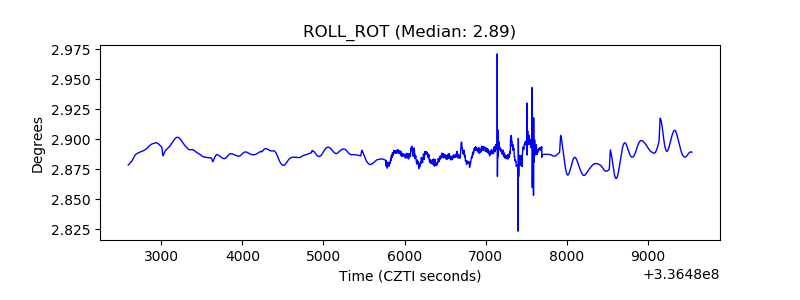 |
| _Roll_DEC | 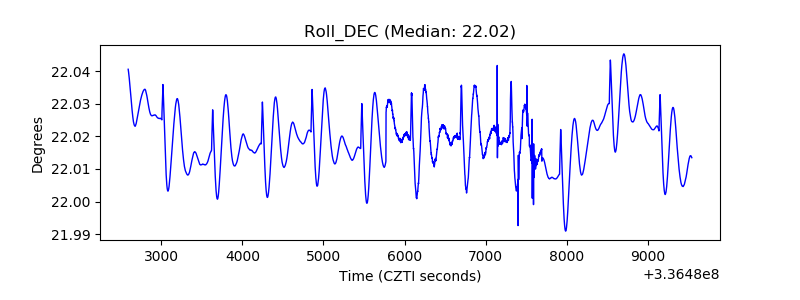 |
| _Roll_RA | 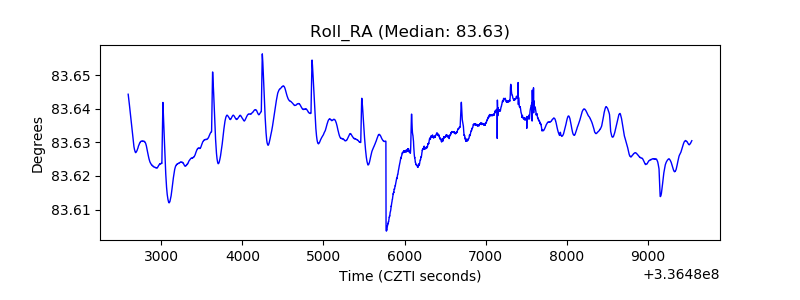 |
| Veto Counter | 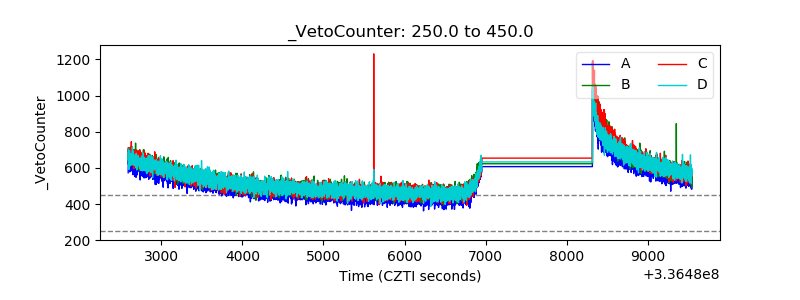 |