| Param | Original file | Final file |
|---|---|---|
| Filename | modeM0/AS1A09_145T01_9000003848_26620cztM0_level2.evt | modeM0/AS1A09_145T01_9000003848_26620cztM0_level2_quad_clean.evt |
| Size (bytes) | 626,431,680 | 82,319,040 |
| Size | 597.4 MB | 78.5 MB |
| Events in quadrant A | 3,912,357 | 528,521 |
| Events in quadrant B | 4,540,789 | 528,195 |
| Events in quadrant C | 3,736,216 | 507,727 |
| Events in quadrant D | 6,343,538 | 475,706 |
| Mode M0 | |||
|---|---|---|---|
| Quadrant | BADHDUFLAG | Total packets | Discarded packets |
| A | 0 | 15841 | 0 |
| B | 0 | 18181 | 0 |
| C | 0 | 15017 | 0 |
| D | 0 | 23243 | 0 |
| Mode M9 | |||
|---|---|---|---|
| Quadrant | BADHDUFLAG | Total packets | Discarded packets |
| A | 0 | 17 | 0 |
| B | 0 | 18 | 0 |
| C | 0 | 18 | 0 |
| D | 0 | 18 | 0 |
| Quadrant | Total seconds | Saturated seconds | Saturation percentage |
|---|---|---|---|
| A | 6493 | 96 | 1.478515% |
| B | 6492 | 170 | 2.618608% |
| C | 6492 | 131 | 2.017868% |
| D | 6492 | 885 | 13.632163% |
Noise dominated data is calculated using 1-second bins in cleaned event files. If a bin has >2000 counts, and if more than 50% of those come from <1% of pixels, then it is considered to be noise-dominated and hence unusable.
| Quadrant | # 1 sec bins | Bins with >0 counts | Bins with >2000 counts | High rate bins dominated by noise | Noise dominated (total time) | Noise dominated (detector-on time) | Marked lightcurve |
|---|---|---|---|---|---|---|---|
| A | 7808 | 6494 | 2 | 2 | 0.03% | 0.03% |  |
| B | 7807 | 6493 | 19 | 19 | 0.24% | 0.29% |  |
| C | 7807 | 6493 | 4 | 4 | 0.05% | 0.06% |  |
| D | 7807 | 6493 | 769 | 769 | 9.85% | 11.84% | 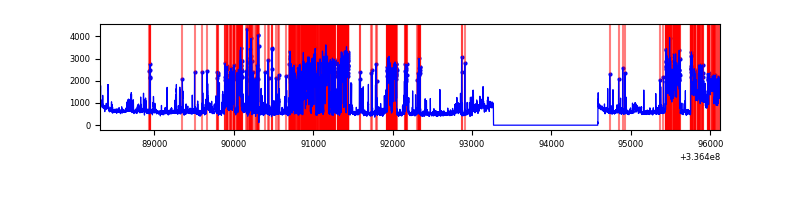 |
Top three noisy pixels from each quadrant. If the there are fewer than three noisy pixels in the level2.evt file, extra rows are filled as -1
| Pixel properties | Quadrant properties | ||||||
|---|---|---|---|---|---|---|---|
| Quadrant | DetID | PixID | Counts | Sigma | Mean | Median | Sigma |
| A | 0 | 13 | 262828 | 1422.89 | 938 | 924 | 184.1 |
| A | 5 | 168 | 26349 | 138.13 | 938 | 924 | 184.1 |
| A | 13 | 254 | 11098 | 55.27 | 938 | 924 | 184.1 |
| B | 0 | 189 | 835825 | 4851.02 | 916 | 898 | 172.1 |
| B | 5 | 172 | 66685 | 382.23 | 916 | 898 | 172.1 |
| B | 15 | 32 | 20628 | 114.63 | 916 | 898 | 172.1 |
| C | 14 | 238 | 147203 | 712.22 | 889 | 897 | 205.4 |
| C | 3 | 233 | 78330 | 376.94 | 889 | 897 | 205.4 |
| C | 15 | 208 | 43750 | 208.61 | 889 | 897 | 205.4 |
| D | 1 | 52 | 1979097 | 9545.18 | 862 | 846 | 207.3 |
| D | 7 | 80 | 918430 | 4427.4 | 862 | 846 | 207.3 |
| D | 2 | 250 | 117844 | 564.52 | 862 | 846 | 207.3 |
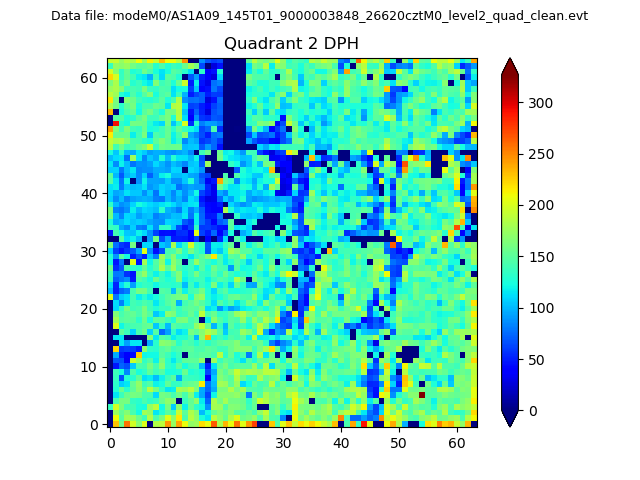
Histogram calculated using DETX and DETY for each event in the final _common_clean file
| Quadrant A | 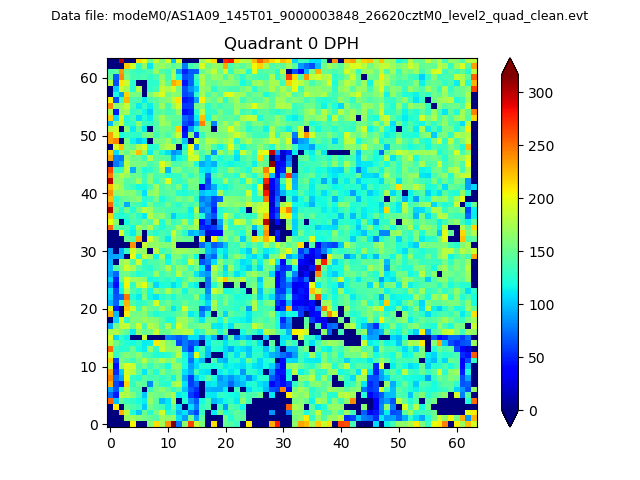 |
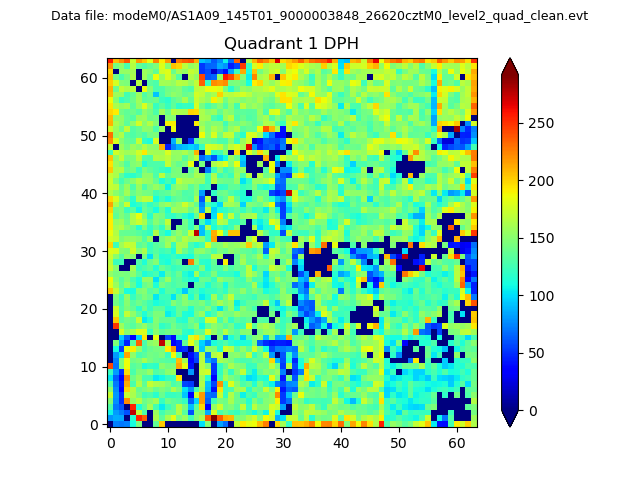 |
Quadrant B |
|---|---|---|---|
| Quadrant D | 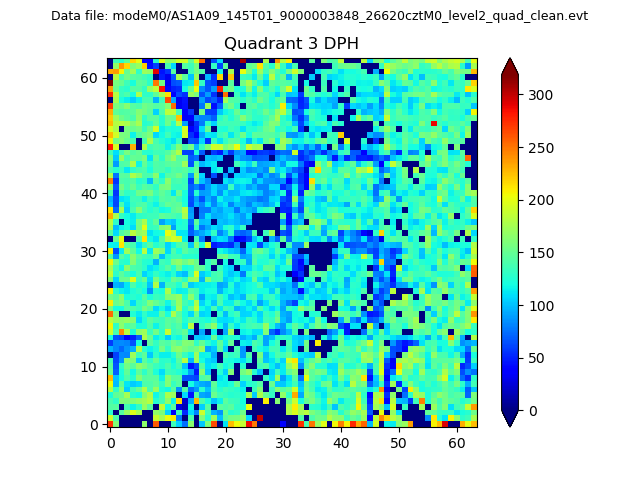 |
 |
Quadrant C |
| Plot type | Count rate plots | Images |
|---|---|---|
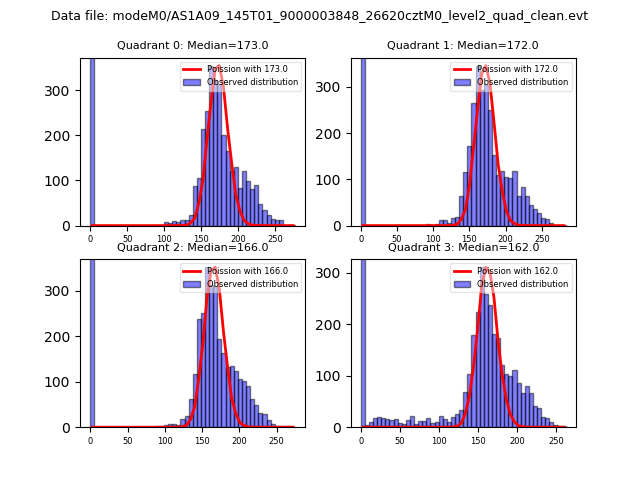
| Comparison with Poisson distribution Blue bars denote a histogram of data divided into 1 sec bins. Red curve is a Poisson curve with rate = median count rate of data. |
 |
 |
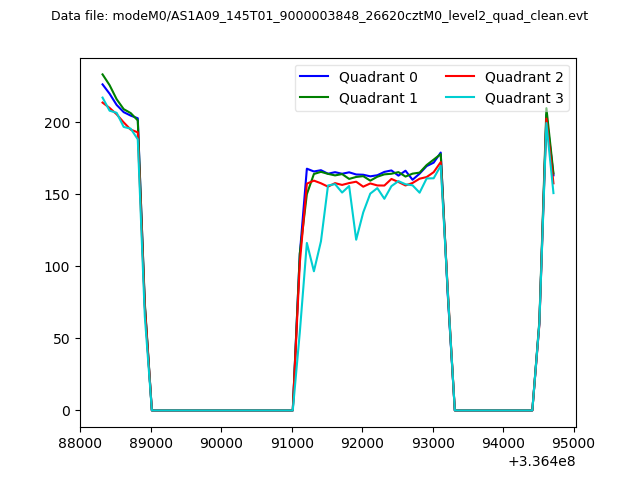
| Quadrant-wise count rates Data is divided into 100 sec bins |
 |
|
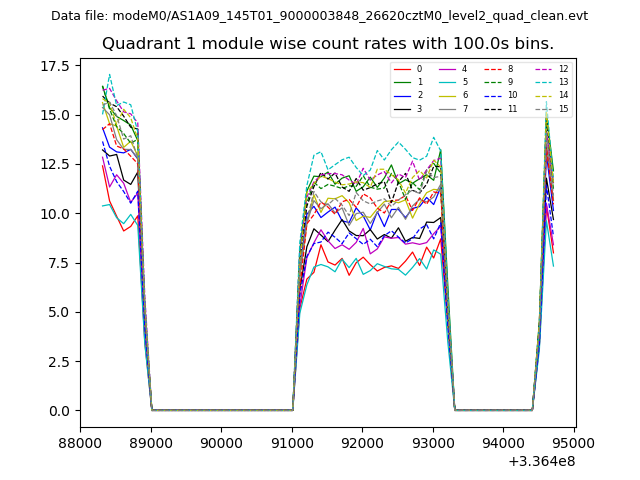
| Module-wise count rates for Quadrant A Data is divided into 100 sec bins |
 |
 |
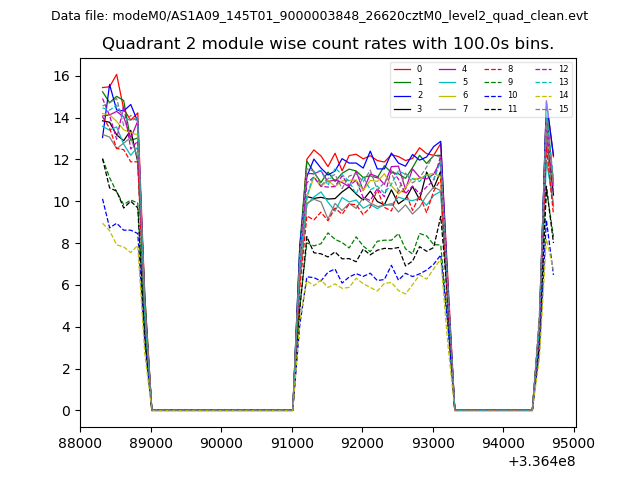
| Module-wise count rates for Quadrant B Data is divided into 100 sec bins |
 |
 |
| Module-wise count rates for Quadrant C Data is divided into 100 sec bins |
 |
 |
| Module-wise count rates for Quadrant D Data is divided into 100 sec bins |
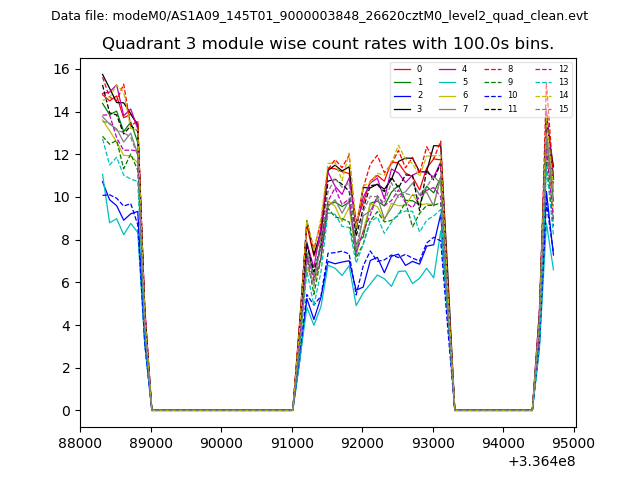 |
 |
| Parameter | Plot |
|---|---|
| CZT HV Monitor | 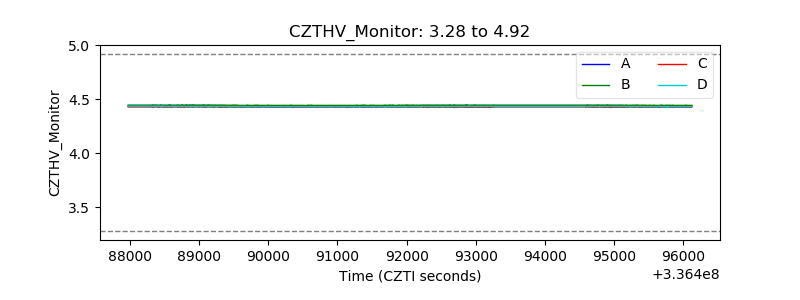 |
| D_VDD | 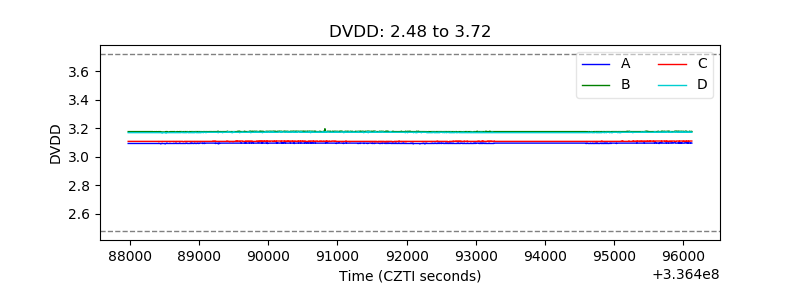 |
| Temperature 1 | 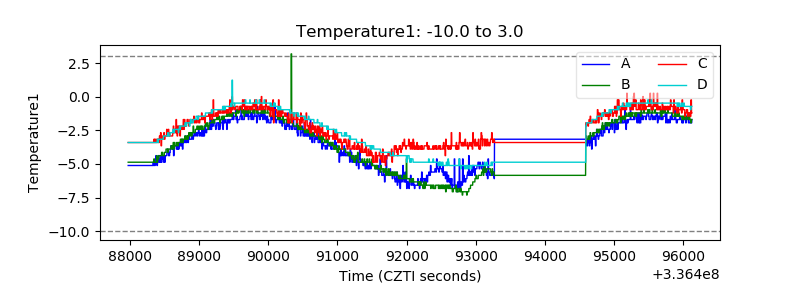 |
| Veto HV Monitor | 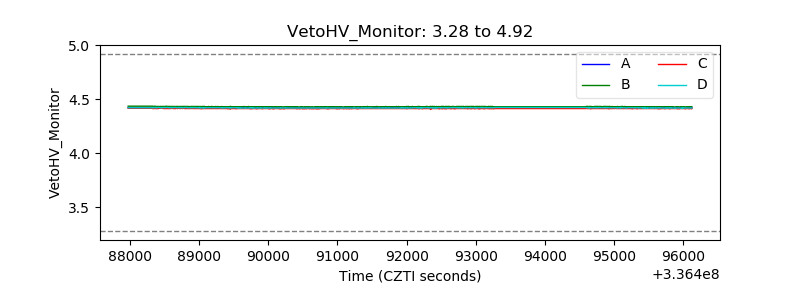 |
| Veto LLD | 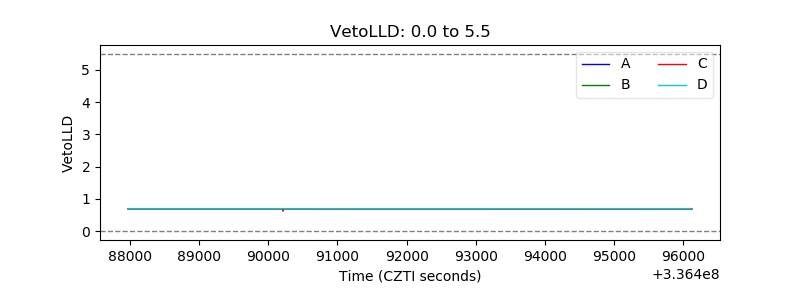 |
| Alpha Counter |  |
| _CPM_Rate | 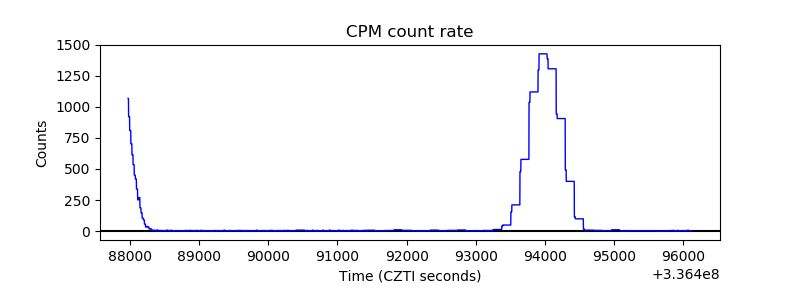 |
| CZT Counter | 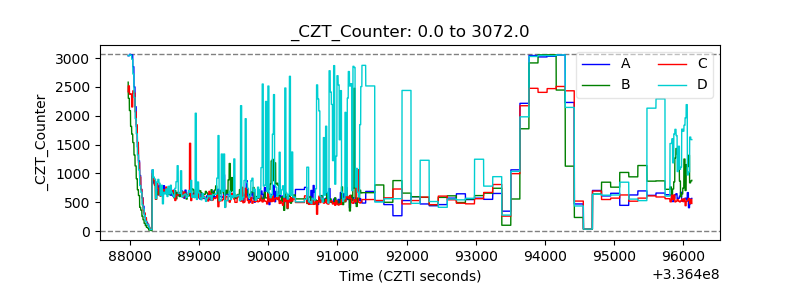 |
| +2.5 Volts monitor | 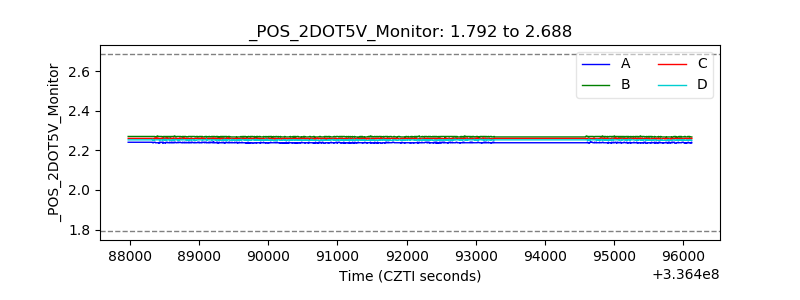 |
| +5 Volts monitor |  |
| _ROLL_ROT | 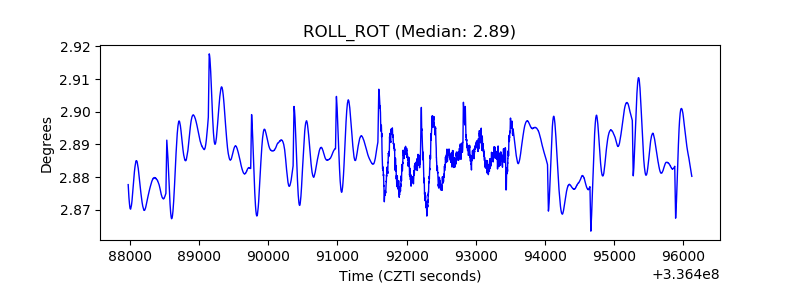 |
| _Roll_DEC | 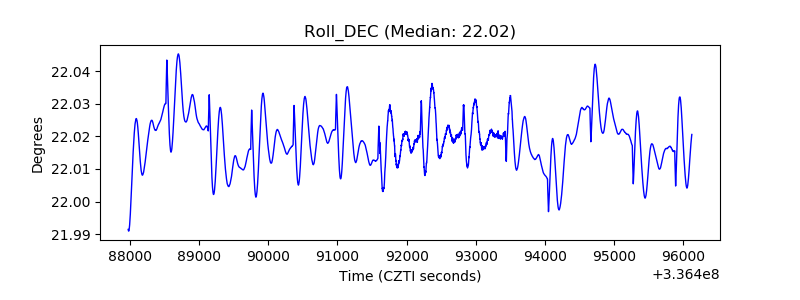 |
| _Roll_RA | 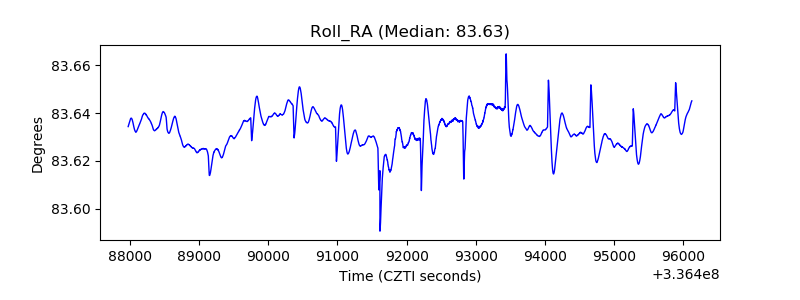 |
| Veto Counter | 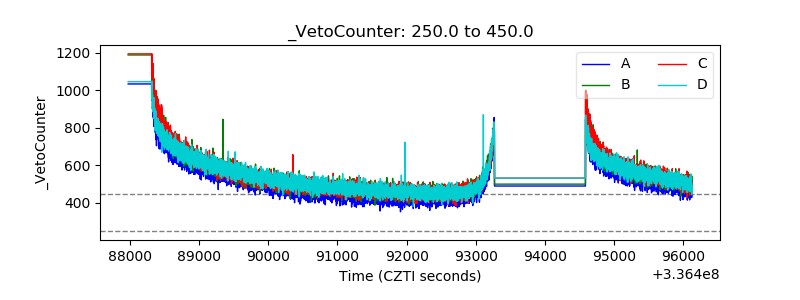 |