| Param | Original file | Final file |
|---|---|---|
| Filename | modeM0/AS1A09_145T01_9000003848_26621cztM0_level2.evt | modeM0/AS1A09_145T01_9000003848_26621cztM0_level2_quad_clean.evt |
| Size (bytes) | 661,458,240 | 66,199,680 |
| Size | 630.8 MB | 63.1 MB |
| Events in quadrant A | 3,317,078 | 434,107 |
| Events in quadrant B | 4,497,078 | 432,063 |
| Events in quadrant C | 3,240,210 | 420,066 |
| Events in quadrant D | 8,576,789 | 303,040 |
| Mode M0 | |||
|---|---|---|---|
| Quadrant | BADHDUFLAG | Total packets | Discarded packets |
| A | 0 | 13283 | 0 |
| B | 0 | 17427 | 0 |
| C | 0 | 12922 | 0 |
| D | 0 | 29562 | 0 |
| Mode M9 | |||
|---|---|---|---|
| Quadrant | BADHDUFLAG | Total packets | Discarded packets |
| A | 0 | 11 | 0 |
| B | 0 | 11 | 0 |
| C | 0 | 11 | 0 |
| D | 0 | 11 | 0 |
| Quadrant | Total seconds | Saturated seconds | Saturation percentage |
|---|---|---|---|
| A | 5933 | 119 | 2.005731% |
| B | 5932 | 288 | 4.855024% |
| C | 5933 | 142 | 2.393393% |
| D | 5933 | 2167 | 36.524524% |
Noise dominated data is calculated using 1-second bins in cleaned event files. If a bin has >2000 counts, and if more than 50% of those come from <1% of pixels, then it is considered to be noise-dominated and hence unusable.
| Quadrant | # 1 sec bins | Bins with >0 counts | Bins with >2000 counts | High rate bins dominated by noise | Noise dominated (total time) | Noise dominated (detector-on time) | Marked lightcurve |
|---|---|---|---|---|---|---|---|
| A | 7058 | 5934 | 0 | 0 | 0.00% | 0.00% | 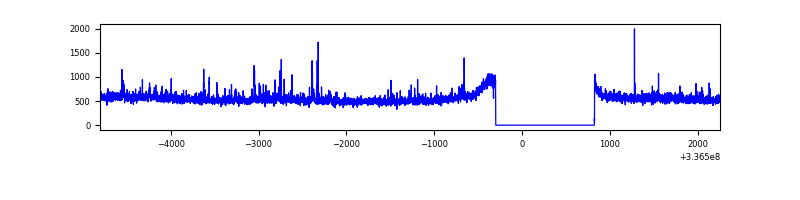 |
| B | 7057 | 5933 | 20 | 20 | 0.28% | 0.34% | 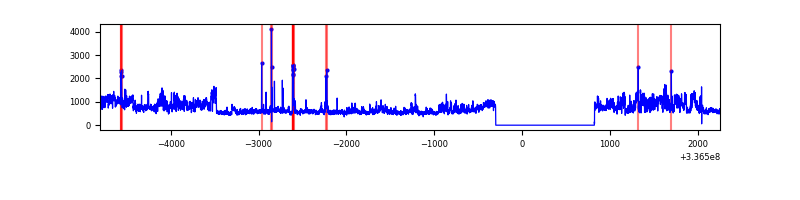 |
| C | 7058 | 5934 | 0 | 0 | 0.00% | 0.00% | 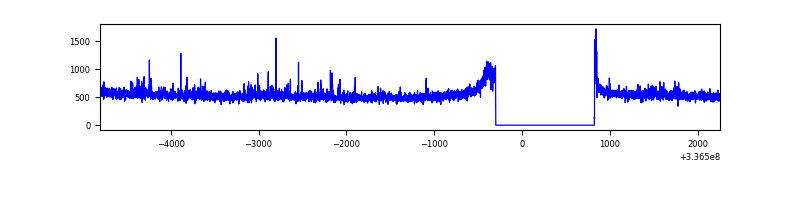 |
| D | 7058 | 5934 | 1870 | 1870 | 26.49% | 31.51% | 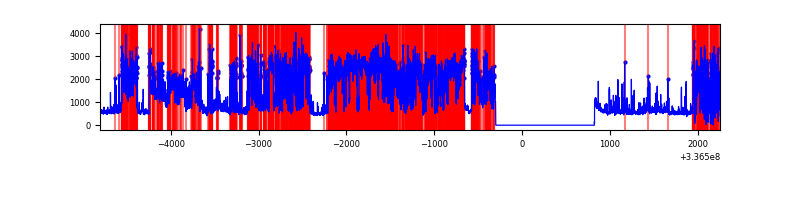 |
Top three noisy pixels from each quadrant. If the there are fewer than three noisy pixels in the level2.evt file, extra rows are filled as -1
| Pixel properties | Quadrant properties | ||||||
|---|---|---|---|---|---|---|---|
| Quadrant | DetID | PixID | Counts | Sigma | Mean | Median | Sigma |
| A | 0 | 13 | 145658 | 891.62 | 813 | 802 | 162.5 |
| A | 5 | 168 | 30071 | 180.16 | 813 | 802 | 162.5 |
| A | 13 | 254 | 10343 | 58.73 | 813 | 802 | 162.5 |
| B | 0 | 189 | 1247156 | 8359.94 | 795 | 780 | 149.1 |
| B | 5 | 172 | 55225 | 365.18 | 795 | 780 | 149.1 |
| B | 14 | 207 | 31368 | 205.17 | 795 | 780 | 149.1 |
| C | 14 | 238 | 125629 | 686.28 | 776 | 782 | 181.9 |
| C | 3 | 233 | 79704 | 433.83 | 776 | 782 | 181.9 |
| C | 15 | 208 | 9611 | 48.53 | 776 | 782 | 181.9 |
| D | 7 | 80 | 3982731 | 25025.46 | 662 | 649 | 159.1 |
| D | 1 | 52 | 1786639 | 11224.09 | 662 | 649 | 159.1 |
| D | 2 | 250 | 184017 | 1152.38 | 662 | 649 | 159.1 |
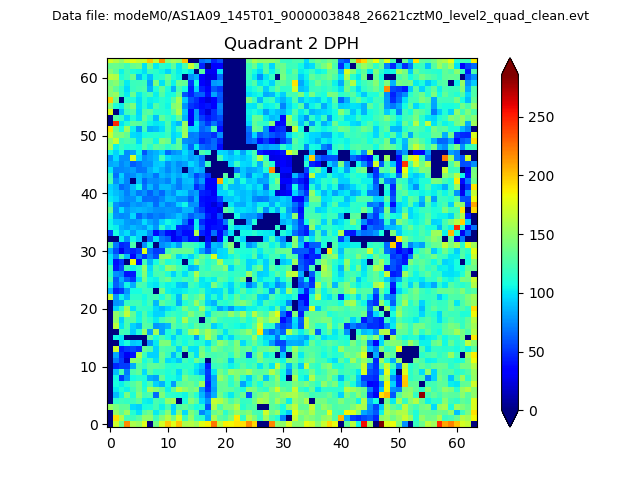
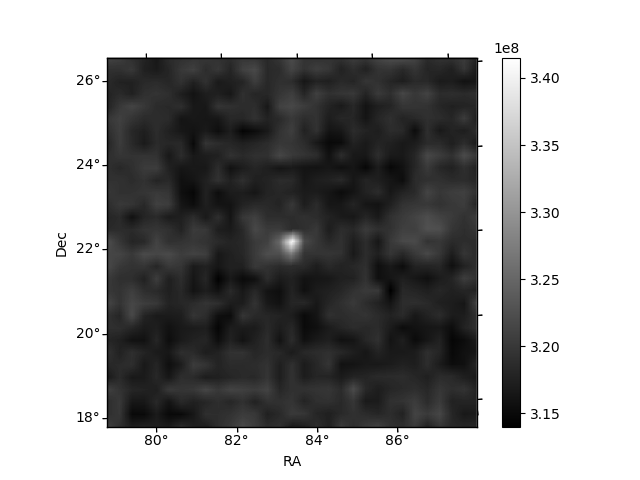
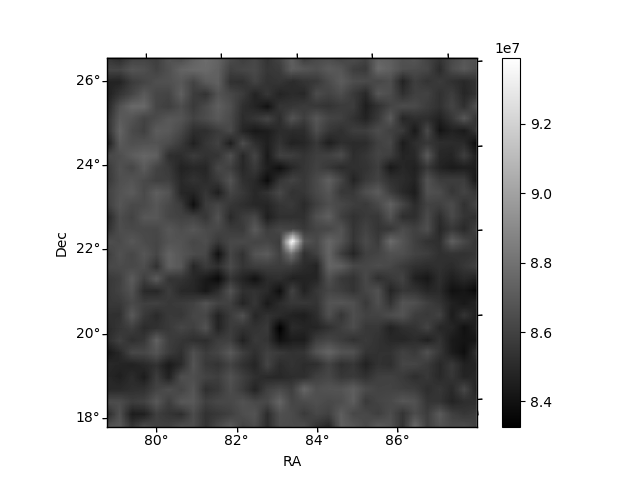
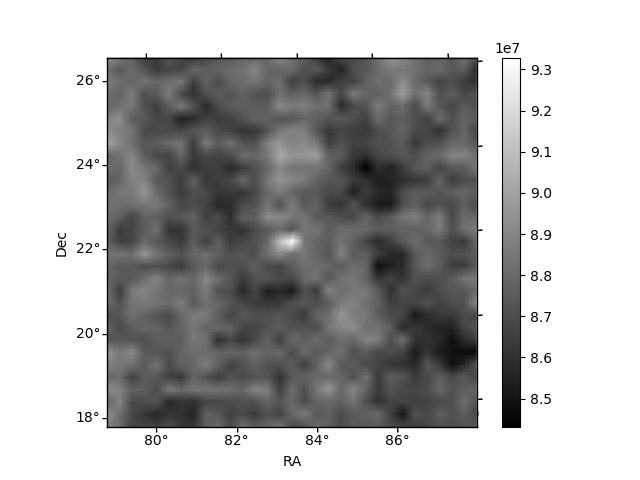
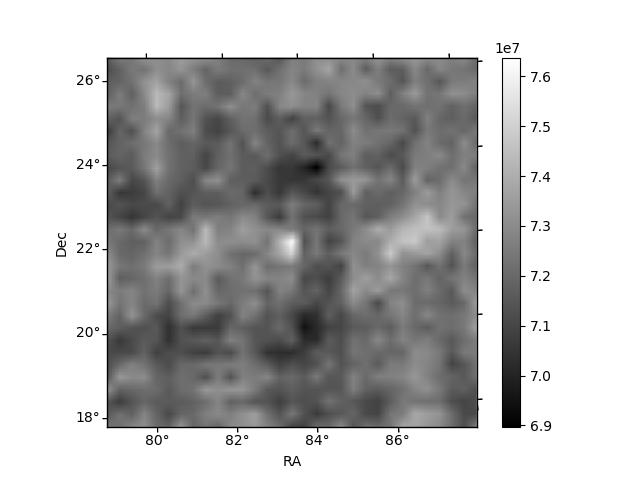
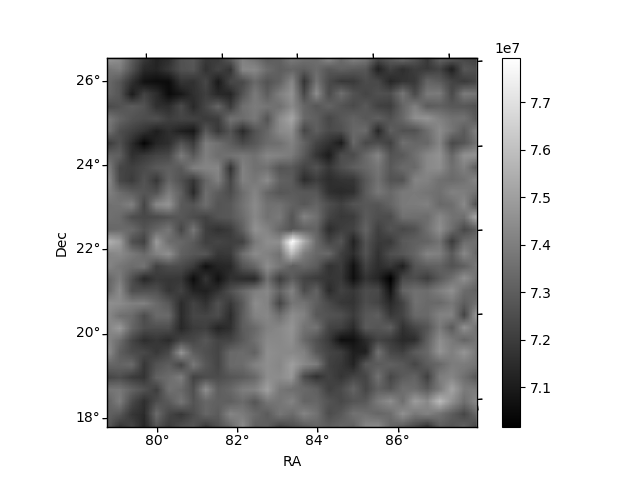
Histogram calculated using DETX and DETY for each event in the final _common_clean file
| Quadrant A | 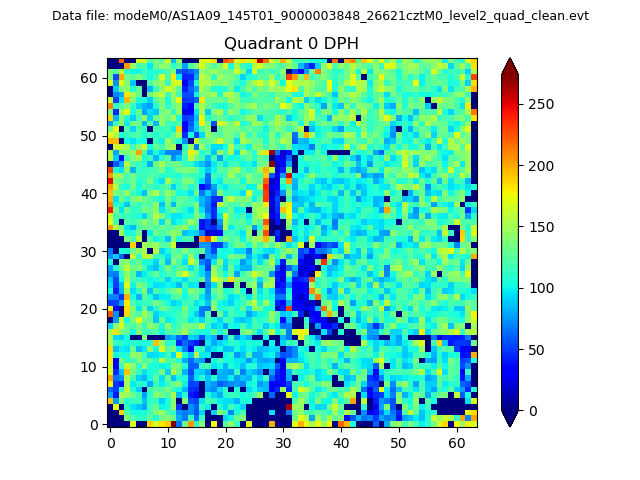 |
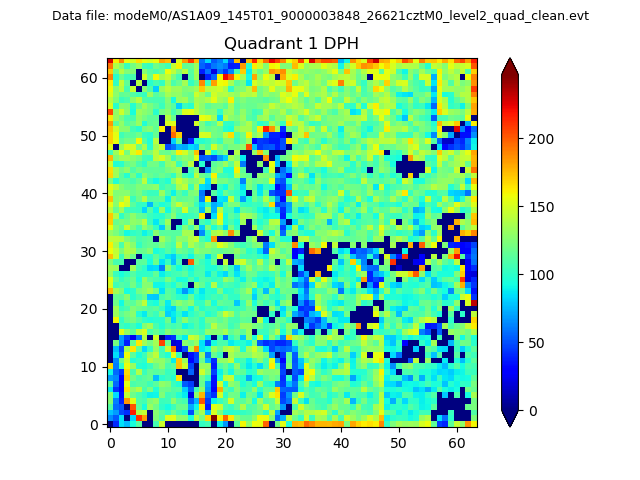 |
Quadrant B |
|---|---|---|---|
| Quadrant D | 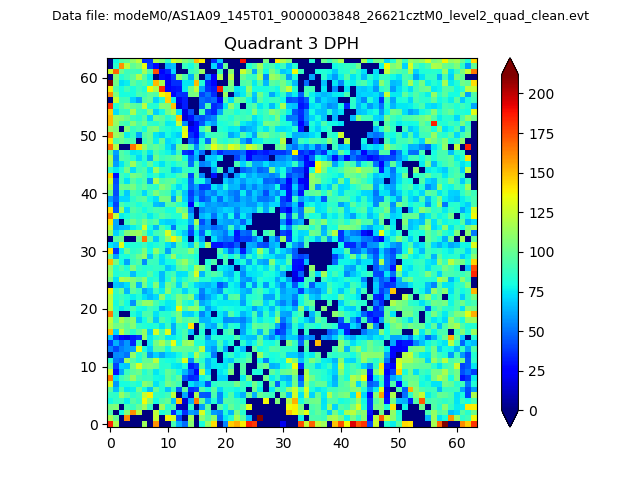 |
 |
Quadrant C |
| Plot type | Count rate plots | Images |
|---|---|---|
| Comparison with Poisson distribution Blue bars denote a histogram of data divided into 1 sec bins. Red curve is a Poisson curve with rate = median count rate of data. |
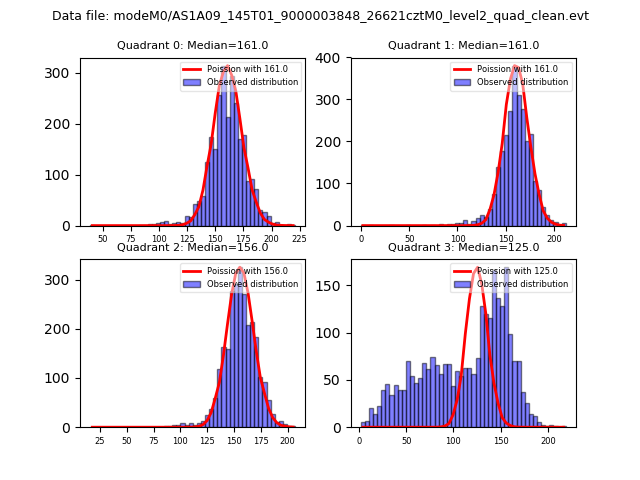 |
 |
| Quadrant-wise count rates Data is divided into 100 sec bins |
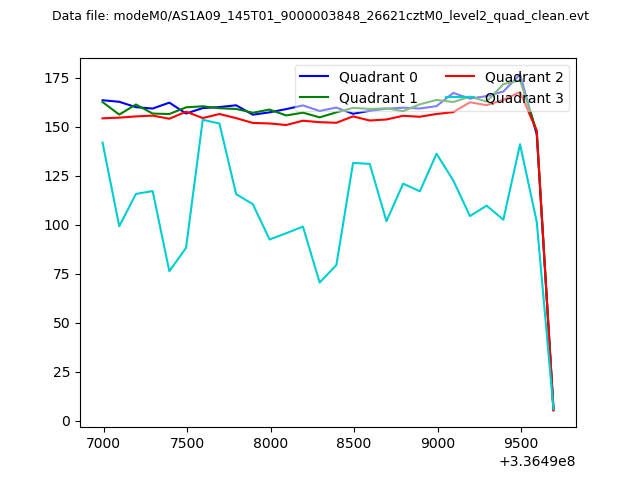 |
|
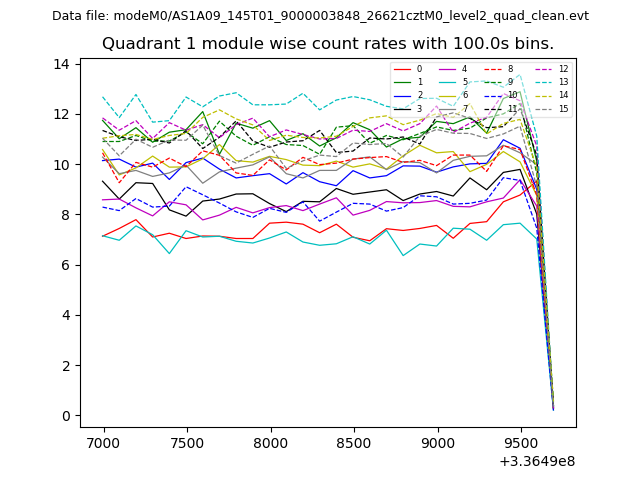
| Module-wise count rates for Quadrant A Data is divided into 100 sec bins |
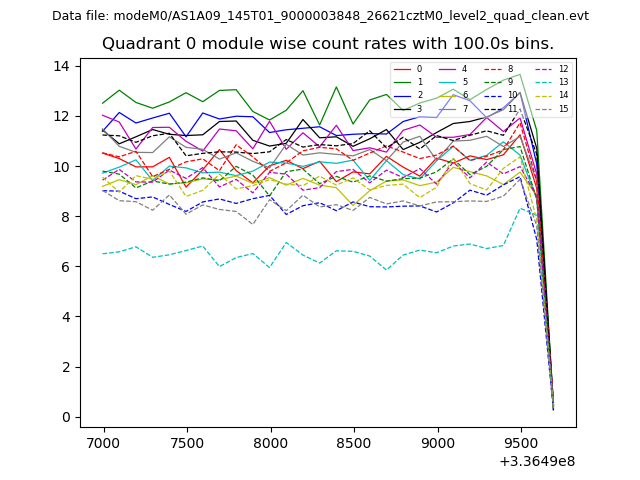 |
 |
| Module-wise count rates for Quadrant B Data is divided into 100 sec bins |
 |
 |
| Module-wise count rates for Quadrant C Data is divided into 100 sec bins |
 |
 |
| Module-wise count rates for Quadrant D Data is divided into 100 sec bins |
 |
 |
| Parameter | Plot |
|---|---|
| CZT HV Monitor | 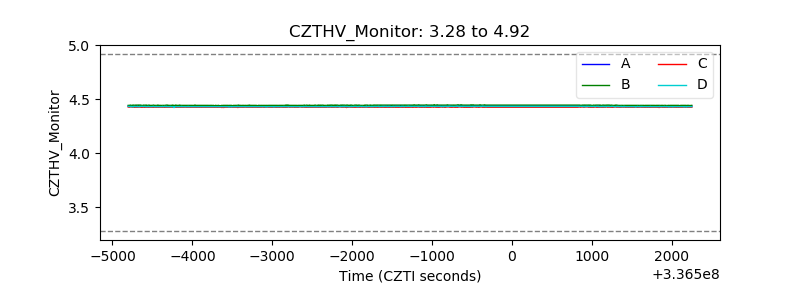 |
| D_VDD | 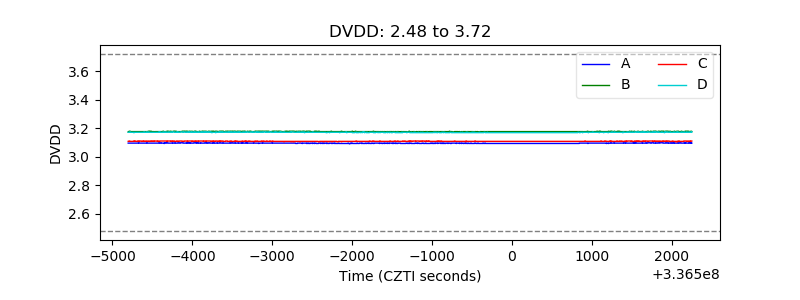 |
| Temperature 1 | 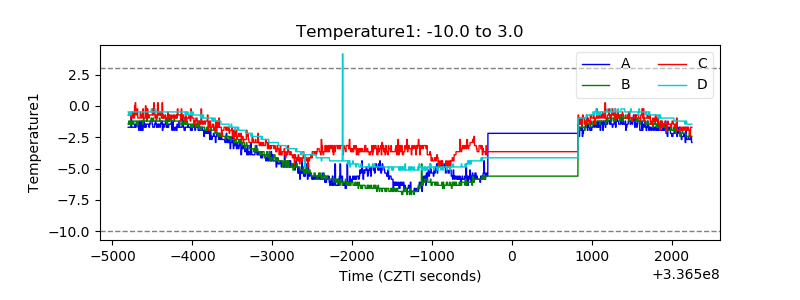 |
| Veto HV Monitor | 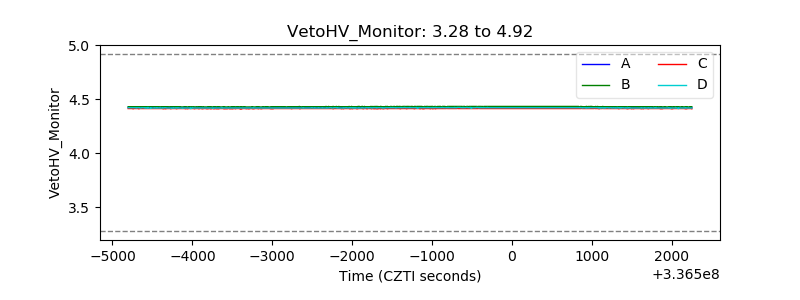 |
| Veto LLD | 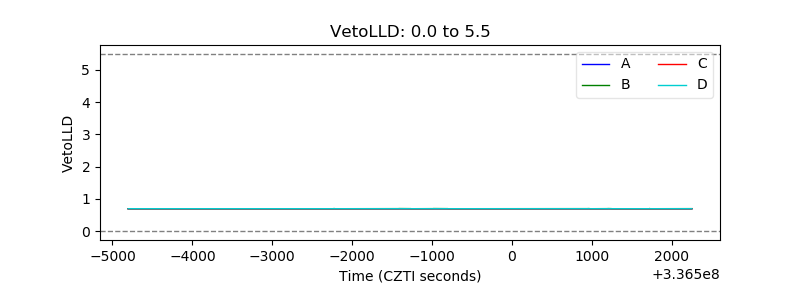 |
| Alpha Counter |  |
| _CPM_Rate |  |
| CZT Counter | 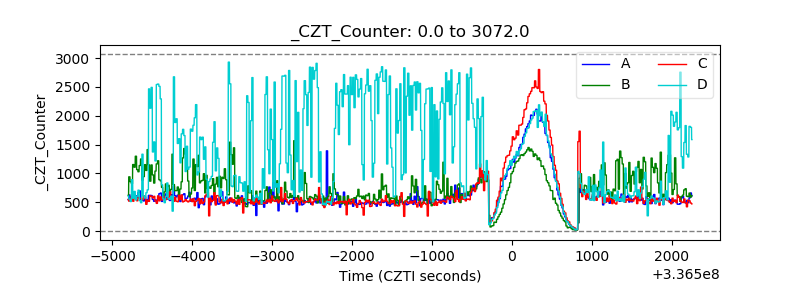 |
| +2.5 Volts monitor | 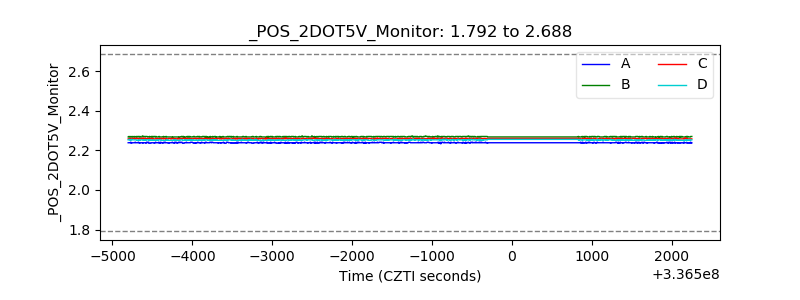 |
| +5 Volts monitor |  |
| _ROLL_ROT |  |
| _Roll_DEC | 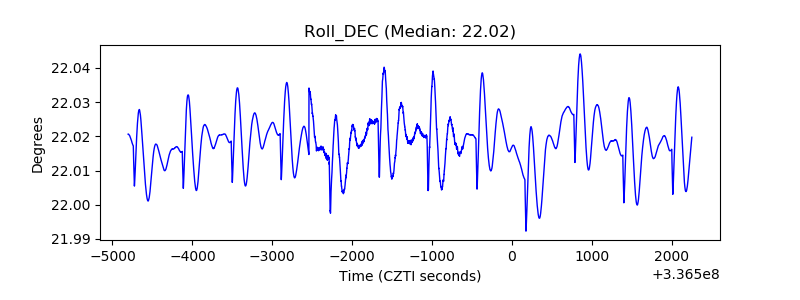 |
| _Roll_RA |  |
| Veto Counter |  |