| Param | Original file | Final file |
|---|---|---|
| Filename | modeM0/AS1A09_145T01_9000003848_26622cztM0_level2.evt | modeM0/AS1A09_145T01_9000003848_26622cztM0_level2_quad_clean.evt |
| Size (bytes) | 587,047,680 | 83,073,600 |
| Size | 559.9 MB | 79.2 MB |
| Events in quadrant A | 3,662,448 | 522,282 |
| Events in quadrant B | 4,847,731 | 524,326 |
| Events in quadrant C | 3,622,842 | 507,542 |
| Events in quadrant D | 5,183,347 | 486,134 |
| Mode M0 | |||
|---|---|---|---|
| Quadrant | BADHDUFLAG | Total packets | Discarded packets |
| A | 0 | 14886 | 0 |
| B | 0 | 19066 | 0 |
| C | 0 | 14634 | 0 |
| D | 0 | 19751 | 0 |
| Mode M9 | |||
|---|---|---|---|
| Quadrant | BADHDUFLAG | Total packets | Discarded packets |
| A | 0 | 14 | 0 |
| B | 0 | 15 | 0 |
| C | 0 | 15 | 0 |
| D | 0 | 15 | 0 |
| Quadrant | Total seconds | Saturated seconds | Saturation percentage |
|---|---|---|---|
| A | 6822 | 114 | 1.671064% |
| B | 6821 | 372 | 5.453746% |
| C | 6821 | 160 | 2.345697% |
| D | 6821 | 928 | 13.605043% |
Noise dominated data is calculated using 1-second bins in cleaned event files. If a bin has >2000 counts, and if more than 50% of those come from <1% of pixels, then it is considered to be noise-dominated and hence unusable.
| Quadrant | # 1 sec bins | Bins with >0 counts | Bins with >2000 counts | High rate bins dominated by noise | Noise dominated (total time) | Noise dominated (detector-on time) | Marked lightcurve |
|---|---|---|---|---|---|---|---|
| A | 7612 | 6823 | 1 | 1 | 0.01% | 0.01% | 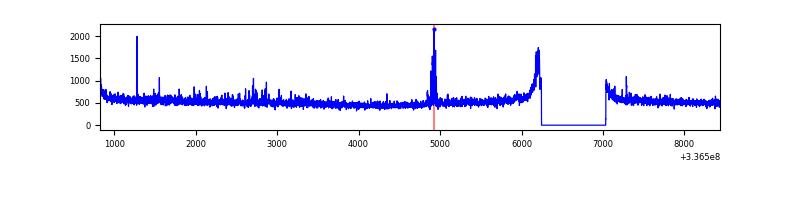 |
| B | 7611 | 6822 | 2 | 2 | 0.03% | 0.03% | 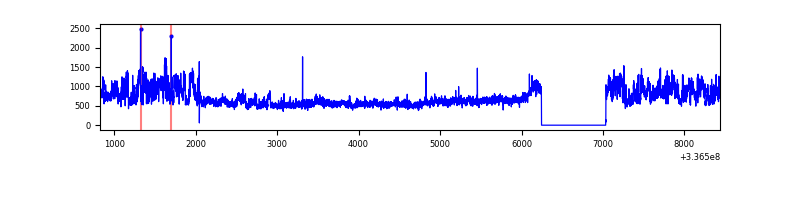 |
| C | 7611 | 6822 | 1 | 1 | 0.01% | 0.01% | 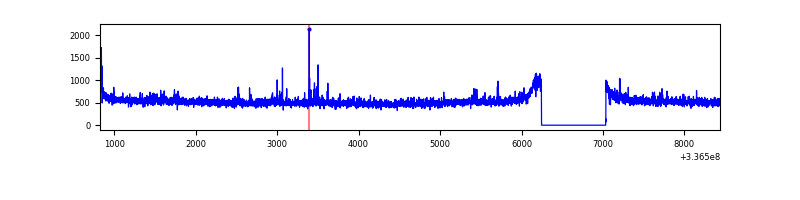 |
| D | 7611 | 6821 | 405 | 405 | 5.32% | 5.94% | 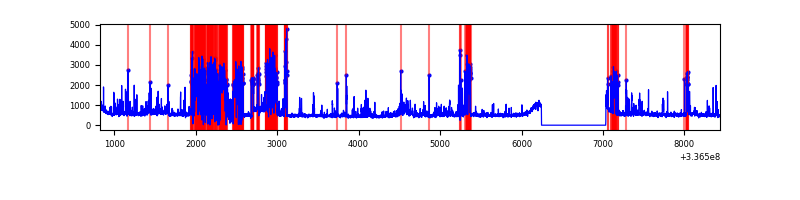 |
Top three noisy pixels from each quadrant. If the there are fewer than three noisy pixels in the level2.evt file, extra rows are filled as -1
| Pixel properties | Quadrant properties | ||||||
|---|---|---|---|---|---|---|---|
| Quadrant | DetID | PixID | Counts | Sigma | Mean | Median | Sigma |
| A | 0 | 13 | 145762 | 794.78 | 906 | 892 | 182.3 |
| A | 5 | 168 | 26970 | 143.07 | 906 | 892 | 182.3 |
| A | 13 | 254 | 11569 | 58.58 | 906 | 892 | 182.3 |
| B | 0 | 189 | 1324281 | 7811.4 | 890 | 870 | 169.4 |
| B | 5 | 172 | 22298 | 126.48 | 890 | 870 | 169.4 |
| B | 12 | 111 | 19863 | 112.11 | 890 | 870 | 169.4 |
| C | 14 | 238 | 139914 | 676.53 | 868 | 876 | 205.5 |
| C | 3 | 233 | 71703 | 344.63 | 868 | 876 | 205.5 |
| C | 15 | 208 | 29385 | 138.72 | 868 | 876 | 205.5 |
| D | 7 | 80 | 1219876 | 6204.99 | 809 | 791 | 196.5 |
| D | 1 | 52 | 607986 | 3090.55 | 809 | 791 | 196.5 |
| D | 12 | 233 | 94418 | 476.55 | 809 | 791 | 196.5 |
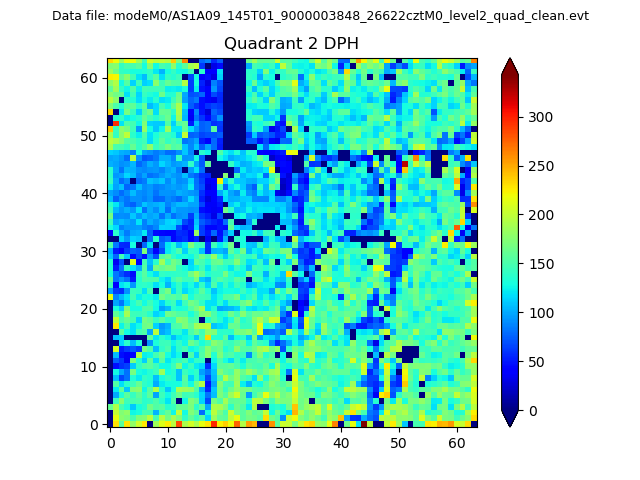
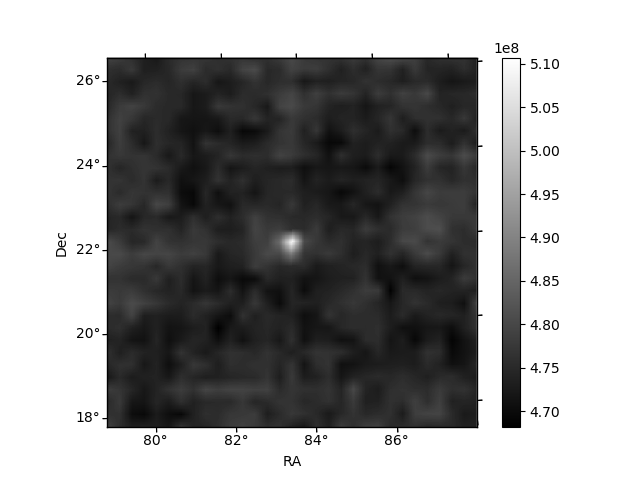
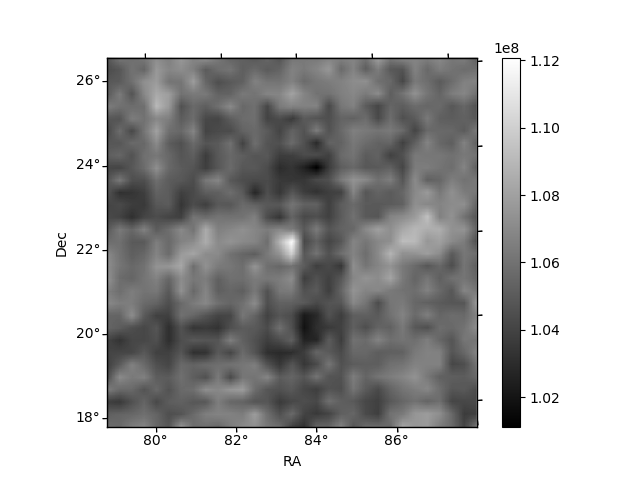
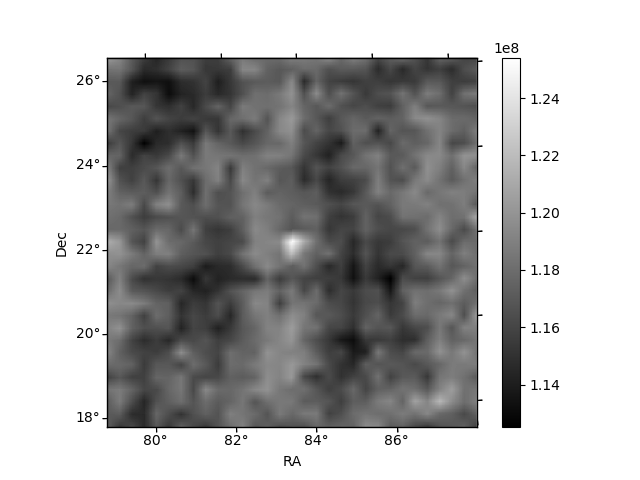
Histogram calculated using DETX and DETY for each event in the final _common_clean file
| Quadrant A | 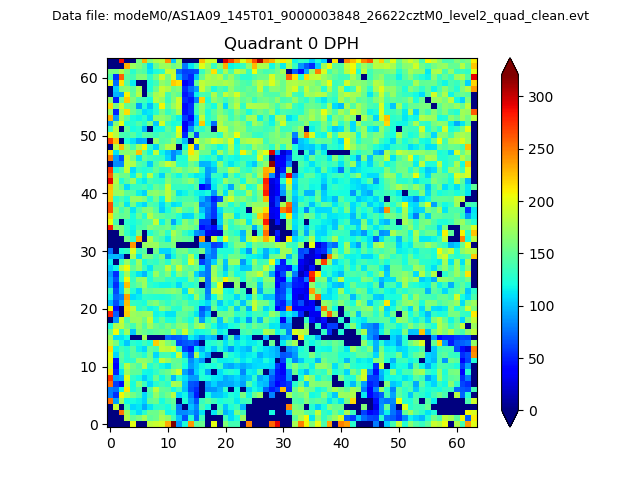 |
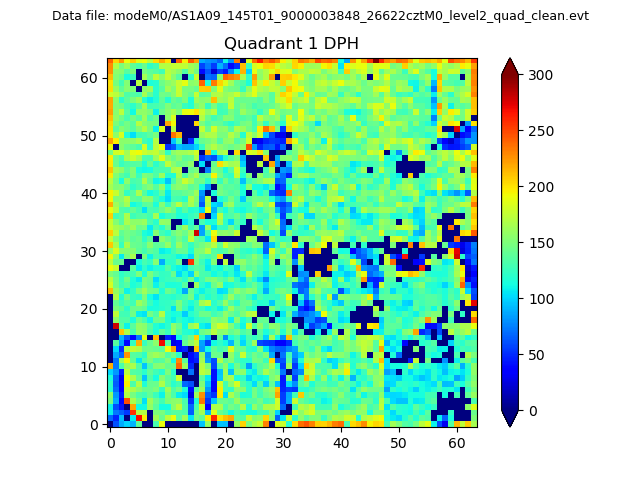 |
Quadrant B |
|---|---|---|---|
| Quadrant D | 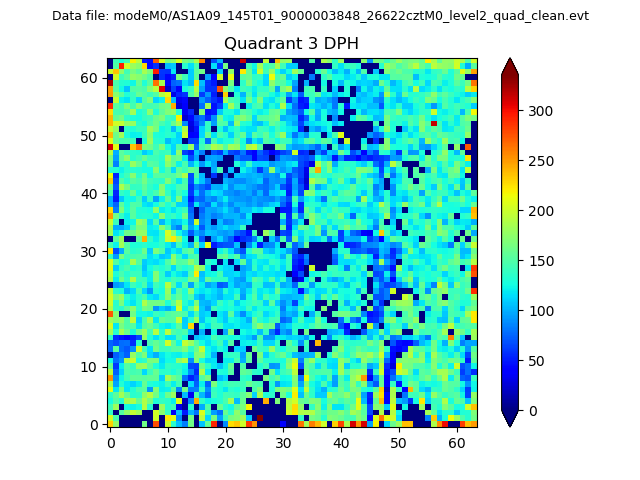 |
 |
Quadrant C |
| Plot type | Count rate plots | Images |
|---|---|---|
| Comparison with Poisson distribution Blue bars denote a histogram of data divided into 1 sec bins. Red curve is a Poisson curve with rate = median count rate of data. |
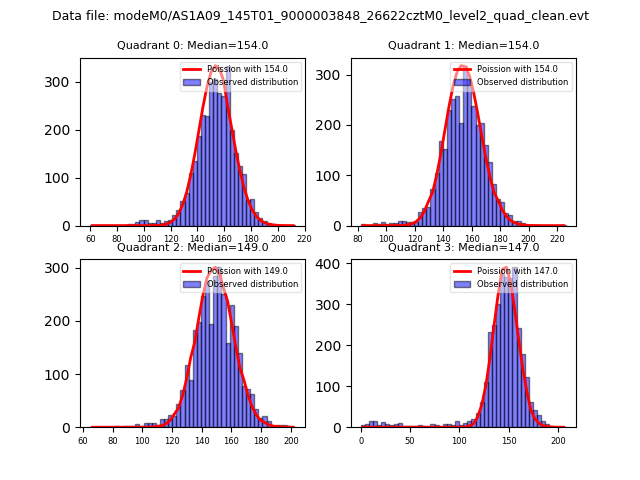 |
 |
| Quadrant-wise count rates Data is divided into 100 sec bins |
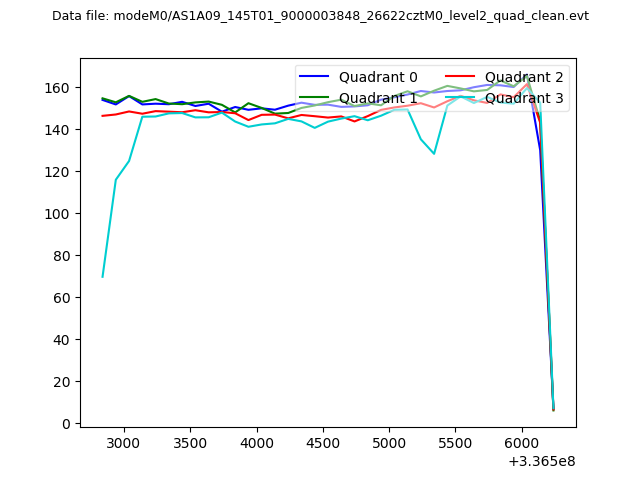 |
|
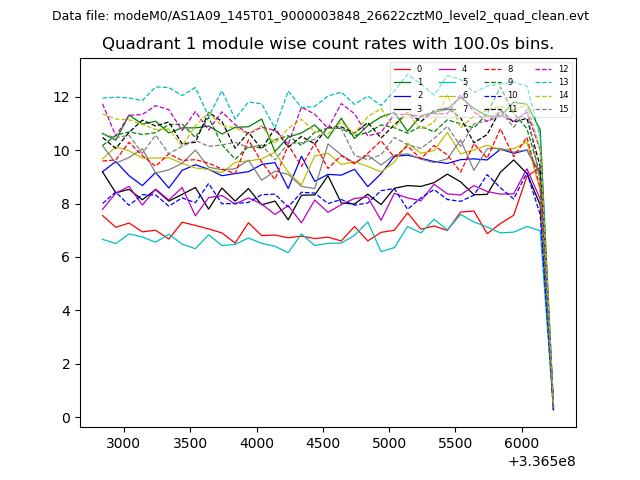
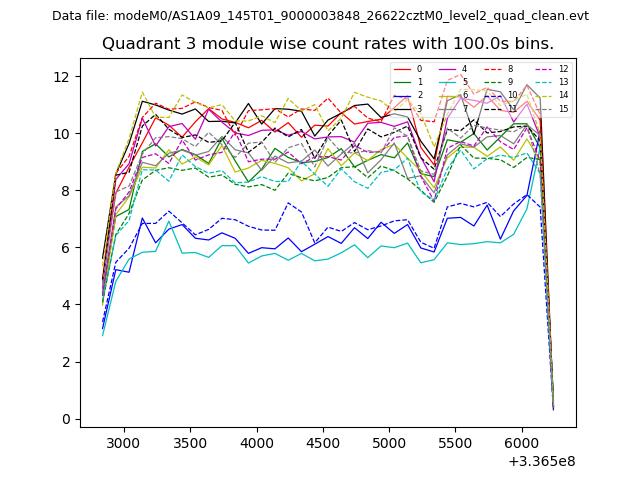
| Module-wise count rates for Quadrant A Data is divided into 100 sec bins |
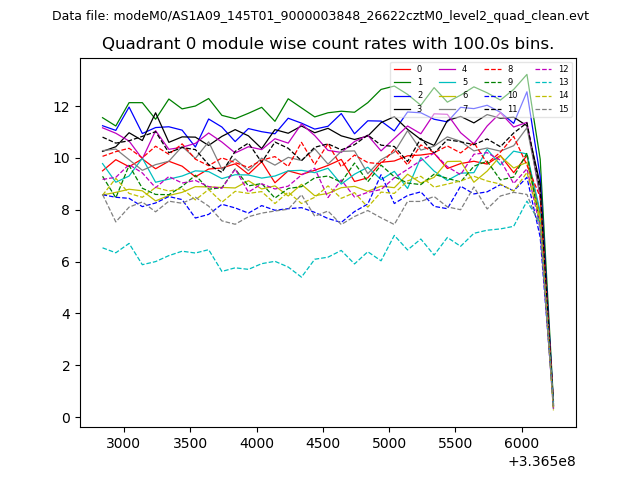 |
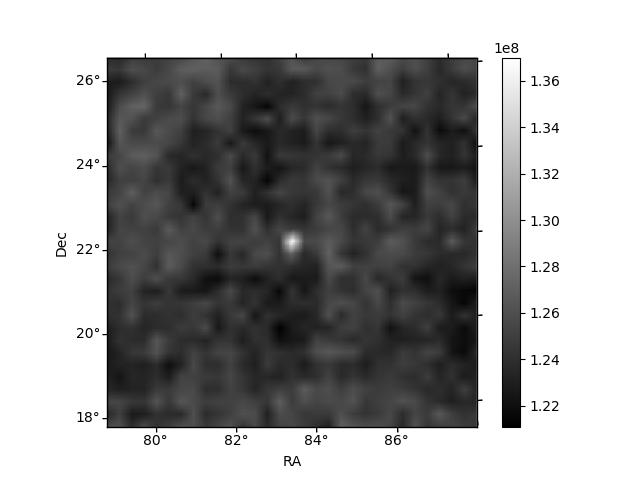 |
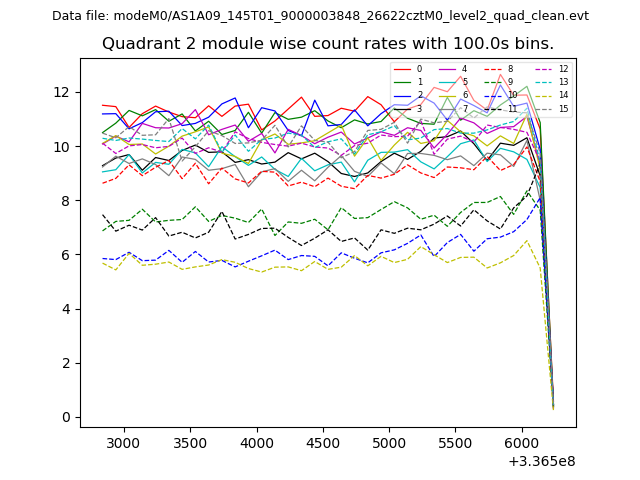
| Module-wise count rates for Quadrant B Data is divided into 100 sec bins |
 |
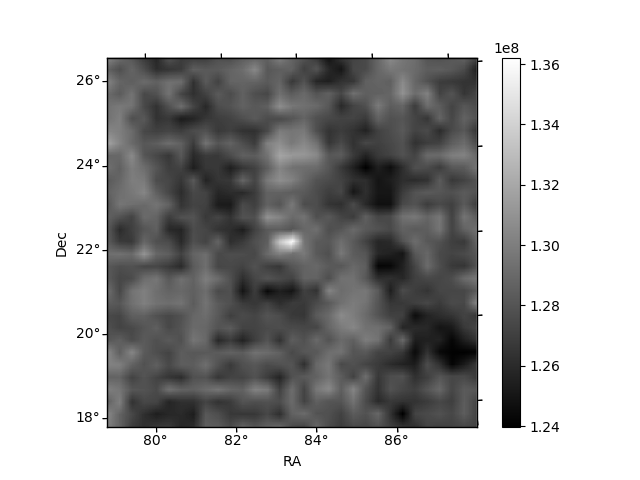 |
| Module-wise count rates for Quadrant C Data is divided into 100 sec bins |
 |
 |
| Module-wise count rates for Quadrant D Data is divided into 100 sec bins |
 |
 |
| Parameter | Plot |
|---|---|
| CZT HV Monitor | 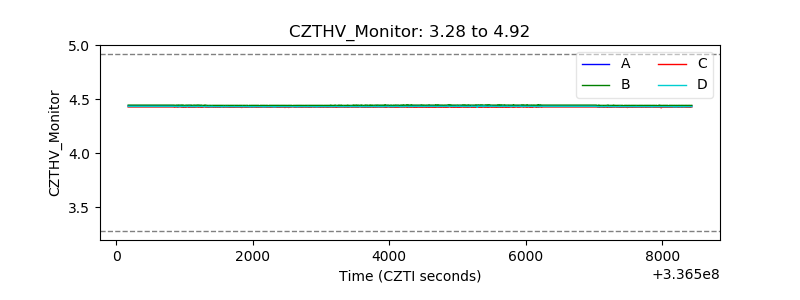 |
| D_VDD | 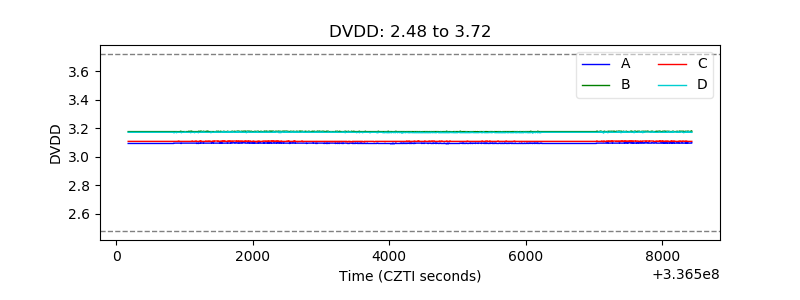 |
| Temperature 1 | 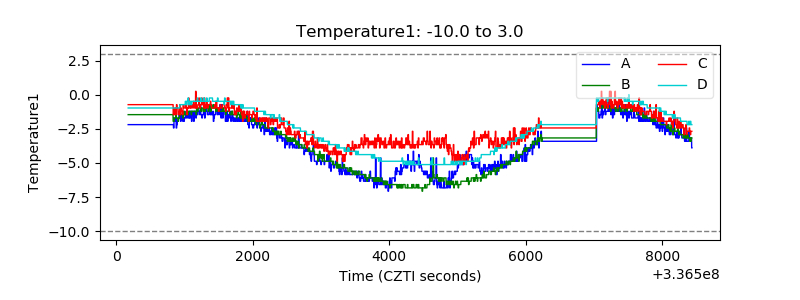 |
| Veto HV Monitor | 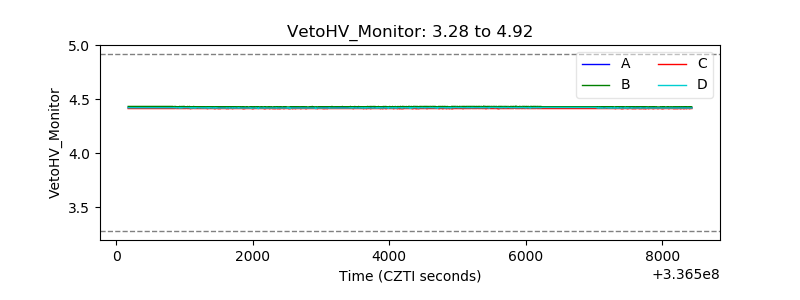 |
| Veto LLD | 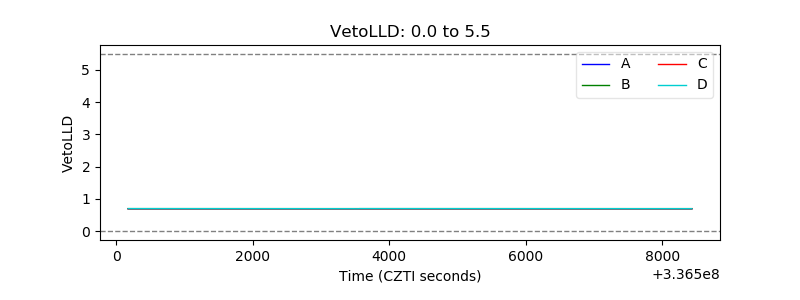 |
| Alpha Counter | 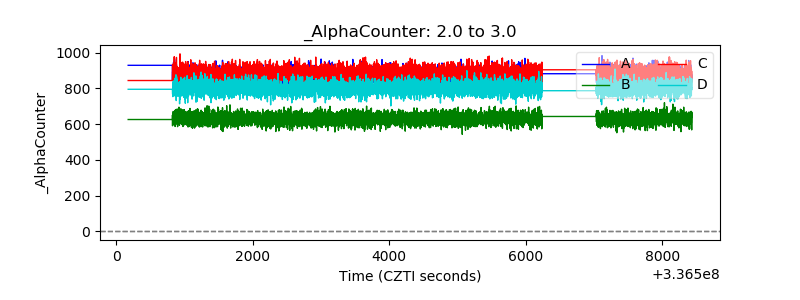 |
| _CPM_Rate | 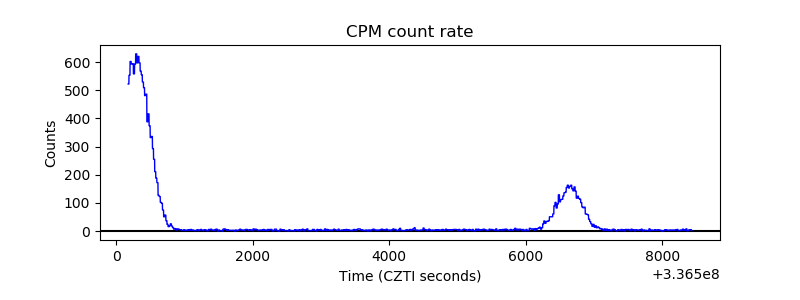 |
| CZT Counter | 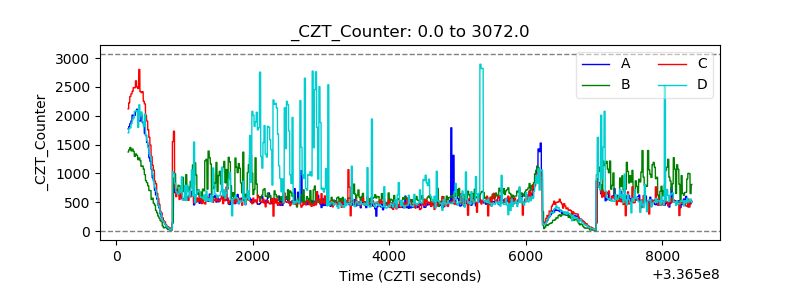 |
| +2.5 Volts monitor | 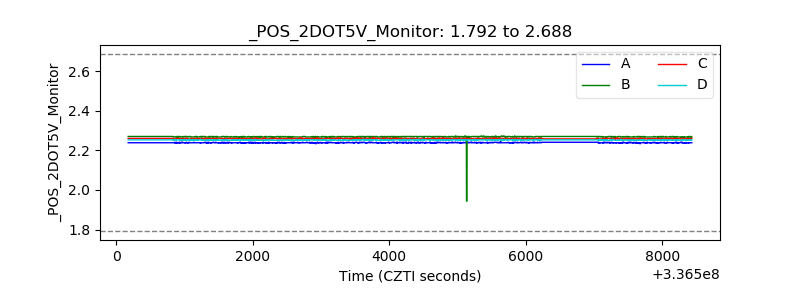 |
| +5 Volts monitor | 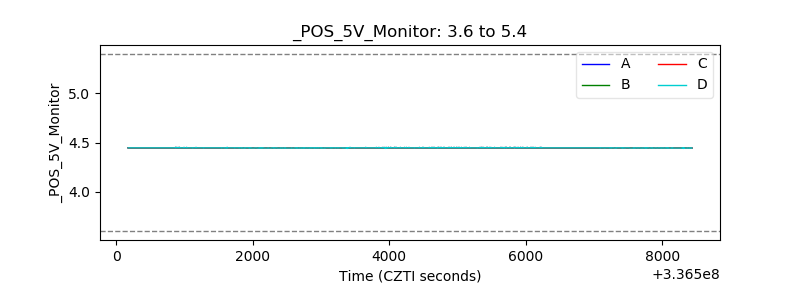 |
| _ROLL_ROT | 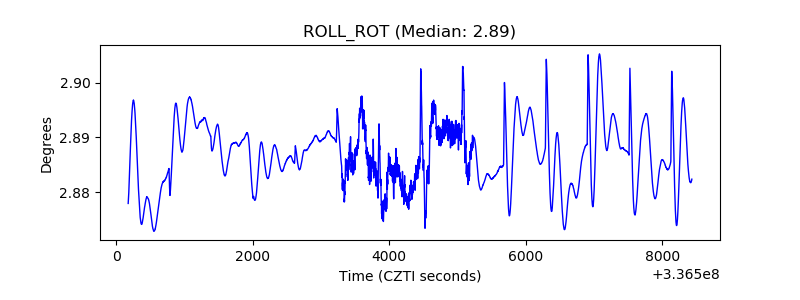 |
| _Roll_DEC | 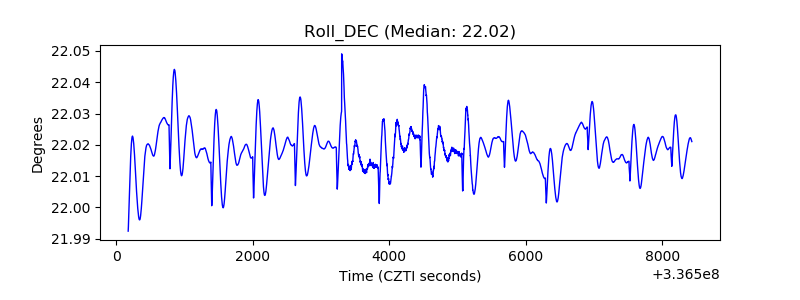 |
| _Roll_RA | 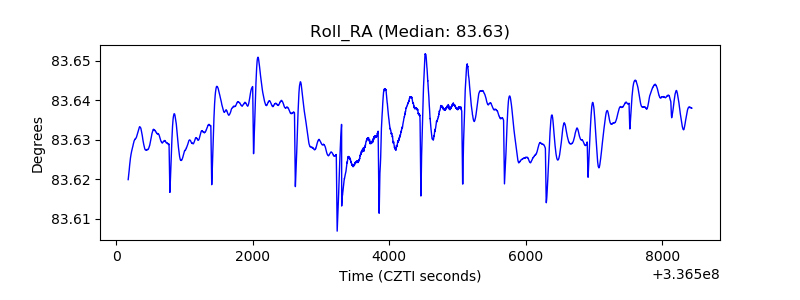 |
| Veto Counter |  |