| Param | Original file | Final file |
|---|---|---|
| Filename | modeM0/AS1A09_145T01_9000003848_26623cztM0_level2.evt | modeM0/AS1A09_145T01_9000003848_26623cztM0_level2_quad_clean.evt |
| Size (bytes) | 643,317,120 | 87,719,040 |
| Size | 613.5 MB | 83.7 MB |
| Events in quadrant A | 3,371,105 | 570,310 |
| Events in quadrant B | 5,488,793 | 566,019 |
| Events in quadrant C | 3,506,351 | 551,191 |
| Events in quadrant D | 6,664,513 | 502,688 |
| Mode M0 | |||
|---|---|---|---|
| Quadrant | BADHDUFLAG | Total packets | Discarded packets |
| A | 0 | 13950 | 0 |
| B | 0 | 20962 | 0 |
| C | 0 | 14294 | 0 |
| D | 0 | 24390 | 0 |
| Mode M9 | |||
|---|---|---|---|
| Quadrant | BADHDUFLAG | Total packets | Discarded packets |
| A | 0 | 5 | 0 |
| B | 0 | 5 | 0 |
| C | 0 | 5 | 0 |
| D | 0 | 5 | 0 |
| Quadrant | Total seconds | Saturated seconds | Saturation percentage |
|---|---|---|---|
| A | 6691 | 93 | 1.389927% |
| B | 6692 | 474 | 7.083084% |
| C | 6692 | 147 | 2.196653% |
| D | 6692 | 820 | 12.253437% |
Noise dominated data is calculated using 1-second bins in cleaned event files. If a bin has >2000 counts, and if more than 50% of those come from <1% of pixels, then it is considered to be noise-dominated and hence unusable.
| Quadrant | # 1 sec bins | Bins with >0 counts | Bins with >2000 counts | High rate bins dominated by noise | Noise dominated (total time) | Noise dominated (detector-on time) | Marked lightcurve |
|---|---|---|---|---|---|---|---|
| A | 7131 | 6692 | 4 | 4 | 0.06% | 0.06% | 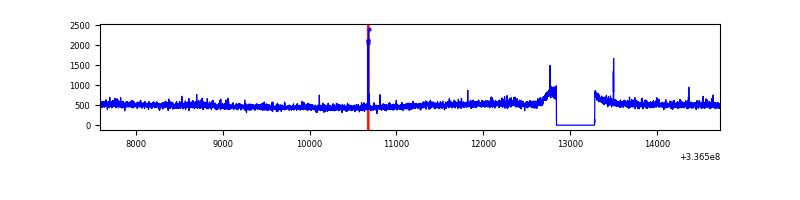 |
| B | 7132 | 6693 | 130 | 130 | 1.82% | 1.94% | 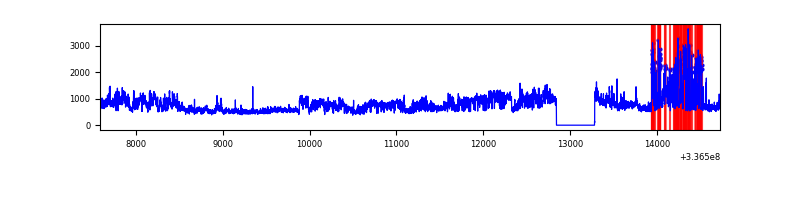 |
| C | 7132 | 6693 | 1 | 1 | 0.01% | 0.01% | 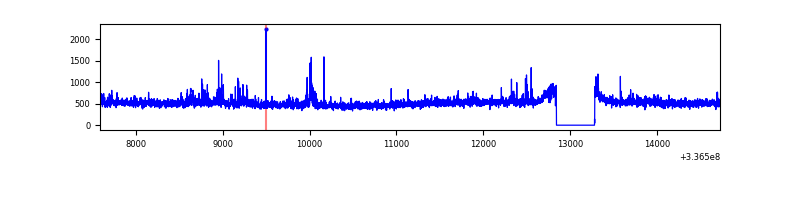 |
| D | 7132 | 6693 | 729 | 729 | 10.22% | 10.89% | 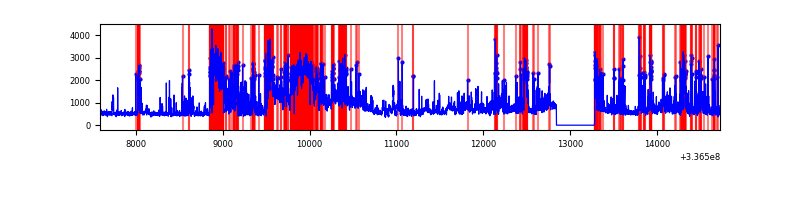 |
Top three noisy pixels from each quadrant. If the there are fewer than three noisy pixels in the level2.evt file, extra rows are filled as -1
| Pixel properties | Quadrant properties | ||||||
|---|---|---|---|---|---|---|---|
| Quadrant | DetID | PixID | Counts | Sigma | Mean | Median | Sigma |
| A | 0 | 13 | 38667 | 214.6 | 860 | 843 | 176.2 |
| A | 5 | 168 | 15235 | 81.66 | 860 | 843 | 176.2 |
| A | 13 | 254 | 12084 | 63.78 | 860 | 843 | 176.2 |
| B | 0 | 189 | 1762901 | 11093.42 | 835 | 814 | 158.8 |
| B | 5 | 172 | 390692 | 2454.52 | 835 | 814 | 158.8 |
| B | 12 | 111 | 18437 | 110.95 | 835 | 814 | 158.8 |
| C | 3 | 233 | 149822 | 773.92 | 820 | 828 | 192.5 |
| C | 14 | 238 | 132274 | 682.77 | 820 | 828 | 192.5 |
| C | 15 | 208 | 20181 | 100.52 | 820 | 828 | 192.5 |
| D | 7 | 80 | 1574198 | 8145.78 | 798 | 780 | 193.2 |
| D | 1 | 52 | 1291458 | 6682.0 | 798 | 780 | 193.2 |
| D | 2 | 250 | 499660 | 2582.76 | 798 | 780 | 193.2 |
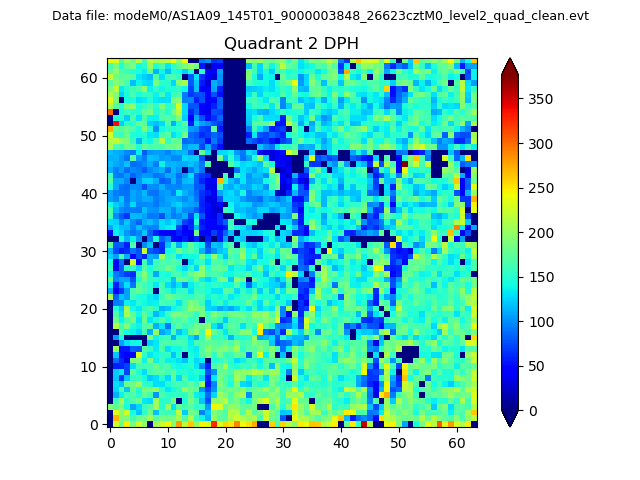
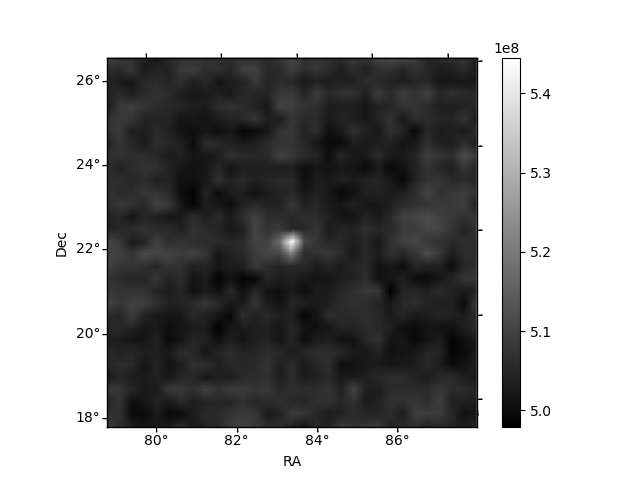
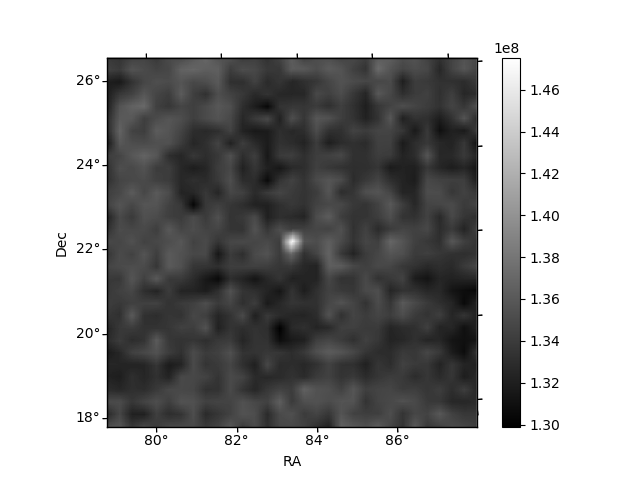
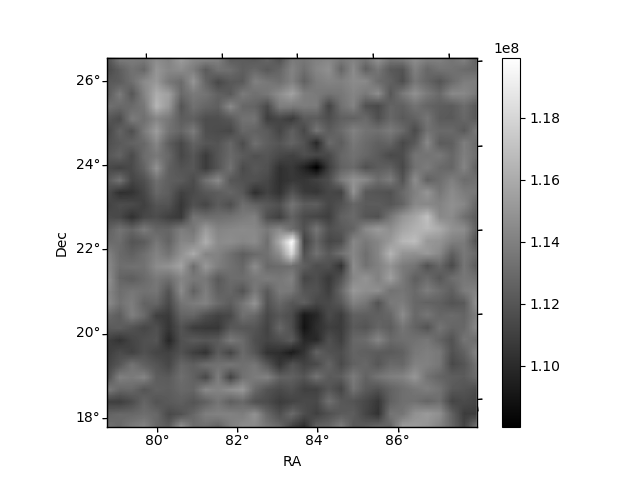
Histogram calculated using DETX and DETY for each event in the final _common_clean file
| Quadrant A | 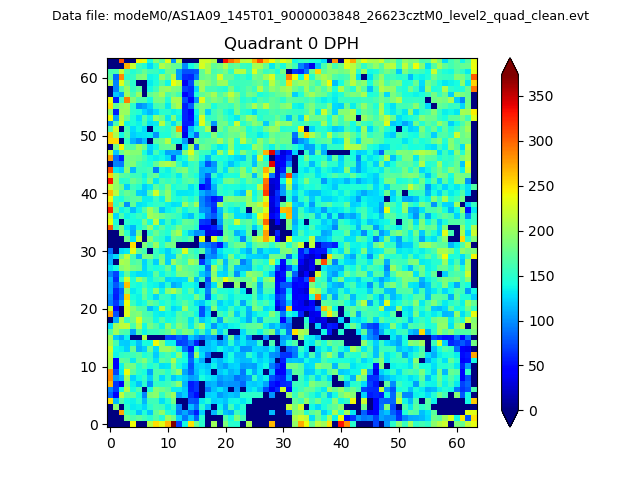 |
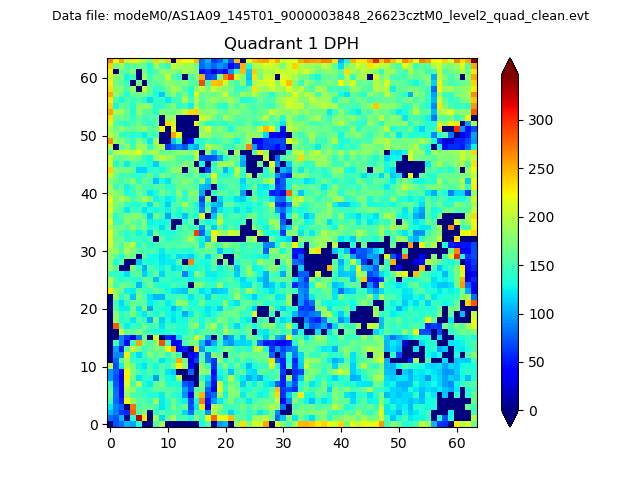 |
Quadrant B |
|---|---|---|---|
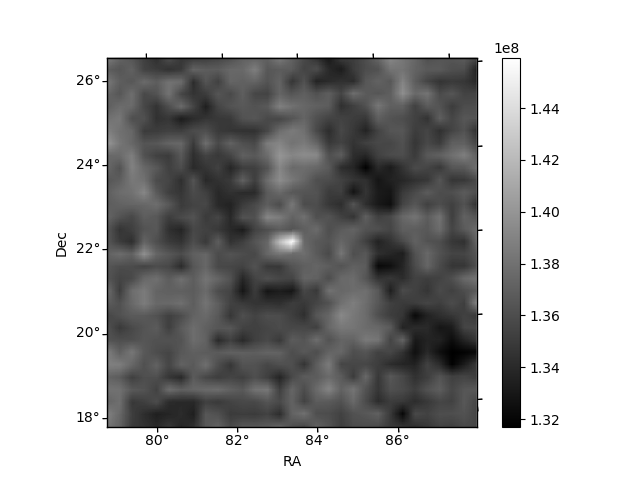
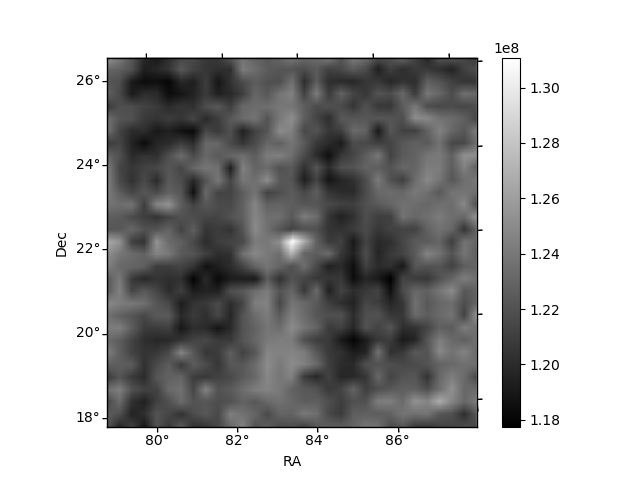
| Quadrant D | 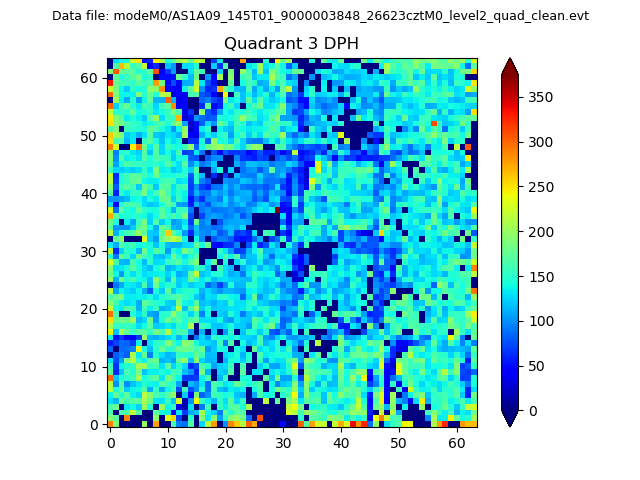 |
 |
Quadrant C |
| Plot type | Count rate plots | Images |
|---|---|---|
| Comparison with Poisson distribution Blue bars denote a histogram of data divided into 1 sec bins. Red curve is a Poisson curve with rate = median count rate of data. |
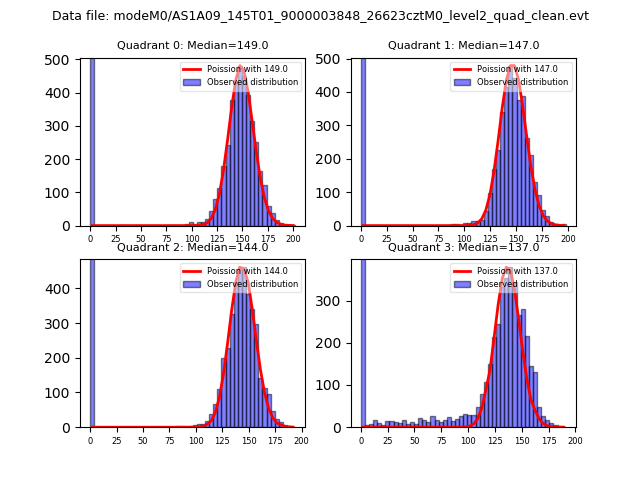 |
 |
| Quadrant-wise count rates Data is divided into 100 sec bins |
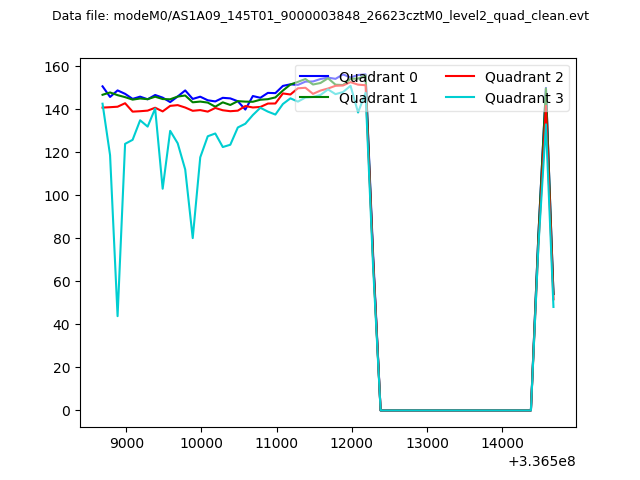 |
|
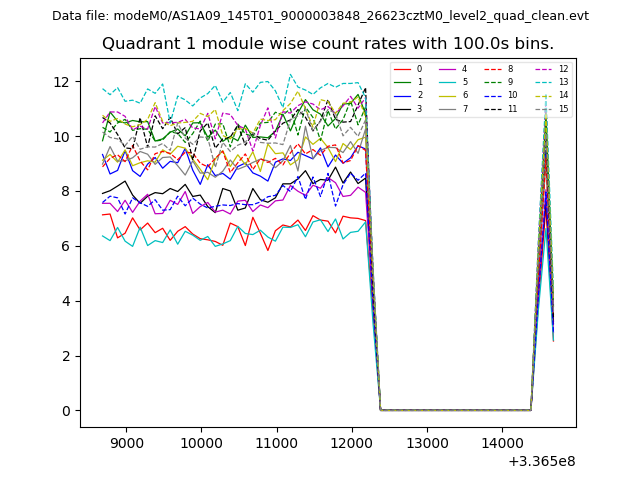
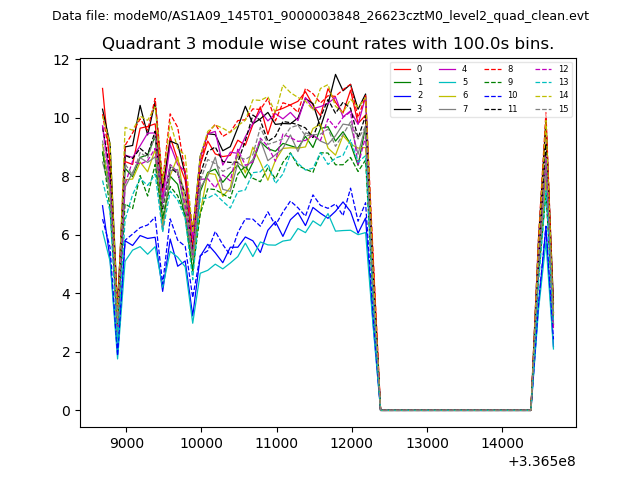
| Module-wise count rates for Quadrant A Data is divided into 100 sec bins |
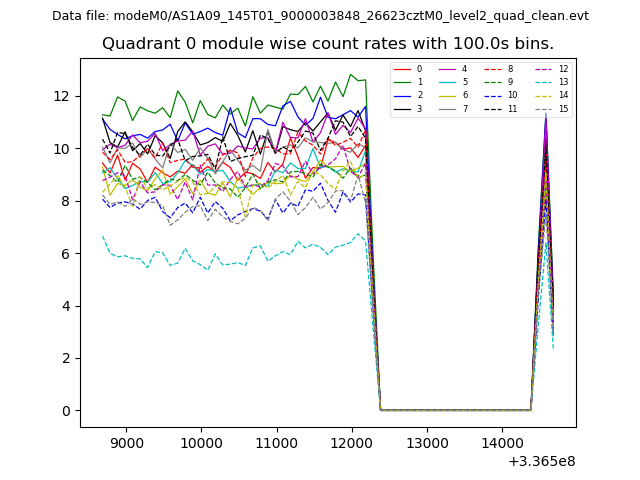 |
 |
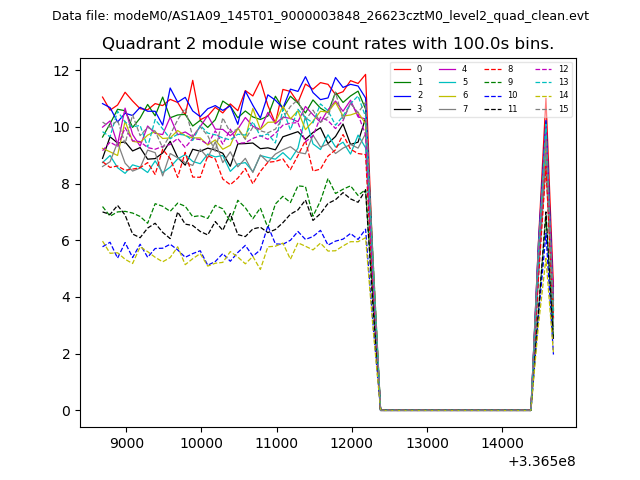
| Module-wise count rates for Quadrant B Data is divided into 100 sec bins |
 |
 |
| Module-wise count rates for Quadrant C Data is divided into 100 sec bins |
 |
 |
| Module-wise count rates for Quadrant D Data is divided into 100 sec bins |
 |
 |
| Parameter | Plot |
|---|---|
| CZT HV Monitor | 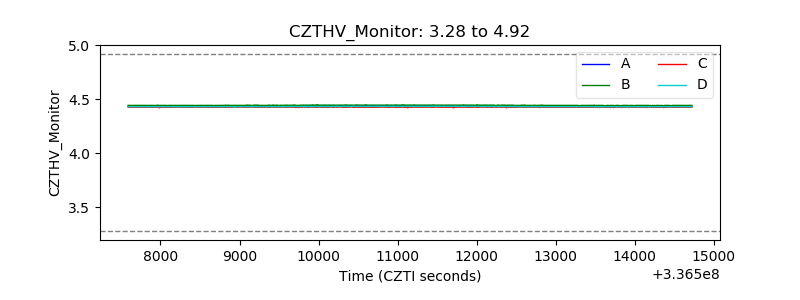 |
| D_VDD | 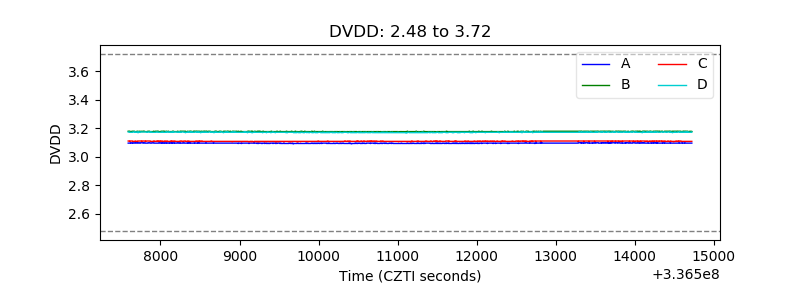 |
| Temperature 1 | 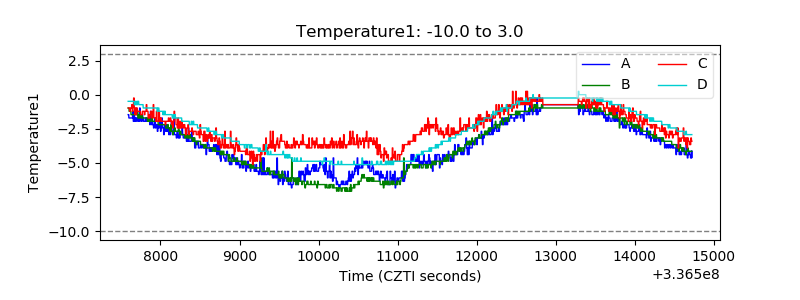 |
| Veto HV Monitor | 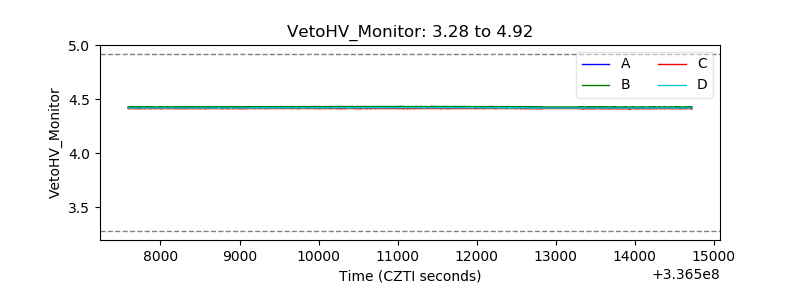 |
| Veto LLD | 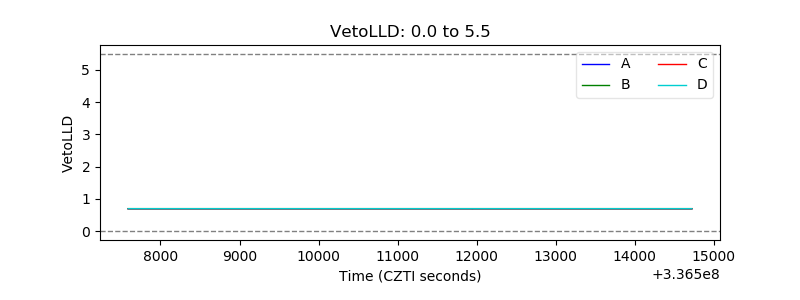 |
| Alpha Counter | 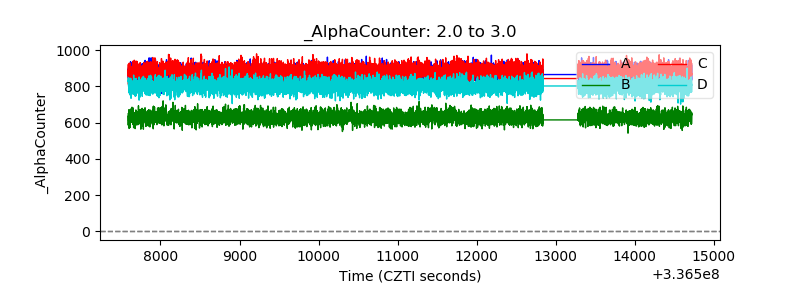 |
| _CPM_Rate | 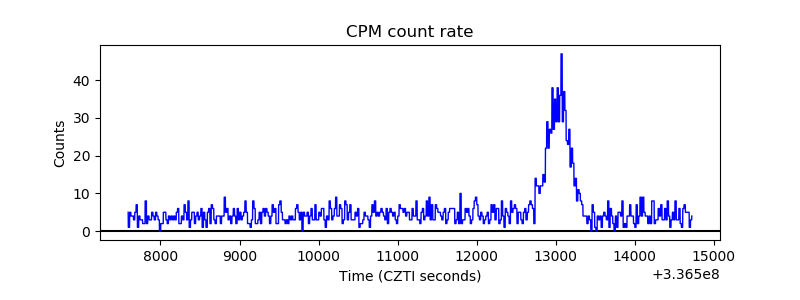 |
| CZT Counter | 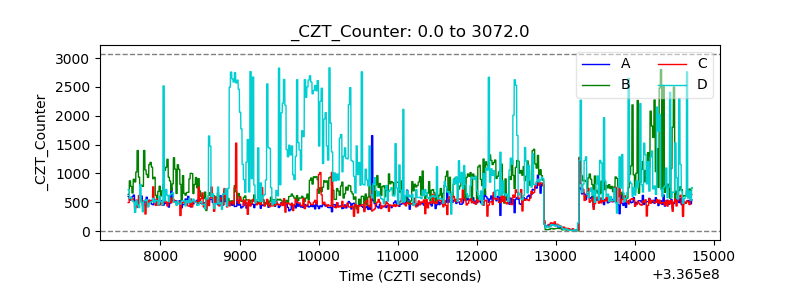 |
| +2.5 Volts monitor |  |
| +5 Volts monitor |  |
| _ROLL_ROT | 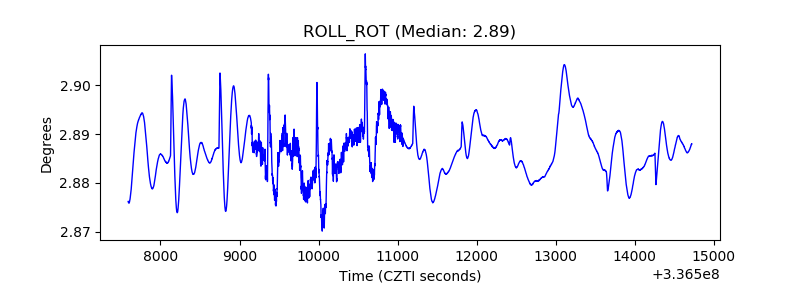 |
| _Roll_DEC |  |
| _Roll_RA | 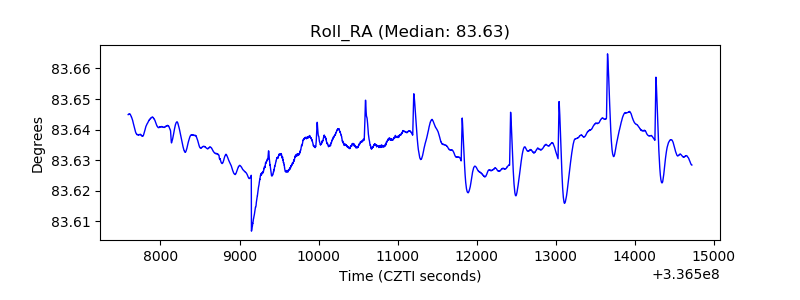 |
| Veto Counter | 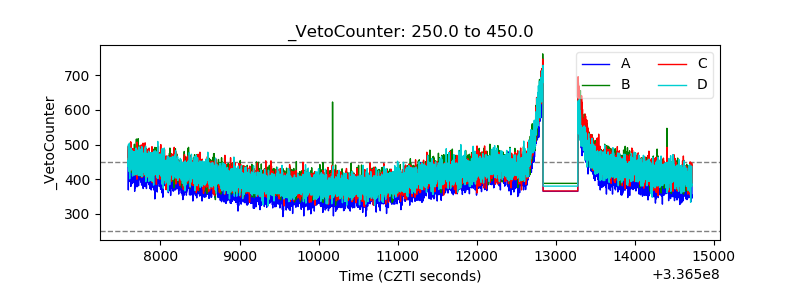 |