| Param | Original file | Final file |
|---|---|---|
| Filename | modeM0/AS1A09_145T01_9000003848_26624cztM0_level2.evt | modeM0/AS1A09_145T01_9000003848_26624cztM0_level2_quad_clean.evt |
| Size (bytes) | 729,008,640 | 92,318,400 |
| Size | 695.2 MB | 88.0 MB |
| Events in quadrant A | 3,881,802 | 629,462 |
| Events in quadrant B | 4,963,063 | 629,928 |
| Events in quadrant C | 3,463,256 | 609,527 |
| Events in quadrant D | 9,302,816 | 444,780 |
| Mode M0 | |||
|---|---|---|---|
| Quadrant | BADHDUFLAG | Total packets | Discarded packets |
| A | 0 | 15734 | 0 |
| B | 0 | 19481 | 0 |
| C | 0 | 14369 | 0 |
| D | 0 | 32322 | 0 |
| Mode M9 | |||
|---|---|---|---|
| Quadrant | BADHDUFLAG | Total packets | Discarded packets |
| A | 0 | 3 | 0 |
| B | 0 | 3 | 0 |
| C | 0 | 3 | 0 |
| D | 0 | 3 | 0 |
| Quadrant | Total seconds | Saturated seconds | Saturation percentage |
|---|---|---|---|
| A | 6902 | 147 | 2.129817% |
| B | 6903 | 325 | 4.708098% |
| C | 6903 | 92 | 1.332754% |
| D | 6903 | 2216 | 32.101985% |
Noise dominated data is calculated using 1-second bins in cleaned event files. If a bin has >2000 counts, and if more than 50% of those come from <1% of pixels, then it is considered to be noise-dominated and hence unusable.
| Quadrant | # 1 sec bins | Bins with >0 counts | Bins with >2000 counts | High rate bins dominated by noise | Noise dominated (total time) | Noise dominated (detector-on time) | Marked lightcurve |
|---|---|---|---|---|---|---|---|
| A | 7237 | 6903 | 70 | 70 | 0.97% | 1.01% | 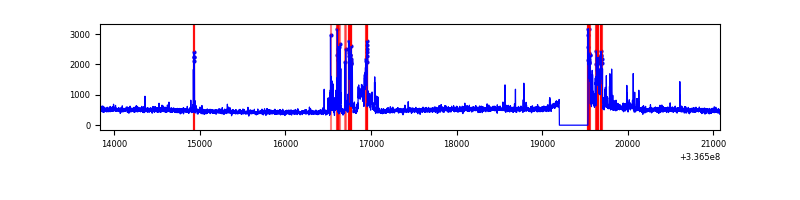 |
| B | 7238 | 6904 | 153 | 153 | 2.11% | 2.22% | 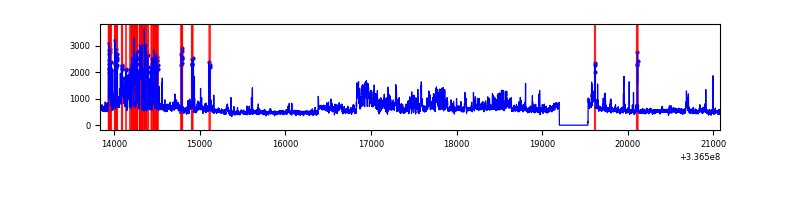 |
| C | 7238 | 6904 | 3 | 3 | 0.04% | 0.04% | 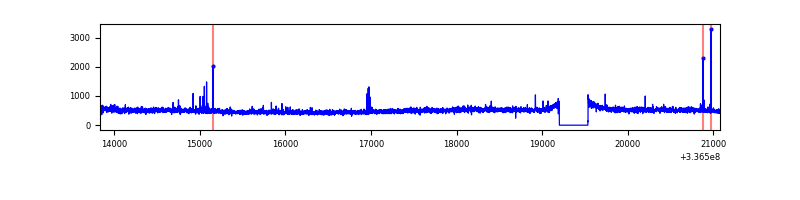 |
| D | 7238 | 6904 | 1960 | 1960 | 27.08% | 28.39% | 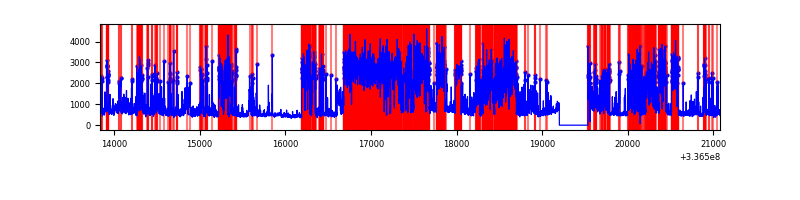 |
Top three noisy pixels from each quadrant. If the there are fewer than three noisy pixels in the level2.evt file, extra rows are filled as -1
| Pixel properties | Quadrant properties | ||||||
|---|---|---|---|---|---|---|---|
| Quadrant | DetID | PixID | Counts | Sigma | Mean | Median | Sigma |
| A | 0 | 13 | 531556 | 3019.48 | 865 | 849 | 175.8 |
| A | 13 | 254 | 12802 | 68.01 | 865 | 849 | 175.8 |
| A | 5 | 168 | 9055 | 46.69 | 865 | 849 | 175.8 |
| B | 0 | 189 | 1085785 | 6665.69 | 855 | 837 | 162.8 |
| B | 5 | 172 | 457827 | 2807.65 | 855 | 837 | 162.8 |
| B | 0 | 244 | 23803 | 141.1 | 855 | 837 | 162.8 |
| C | 14 | 238 | 135743 | 677.61 | 836 | 843 | 199.1 |
| C | 15 | 208 | 33715 | 165.12 | 836 | 843 | 199.1 |
| C | 3 | 233 | 33194 | 162.5 | 836 | 843 | 199.1 |
| D | 1 | 52 | 4410619 | 26306.48 | 687 | 669 | 167.6 |
| D | 7 | 80 | 1466368 | 8743.27 | 687 | 669 | 167.6 |
| D | 2 | 250 | 675302 | 4024.36 | 687 | 669 | 167.6 |
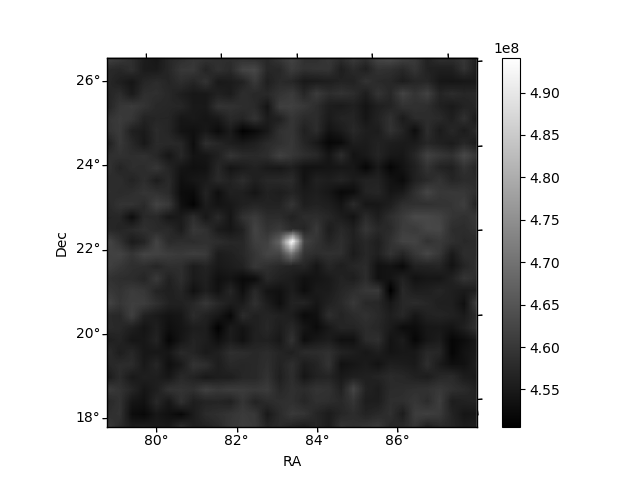
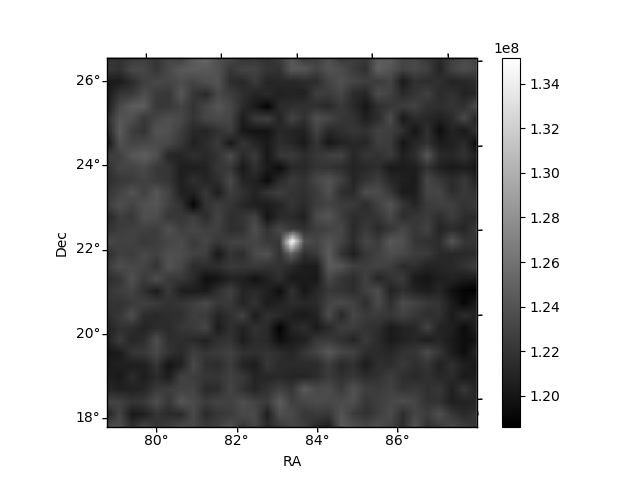
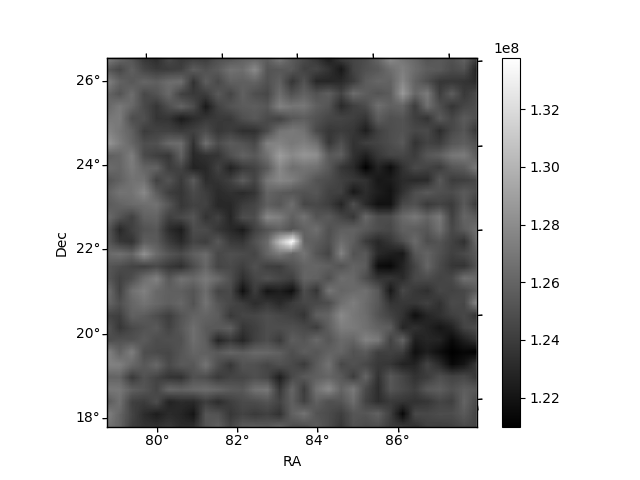
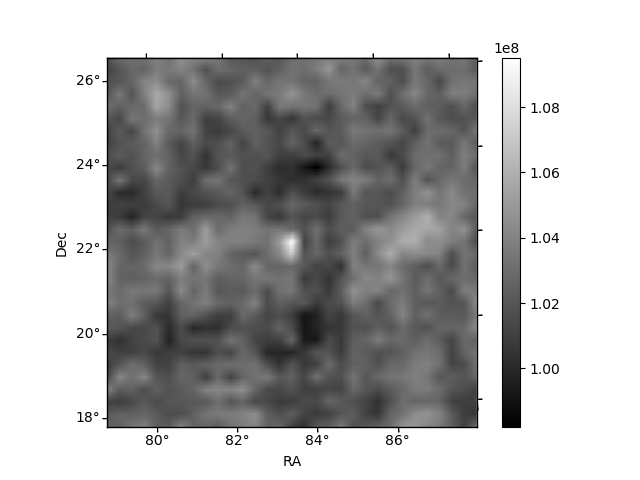
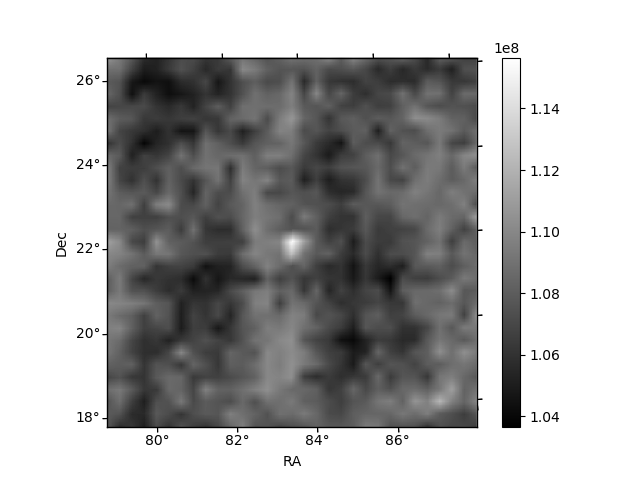
Histogram calculated using DETX and DETY for each event in the final _common_clean file
| Quadrant A | 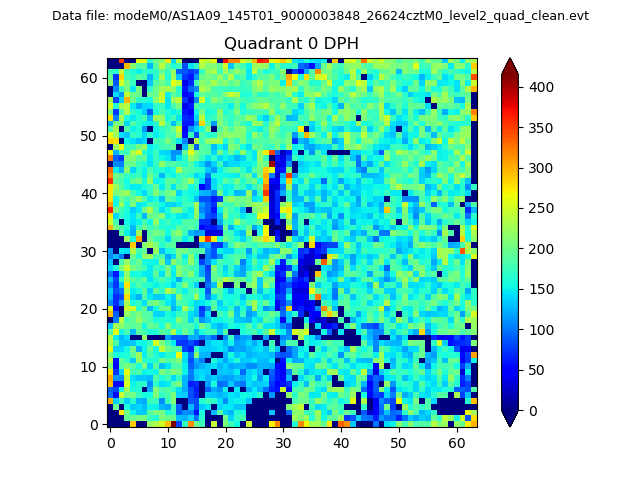 |
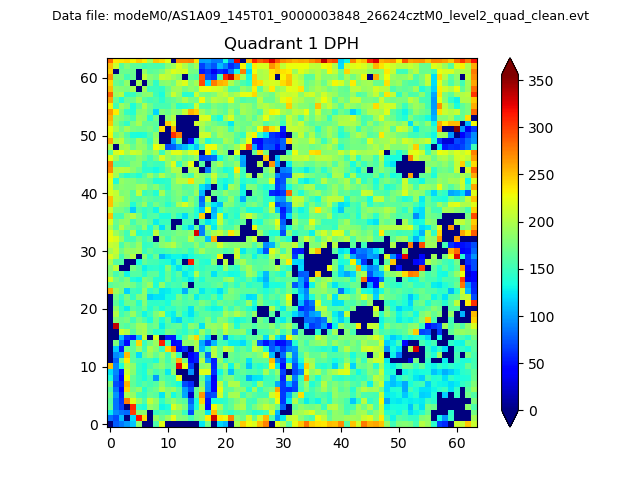 |
Quadrant B |
|---|---|---|---|
| Quadrant D |  |
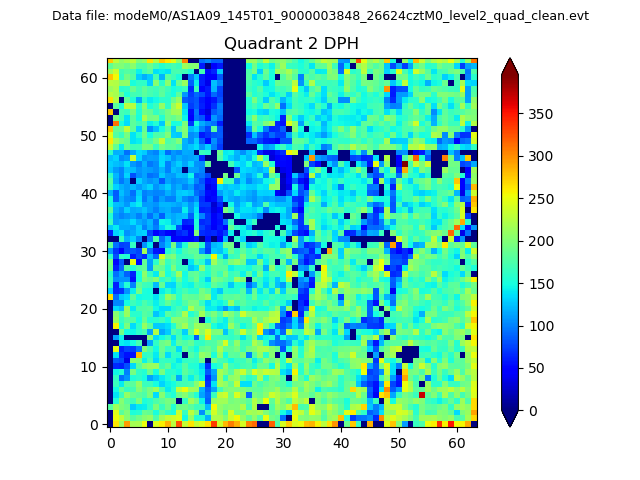 |
Quadrant C |
| Plot type | Count rate plots | Images |
|---|---|---|
| Comparison with Poisson distribution Blue bars denote a histogram of data divided into 1 sec bins. Red curve is a Poisson curve with rate = median count rate of data. |
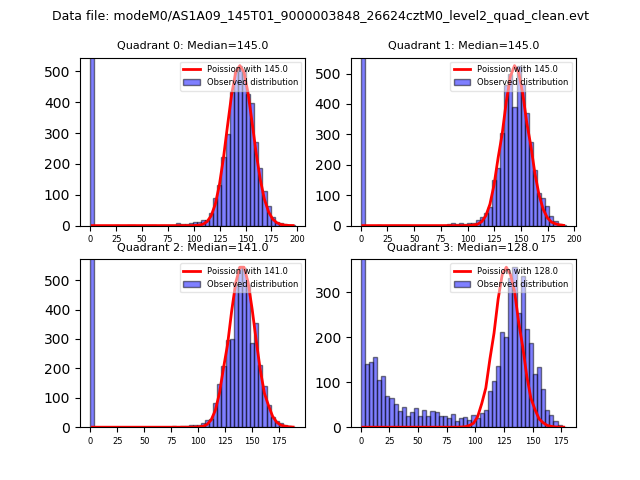 |
 |
| Quadrant-wise count rates Data is divided into 100 sec bins |
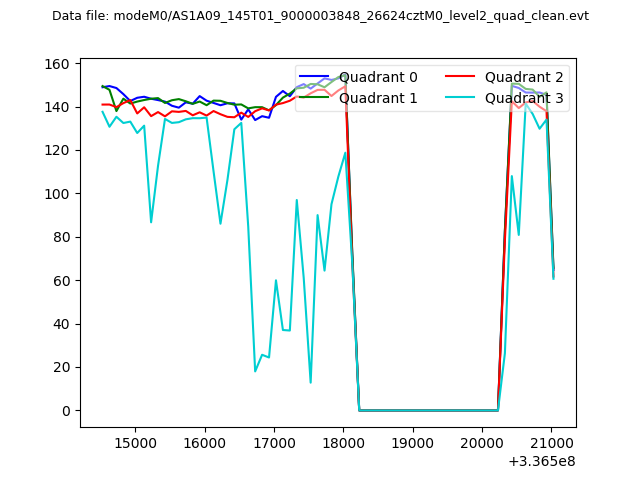 |
|
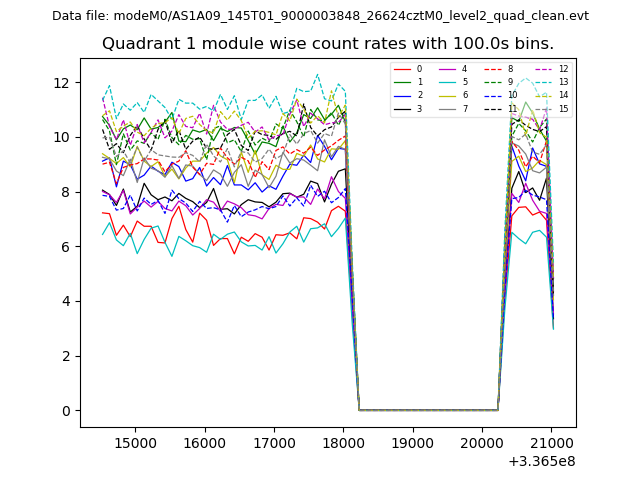
| Module-wise count rates for Quadrant A Data is divided into 100 sec bins |
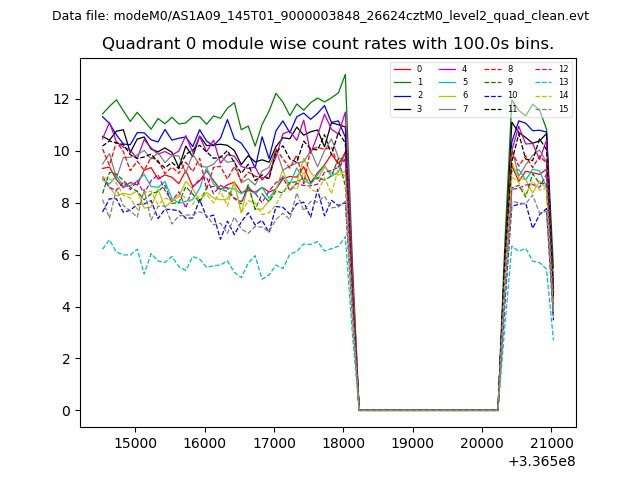 |
 |
| Module-wise count rates for Quadrant B Data is divided into 100 sec bins |
 |
 |
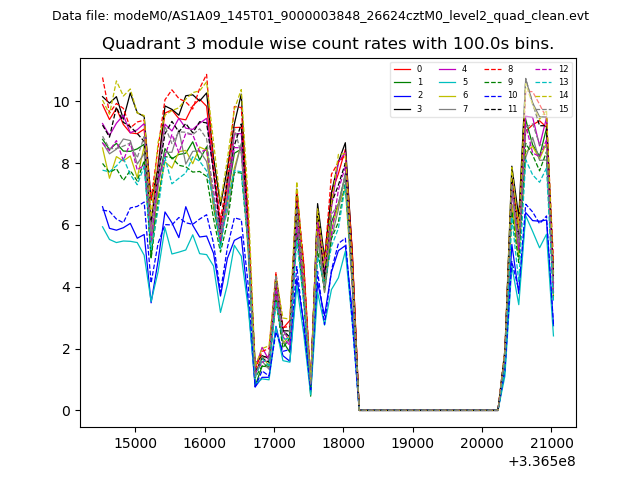
| Module-wise count rates for Quadrant C Data is divided into 100 sec bins |
 |
 |
| Module-wise count rates for Quadrant D Data is divided into 100 sec bins |
 |
 |
| Parameter | Plot |
|---|---|
| CZT HV Monitor | 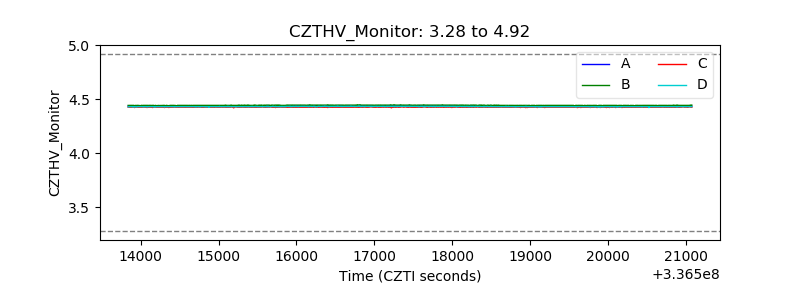 |
| D_VDD | 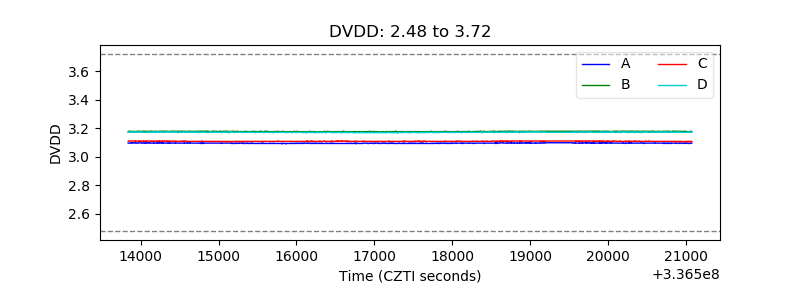 |
| Temperature 1 | 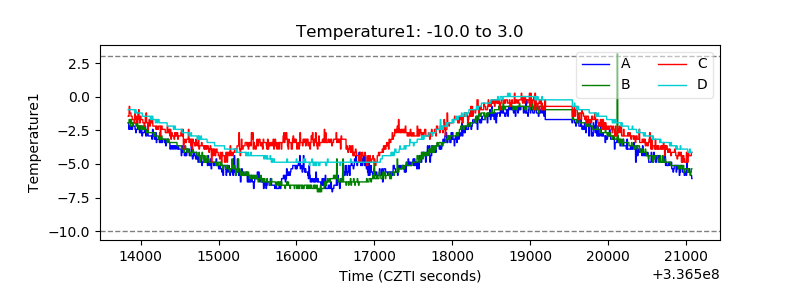 |
| Veto HV Monitor | 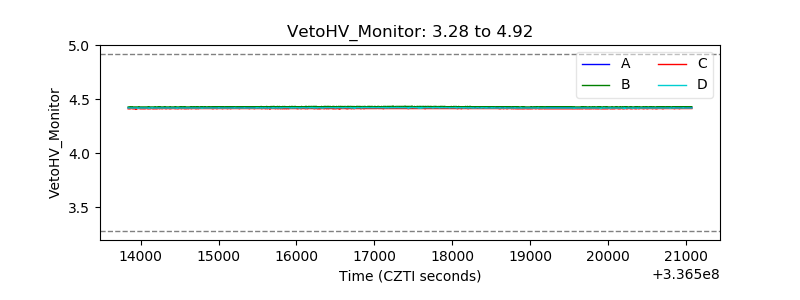 |
| Veto LLD | 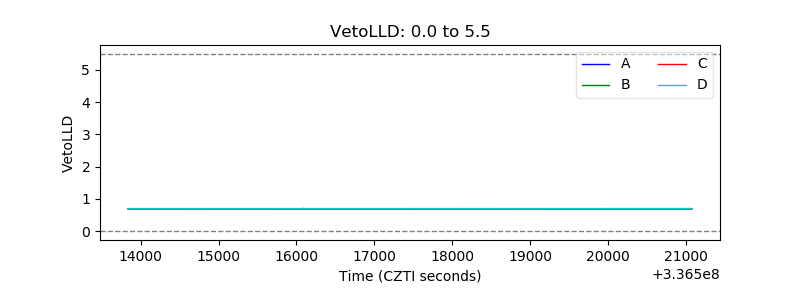 |
| Alpha Counter | 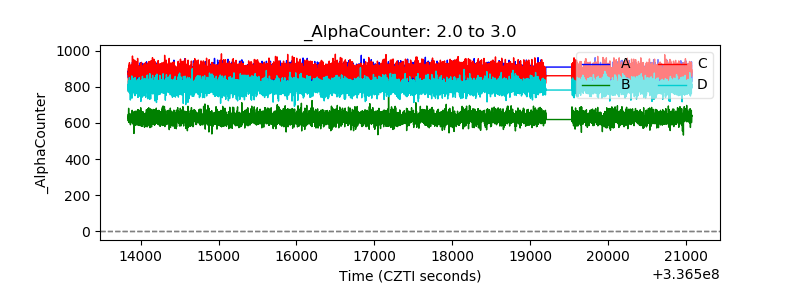 |
| _CPM_Rate |  |
| CZT Counter | 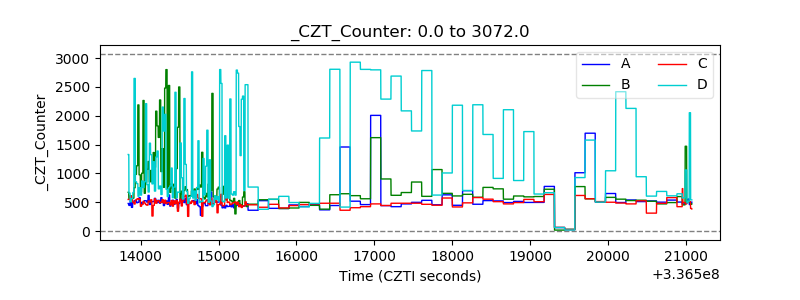 |
| +2.5 Volts monitor |  |
| +5 Volts monitor |  |
| _ROLL_ROT | 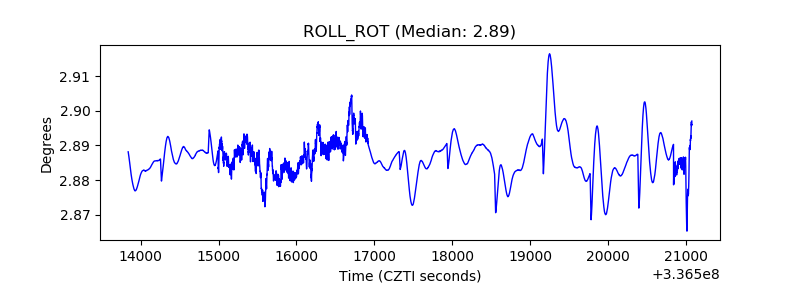 |
| _Roll_DEC | 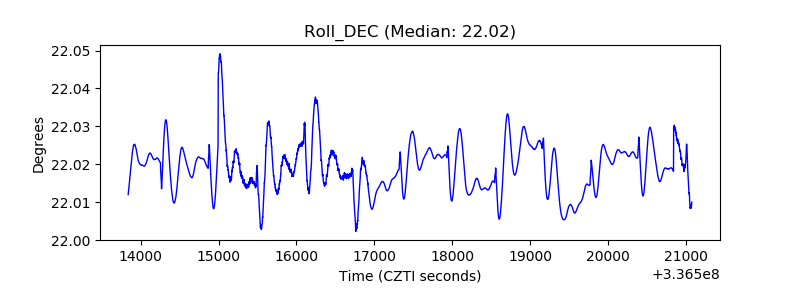 |
| _Roll_RA | 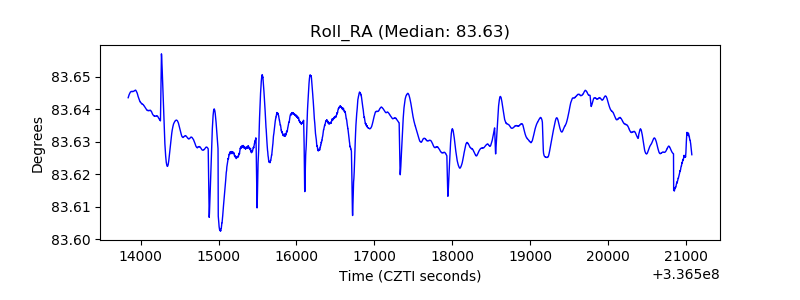 |
| Veto Counter | 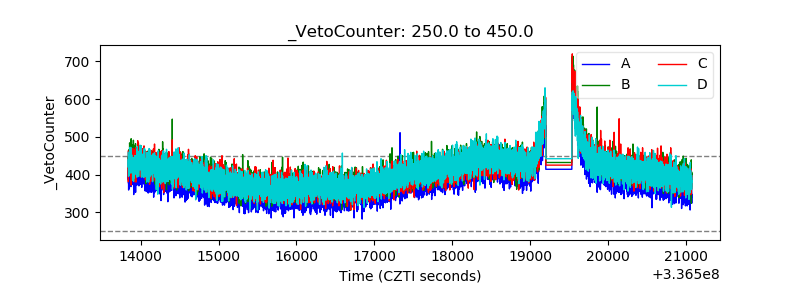 |