| Param | Original file | Final file |
|---|---|---|
| Filename | modeM0/AS1A09_145T01_9000003848_26625cztM0_level2.evt | modeM0/AS1A09_145T01_9000003848_26625cztM0_level2_quad_clean.evt |
| Size (bytes) | 657,400,320 | 105,854,400 |
| Size | 626.9 MB | 101.0 MB |
| Events in quadrant A | 3,628,905 | 709,240 |
| Events in quadrant B | 4,336,786 | 710,749 |
| Events in quadrant C | 3,665,816 | 684,783 |
| Events in quadrant D | 7,787,593 | 596,620 |
| Mode M0 | |||
|---|---|---|---|
| Quadrant | BADHDUFLAG | Total packets | Discarded packets |
| A | 0 | 15296 | 0 |
| B | 0 | 17606 | 0 |
| C | 0 | 15310 | 0 |
| D | 0 | 28129 | 0 |
| Mode M9 | |||
|---|---|---|---|
| Quadrant | BADHDUFLAG | Total packets | Discarded packets |
| A | 0 | 5 | 0 |
| B | 0 | 5 | 0 |
| C | 0 | 5 | 0 |
| D | 0 | 5 | 0 |
| Quadrant | Total seconds | Saturated seconds | Saturation percentage |
|---|---|---|---|
| A | 7242 | 37 | 0.510909% |
| B | 7243 | 97 | 1.339224% |
| C | 7242 | 101 | 1.394642% |
| D | 7242 | 1634 | 22.562828% |
Noise dominated data is calculated using 1-second bins in cleaned event files. If a bin has >2000 counts, and if more than 50% of those come from <1% of pixels, then it is considered to be noise-dominated and hence unusable.
| Quadrant | # 1 sec bins | Bins with >0 counts | Bins with >2000 counts | High rate bins dominated by noise | Noise dominated (total time) | Noise dominated (detector-on time) | Marked lightcurve |
|---|---|---|---|---|---|---|---|
| A | 7682 | 7243 | 4 | 4 | 0.05% | 0.06% | 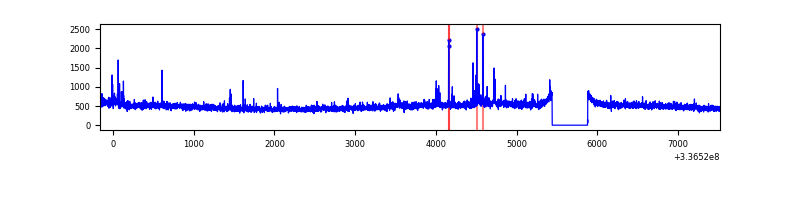 |
| B | 7683 | 7244 | 14 | 14 | 0.18% | 0.19% | 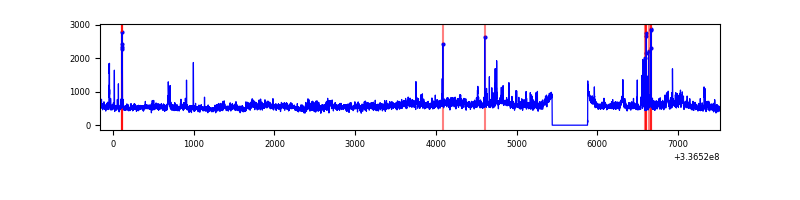 |
| C | 7682 | 7243 | 6 | 6 | 0.08% | 0.08% | 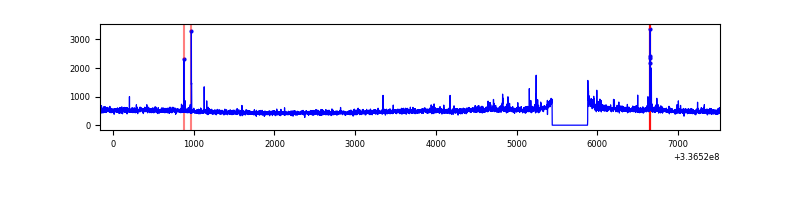 |
| D | 7682 | 7243 | 1391 | 1391 | 18.11% | 19.20% | 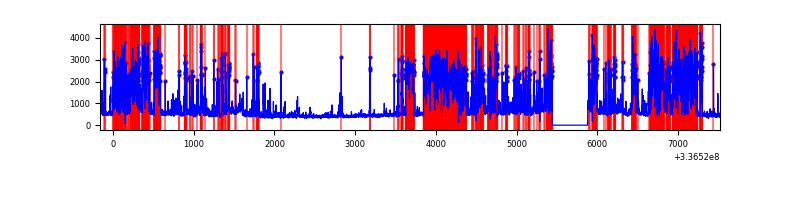 |
Top three noisy pixels from each quadrant. If the there are fewer than three noisy pixels in the level2.evt file, extra rows are filled as -1
| Pixel properties | Quadrant properties | ||||||
|---|---|---|---|---|---|---|---|
| Quadrant | DetID | PixID | Counts | Sigma | Mean | Median | Sigma |
| A | 0 | 13 | 104597 | 563.56 | 907 | 890 | 184.0 |
| A | 5 | 168 | 16550 | 85.1 | 907 | 890 | 184.0 |
| A | 13 | 254 | 12578 | 63.51 | 907 | 890 | 184.0 |
| B | 0 | 189 | 661580 | 3838.18 | 901 | 881 | 172.1 |
| B | 5 | 172 | 93633 | 538.82 | 901 | 881 | 172.1 |
| B | 0 | 244 | 20884 | 116.2 | 901 | 881 | 172.1 |
| C | 14 | 238 | 139124 | 665.27 | 870 | 877 | 207.8 |
| C | 3 | 233 | 86992 | 414.4 | 870 | 877 | 207.8 |
| C | 15 | 208 | 39044 | 183.67 | 870 | 877 | 207.8 |
| D | 1 | 52 | 2799172 | 14721.58 | 772 | 752 | 190.1 |
| D | 7 | 80 | 1500008 | 7887.1 | 772 | 752 | 190.1 |
| D | 2 | 250 | 502702 | 2640.6 | 772 | 752 | 190.1 |
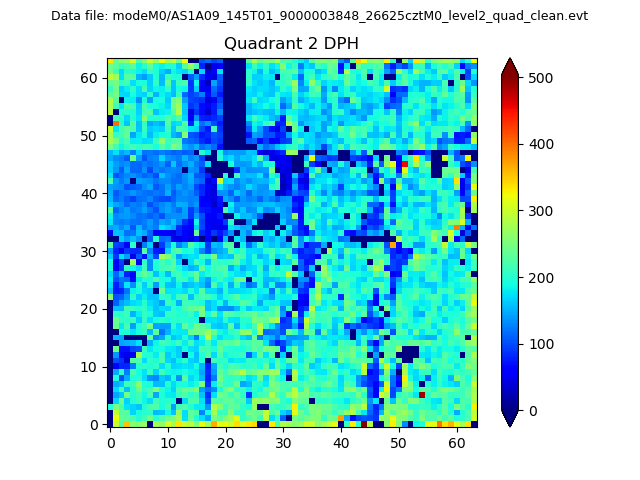
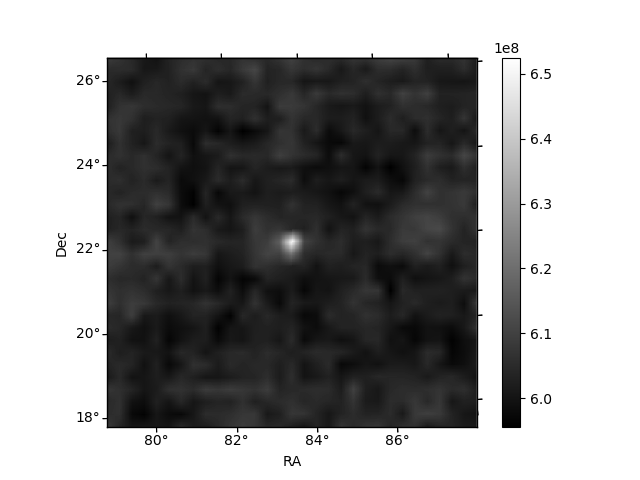
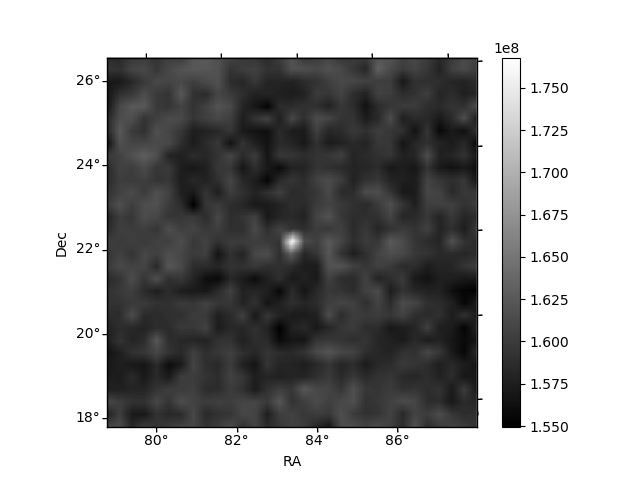
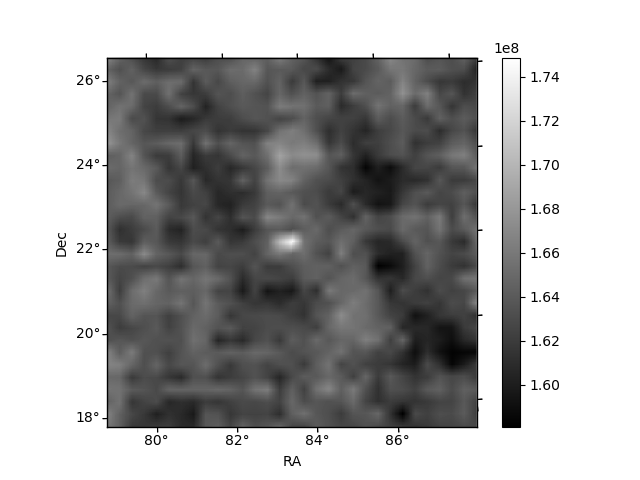
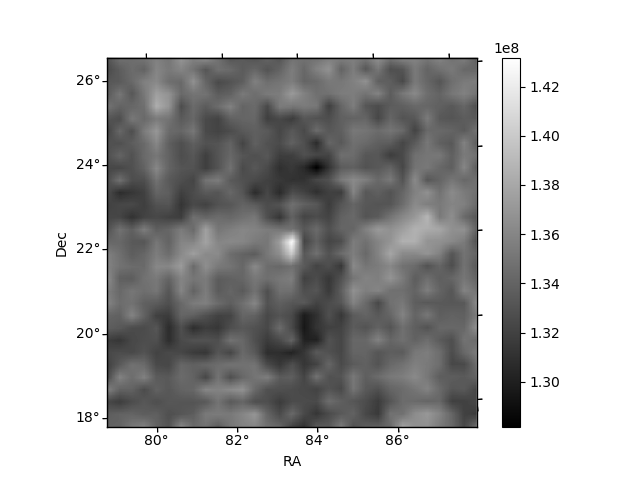
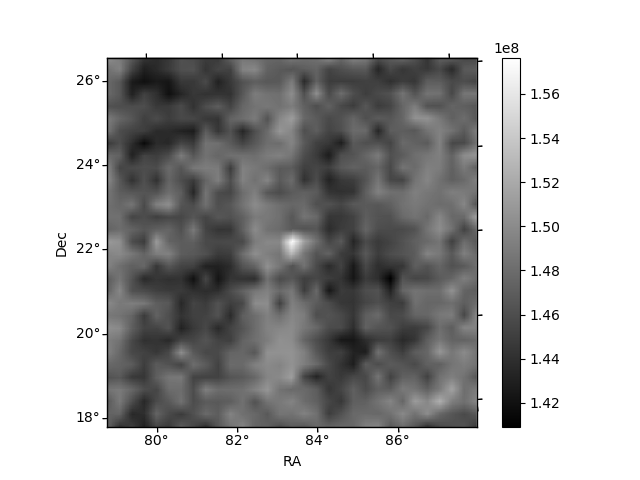
Histogram calculated using DETX and DETY for each event in the final _common_clean file
| Quadrant A | 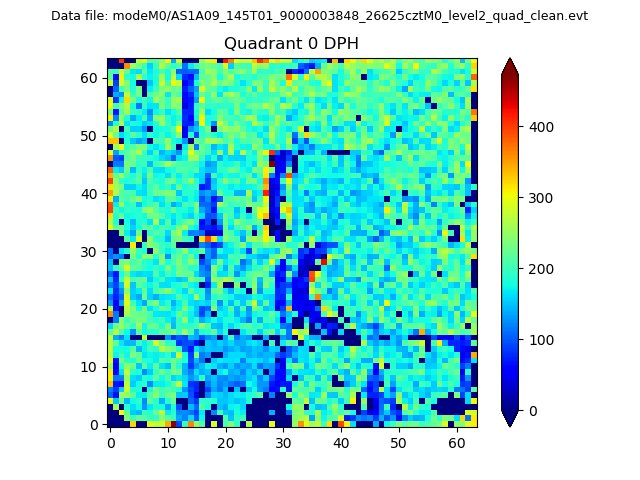 |
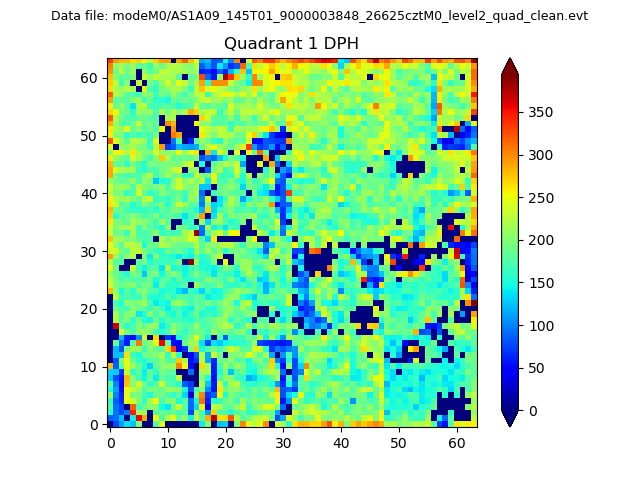 |
Quadrant B |
|---|---|---|---|
| Quadrant D | 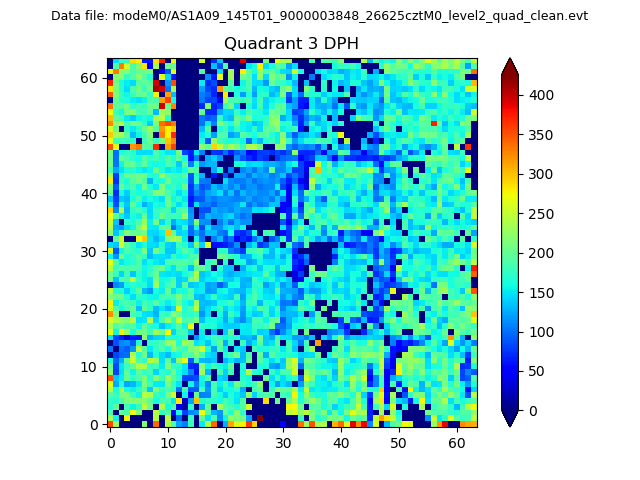 |
 |
Quadrant C |
| Plot type | Count rate plots | Images |
|---|---|---|
| Comparison with Poisson distribution Blue bars denote a histogram of data divided into 1 sec bins. Red curve is a Poisson curve with rate = median count rate of data. |
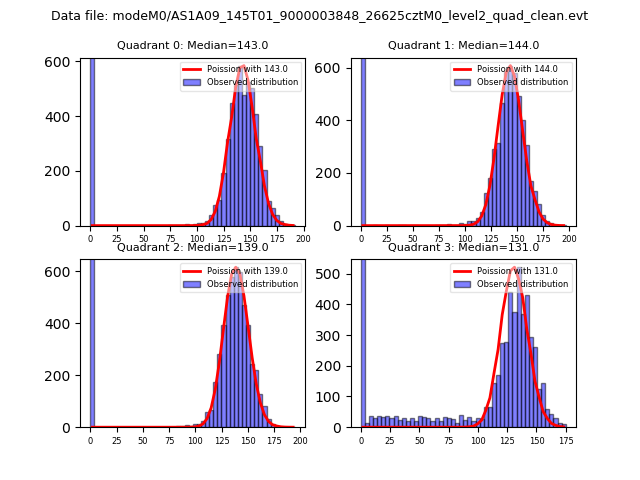 |
 |
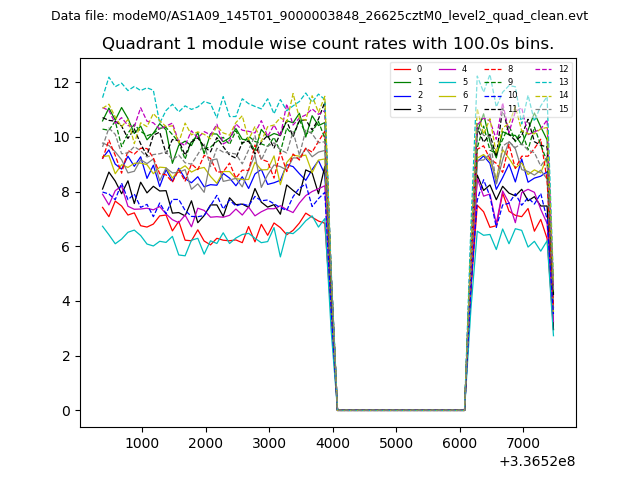
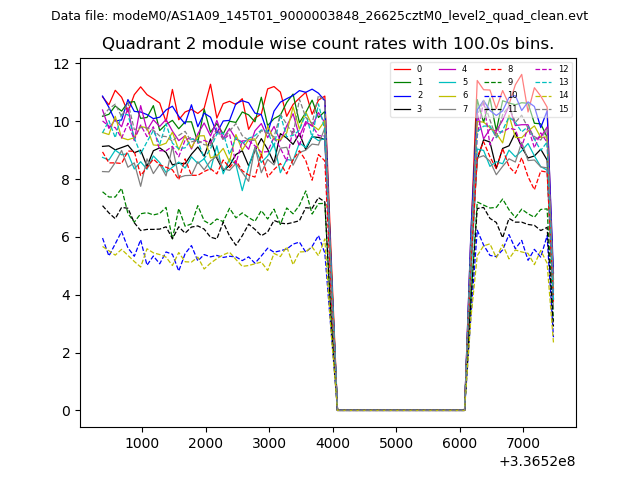
| Quadrant-wise count rates Data is divided into 100 sec bins |
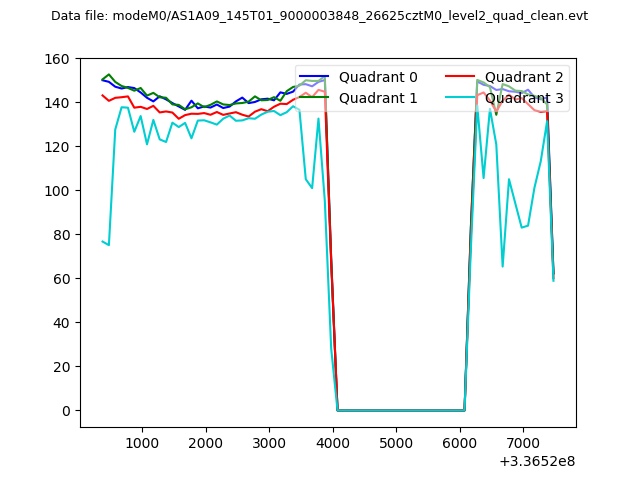 |
|
| Module-wise count rates for Quadrant A Data is divided into 100 sec bins |
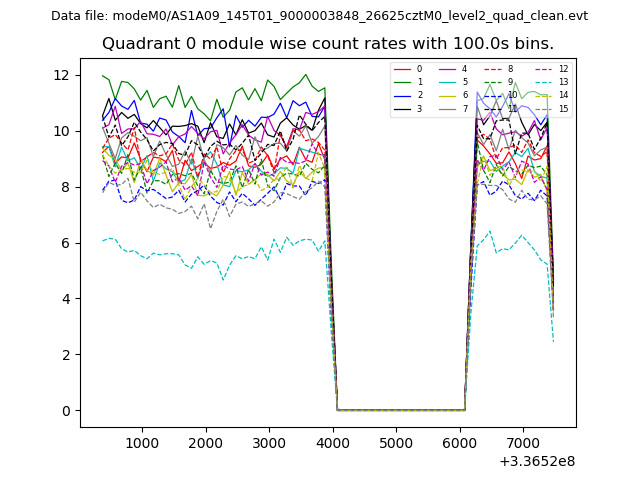 |
 |
| Module-wise count rates for Quadrant B Data is divided into 100 sec bins |
 |
 |
| Module-wise count rates for Quadrant C Data is divided into 100 sec bins |
 |
 |
| Module-wise count rates for Quadrant D Data is divided into 100 sec bins |
 |
 |
| Parameter | Plot |
|---|---|
| CZT HV Monitor | 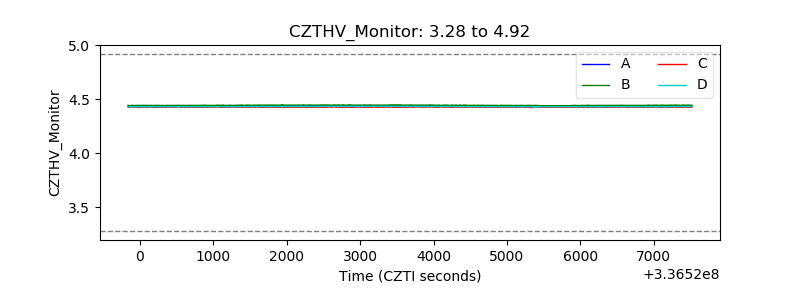 |
| D_VDD | 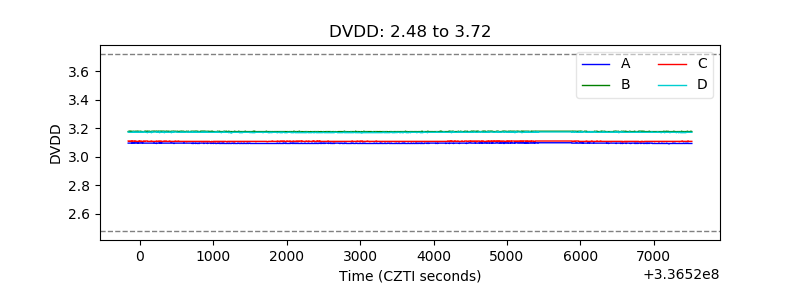 |
| Temperature 1 | 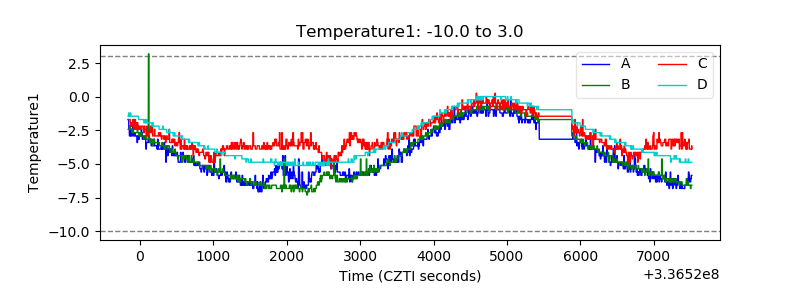 |
| Veto HV Monitor | 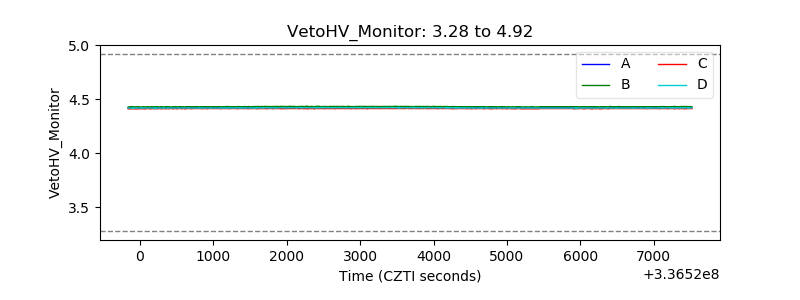 |
| Veto LLD | 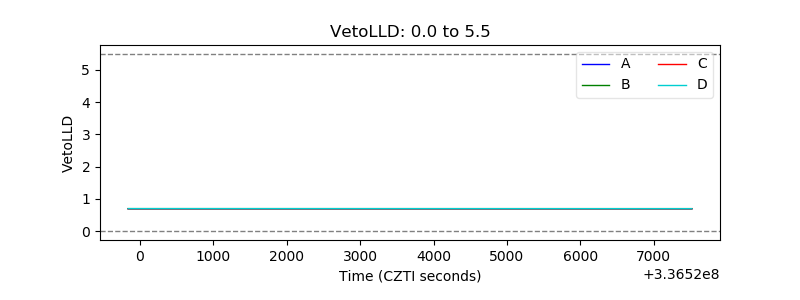 |
| Alpha Counter | 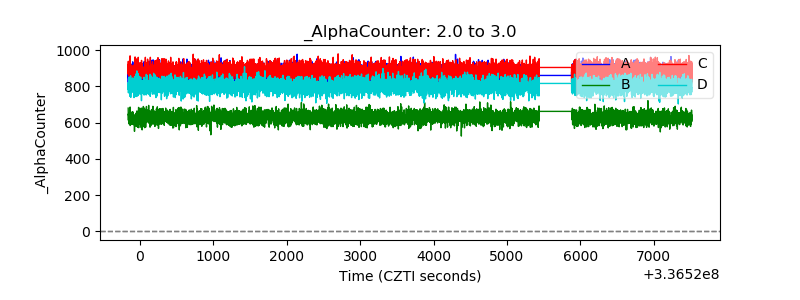 |
| _CPM_Rate | 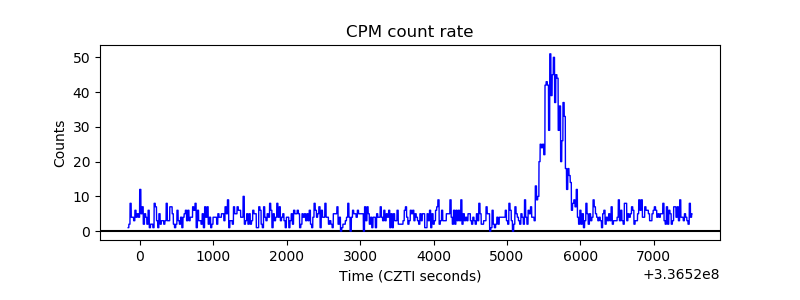 |
| CZT Counter | 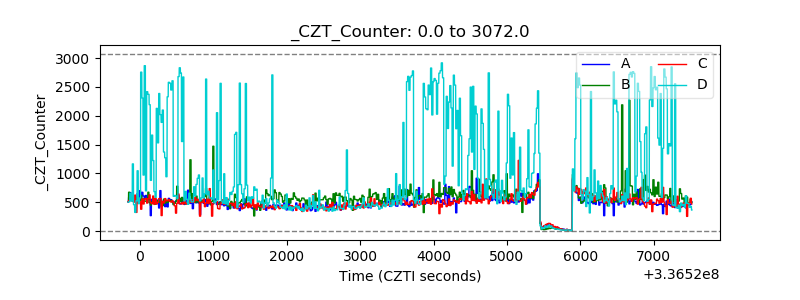 |
| +2.5 Volts monitor |  |
| +5 Volts monitor |  |
| _ROLL_ROT |  |
| _Roll_DEC | 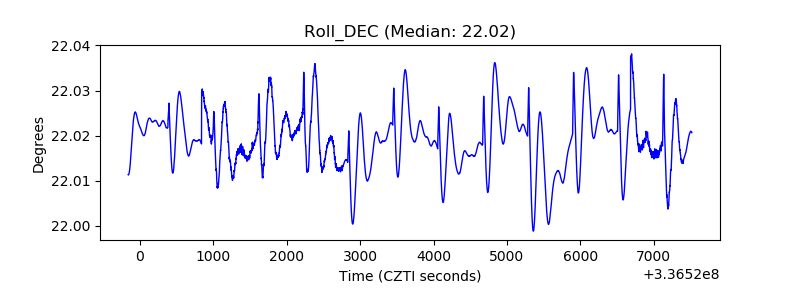 |
| _Roll_RA | 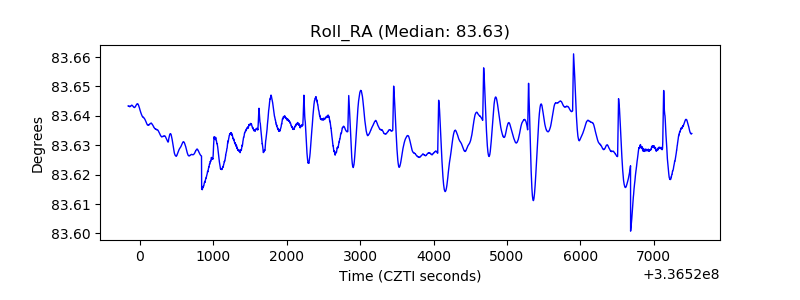 |
| Veto Counter | 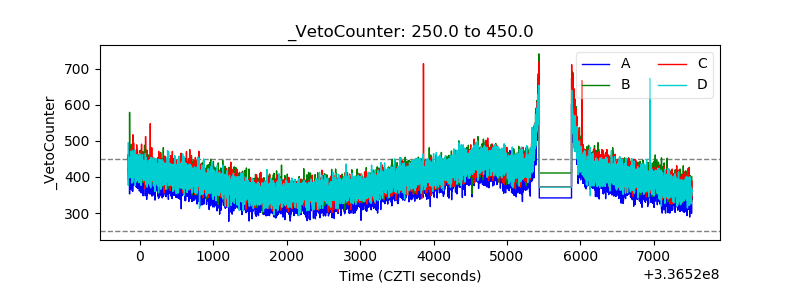 |