| Param | Original file | Final file |
|---|---|---|
| Filename | modeM0/AS1A09_145T01_9000003848_26629cztM0_level2.evt | modeM0/AS1A09_145T01_9000003848_26629cztM0_level2_quad_clean.evt |
| Size (bytes) | 486,141,120 | 87,359,040 |
| Size | 463.6 MB | 83.3 MB |
| Events in quadrant A | 3,014,784 | 571,123 |
| Events in quadrant B | 4,819,569 | 569,640 |
| Events in quadrant C | 3,061,184 | 550,714 |
| Events in quadrant D | 3,422,961 | 537,476 |
| Mode M0 | |||
|---|---|---|---|
| Quadrant | BADHDUFLAG | Total packets | Discarded packets |
| A | 0 | 12546 | 0 |
| B | 0 | 18630 | 0 |
| C | 0 | 12690 | 0 |
| D | 0 | 14026 | 0 |
| Mode M9 | |||
|---|---|---|---|
| Quadrant | BADHDUFLAG | Total packets | Discarded packets |
| A | 0 | 10 | 0 |
| B | 0 | 10 | 0 |
| C | 0 | 10 | 0 |
| D | 0 | 10 | 0 |
| Quadrant | Total seconds | Saturated seconds | Saturation percentage |
|---|---|---|---|
| A | 5964 | 60 | 1.006036% |
| B | 5965 | 286 | 4.794635% |
| C | 5965 | 89 | 1.492037% |
| D | 5965 | 102 | 1.709975% |
Noise dominated data is calculated using 1-second bins in cleaned event files. If a bin has >2000 counts, and if more than 50% of those come from <1% of pixels, then it is considered to be noise-dominated and hence unusable.
| Quadrant | # 1 sec bins | Bins with >0 counts | Bins with >2000 counts | High rate bins dominated by noise | Noise dominated (total time) | Noise dominated (detector-on time) | Marked lightcurve |
|---|---|---|---|---|---|---|---|
| A | 6979 | 5965 | 23 | 23 | 0.33% | 0.39% | 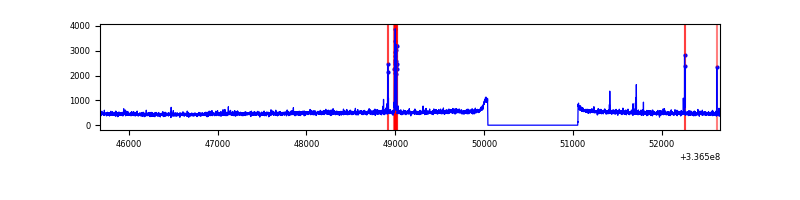 |
| B | 6980 | 5966 | 14 | 14 | 0.20% | 0.23% | 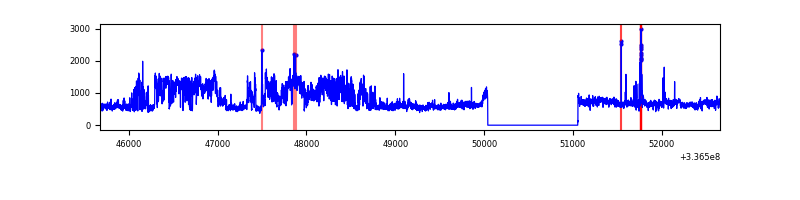 |
| C | 6980 | 5966 | 3 | 3 | 0.04% | 0.05% | 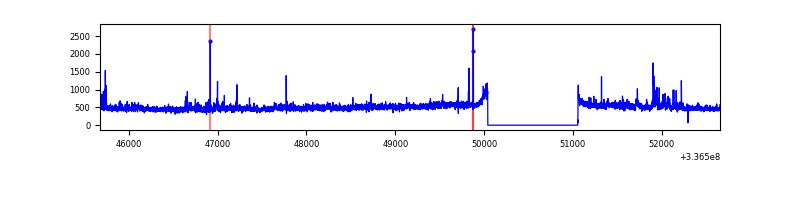 |
| D | 6980 | 5966 | 61 | 61 | 0.87% | 1.02% | 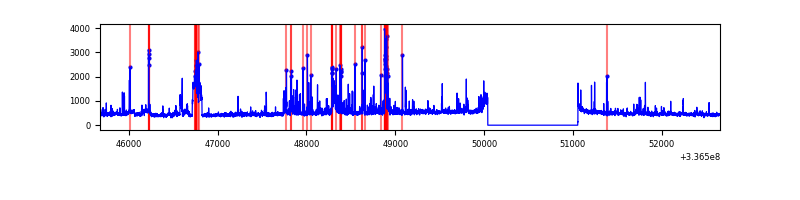 |
Top three noisy pixels from each quadrant. If the there are fewer than three noisy pixels in the level2.evt file, extra rows are filled as -1
| Pixel properties | Quadrant properties | ||||||
|---|---|---|---|---|---|---|---|
| Quadrant | DetID | PixID | Counts | Sigma | Mean | Median | Sigma |
| A | 0 | 13 | 115569 | 754.47 | 748 | 735 | 152.2 |
| A | 13 | 254 | 9613 | 58.33 | 748 | 735 | 152.2 |
| A | 5 | 168 | 8341 | 49.97 | 748 | 735 | 152.2 |
| B | 0 | 189 | 1837786 | 13074.82 | 735 | 720 | 140.5 |
| B | 10 | 245 | 86318 | 609.22 | 735 | 720 | 140.5 |
| B | 12 | 111 | 16636 | 113.28 | 735 | 720 | 140.5 |
| C | 3 | 233 | 139860 | 829.14 | 712 | 719 | 167.8 |
| C | 14 | 238 | 115602 | 684.58 | 712 | 719 | 167.8 |
| C | 15 | 208 | 17337 | 99.03 | 712 | 719 | 167.8 |
| D | 1 | 52 | 431873 | 2452.03 | 719 | 702 | 175.8 |
| D | 7 | 80 | 93382 | 527.06 | 719 | 702 | 175.8 |
| D | 12 | 233 | 79979 | 450.84 | 719 | 702 | 175.8 |
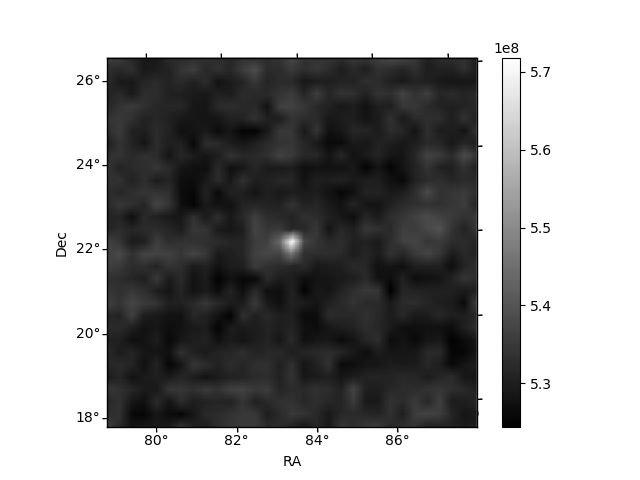
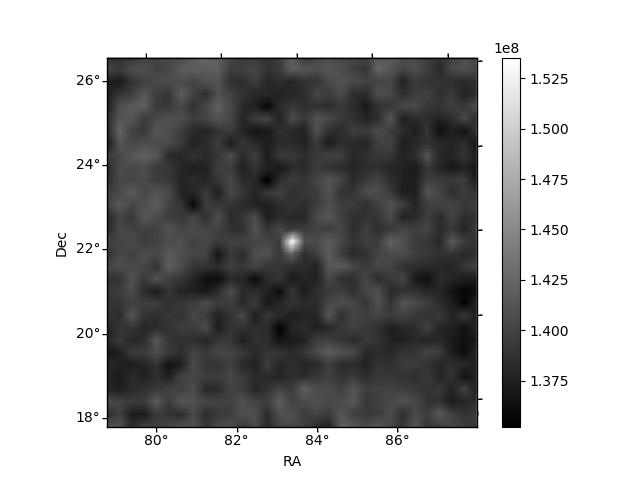
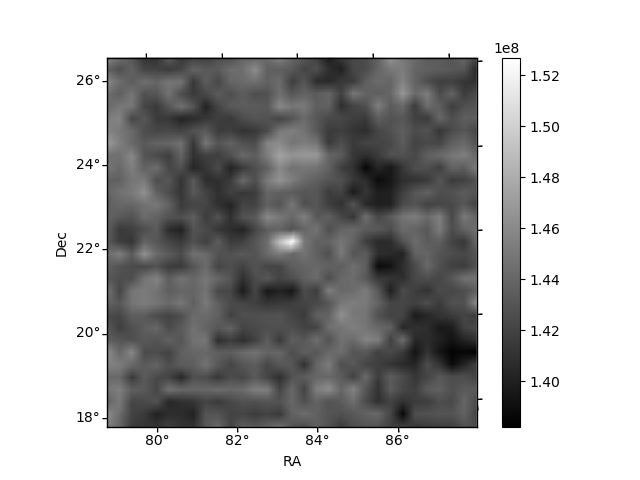
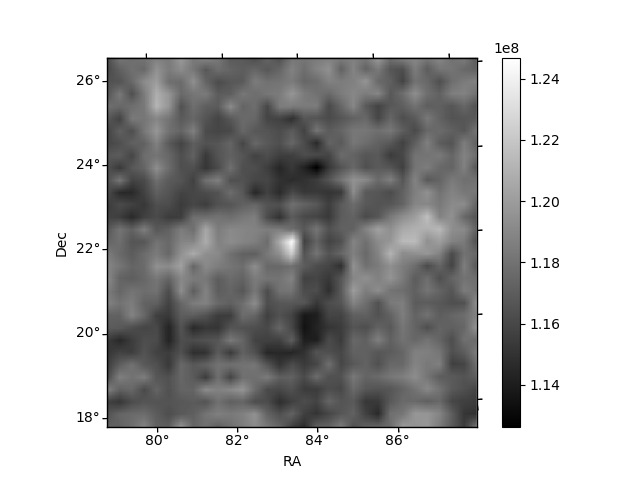
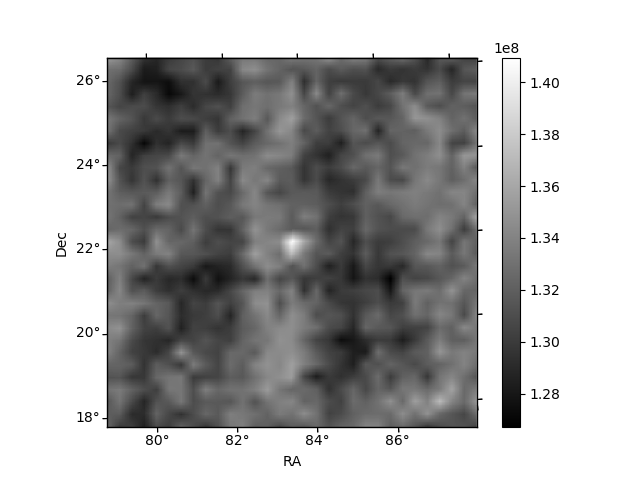
Histogram calculated using DETX and DETY for each event in the final _common_clean file
| Quadrant A | 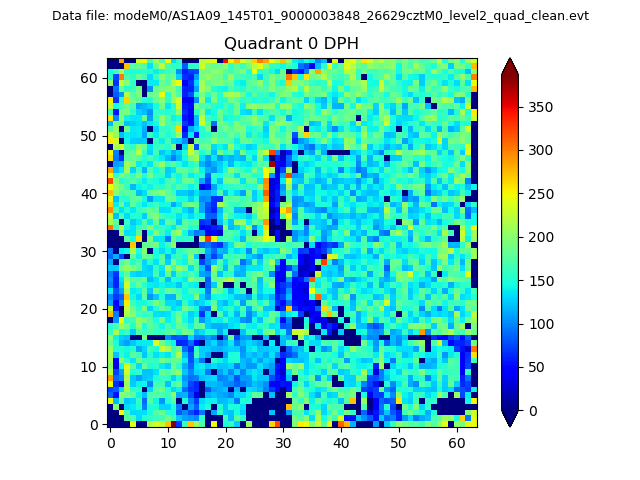 |
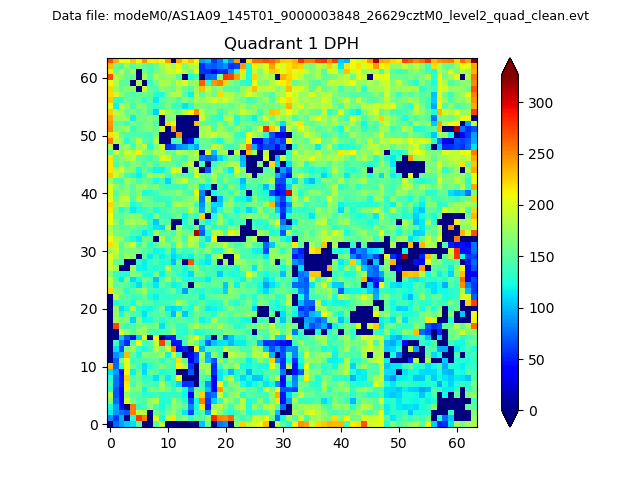 |
Quadrant B |
|---|---|---|---|
| Quadrant D | 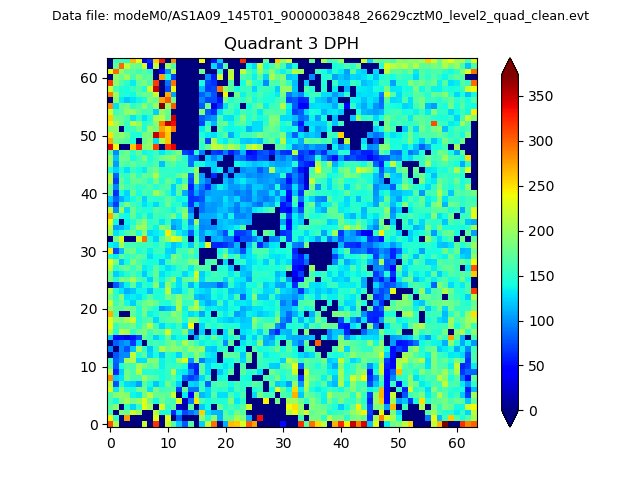 |
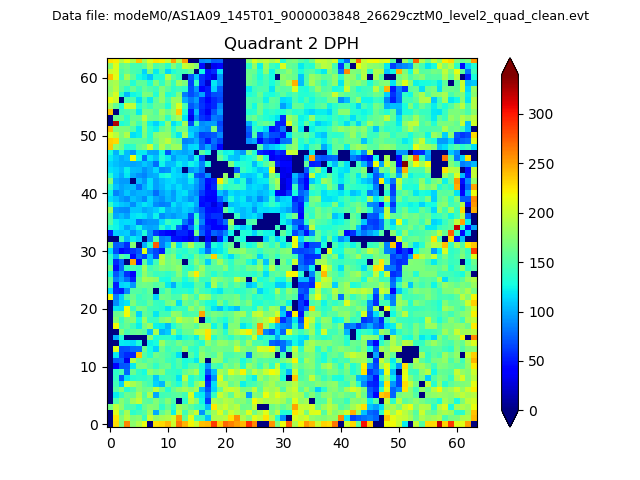 |
Quadrant C |
| Plot type | Count rate plots | Images |
|---|---|---|
| Comparison with Poisson distribution Blue bars denote a histogram of data divided into 1 sec bins. Red curve is a Poisson curve with rate = median count rate of data. |
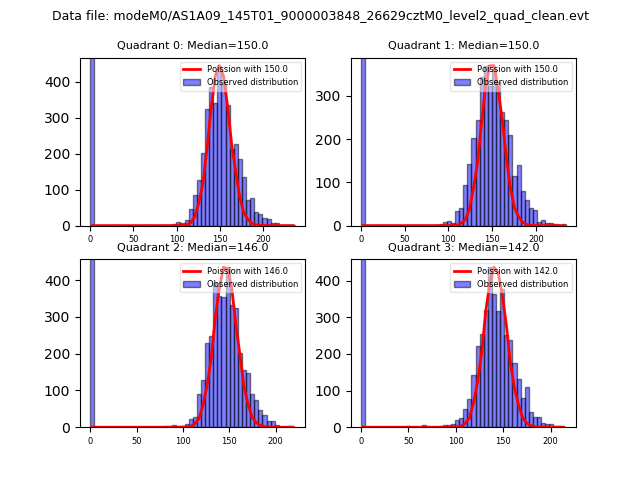 |
 |
| Quadrant-wise count rates Data is divided into 100 sec bins |
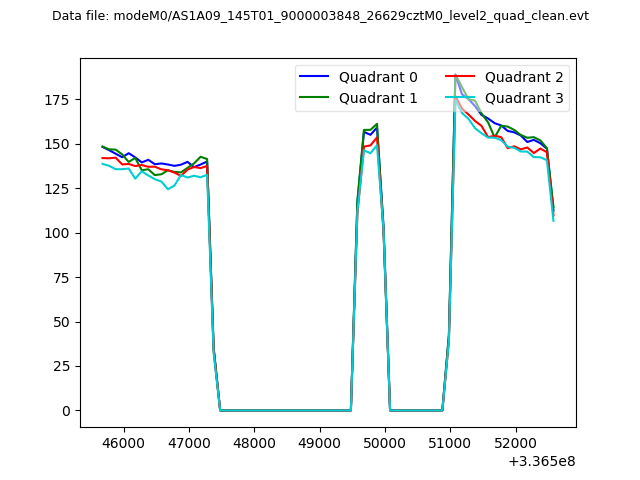 |
|
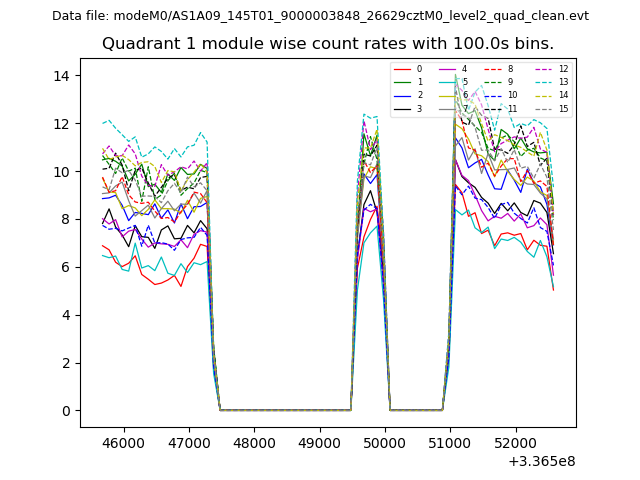
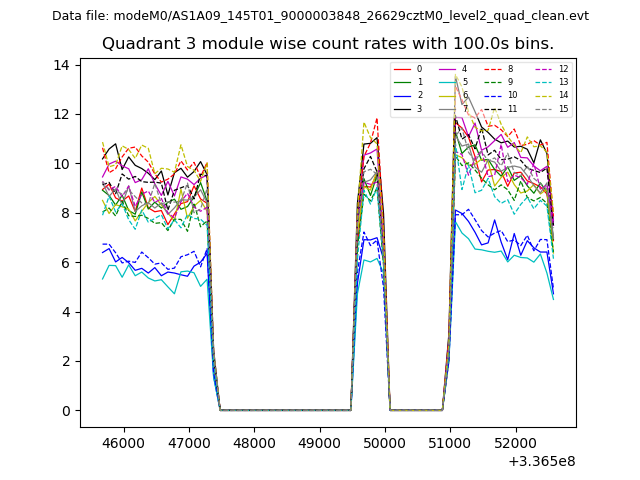
| Module-wise count rates for Quadrant A Data is divided into 100 sec bins |
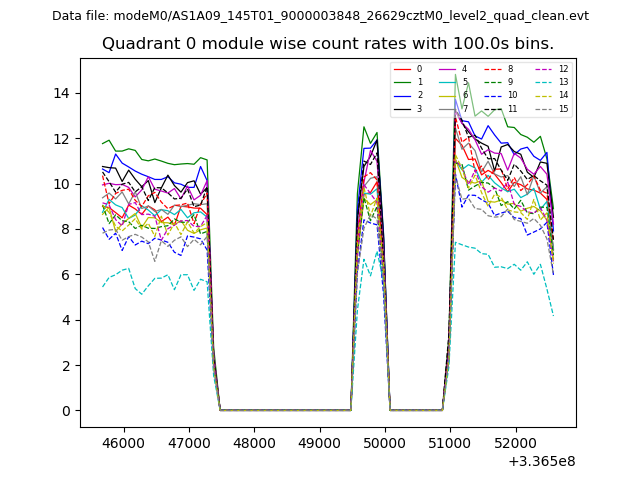 |
 |
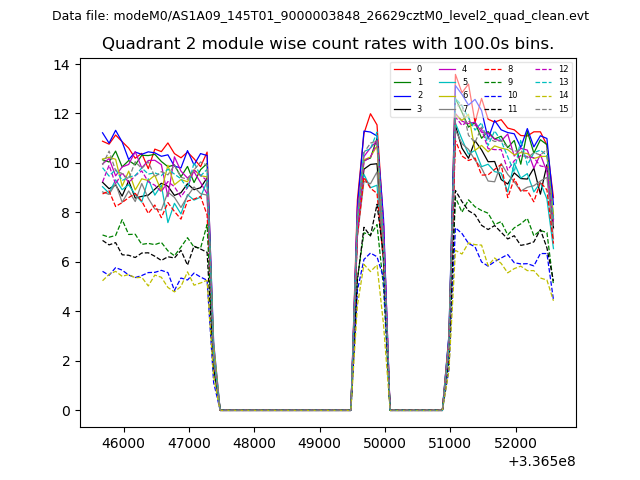
| Module-wise count rates for Quadrant B Data is divided into 100 sec bins |
 |
 |
| Module-wise count rates for Quadrant C Data is divided into 100 sec bins |
 |
 |
| Module-wise count rates for Quadrant D Data is divided into 100 sec bins |
 |
 |
| Parameter | Plot |
|---|---|
| CZT HV Monitor | 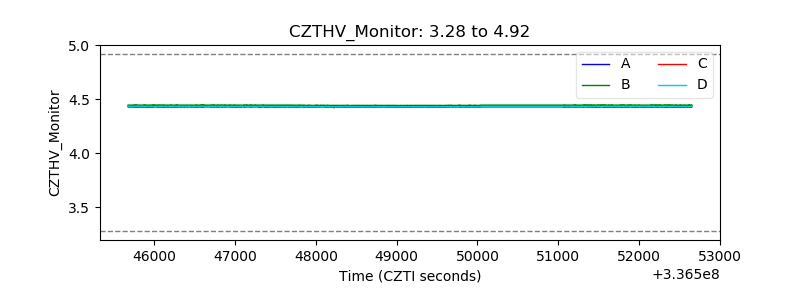 |
| D_VDD | 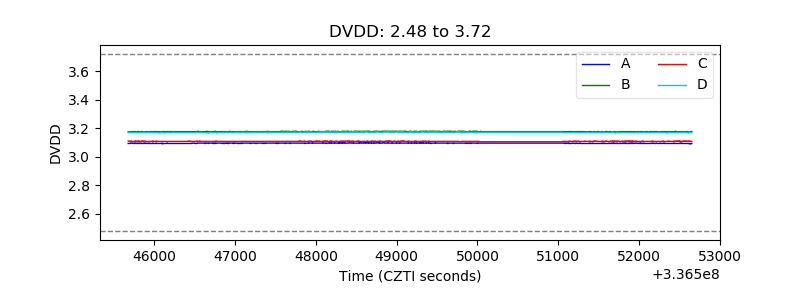 |
| Temperature 1 | 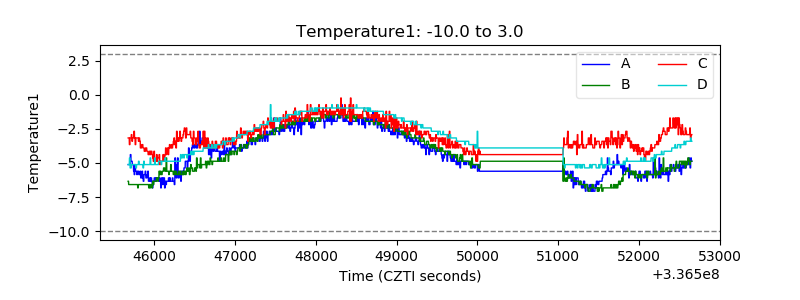 |
| Veto HV Monitor | 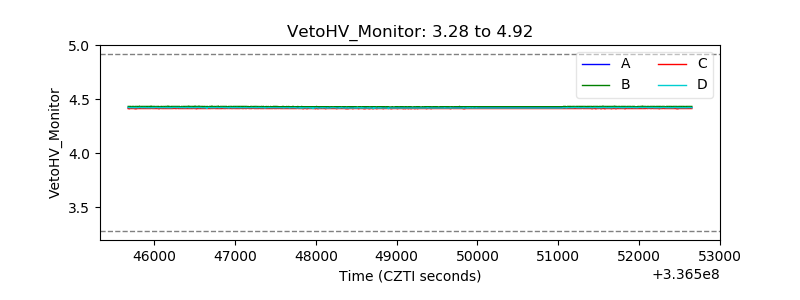 |
| Veto LLD | 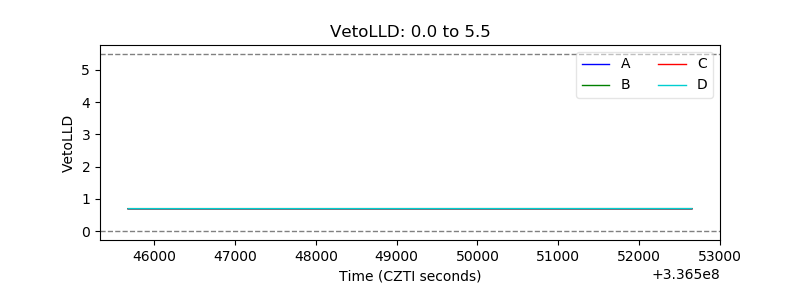 |
| Alpha Counter | 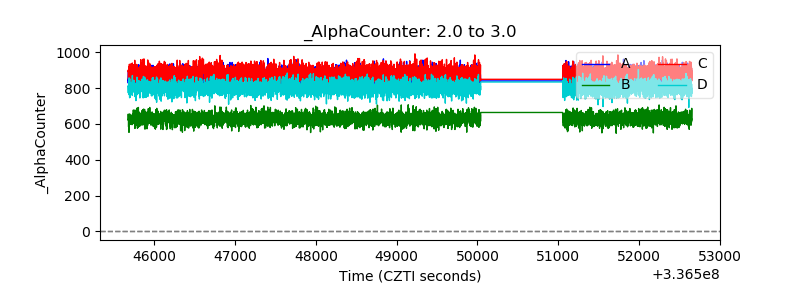 |
| _CPM_Rate | 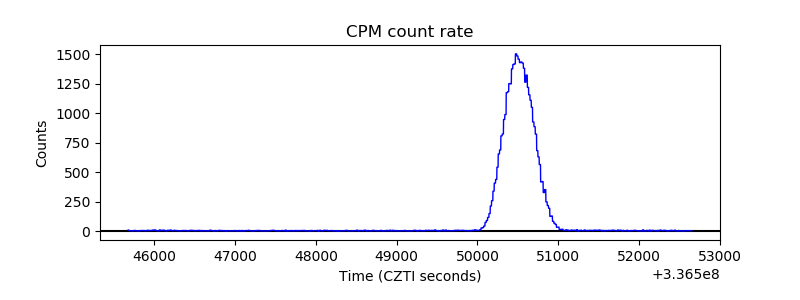 |
| CZT Counter | 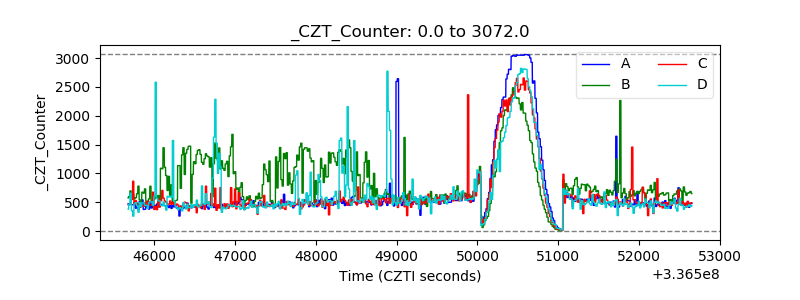 |
| +2.5 Volts monitor | 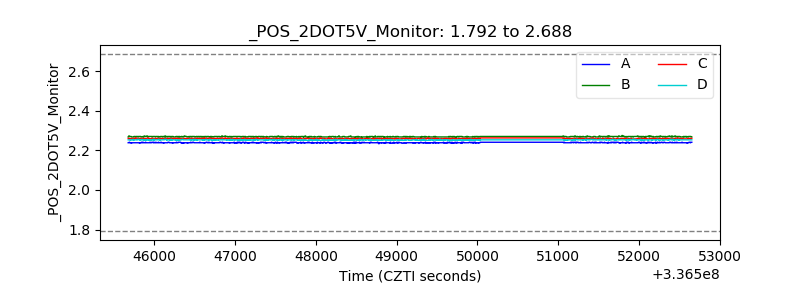 |
| +5 Volts monitor | 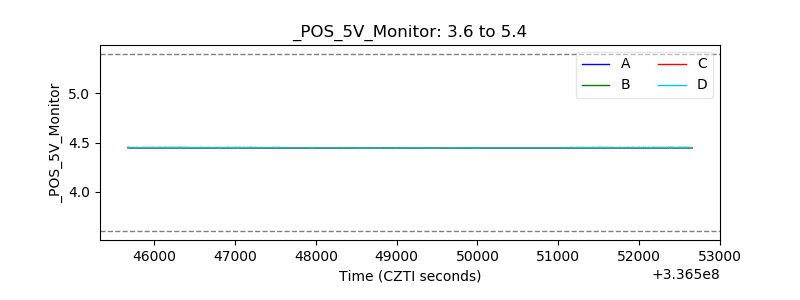 |
| _ROLL_ROT | 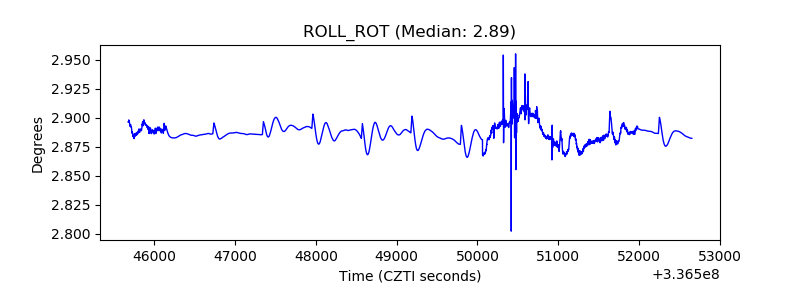 |
| _Roll_DEC | 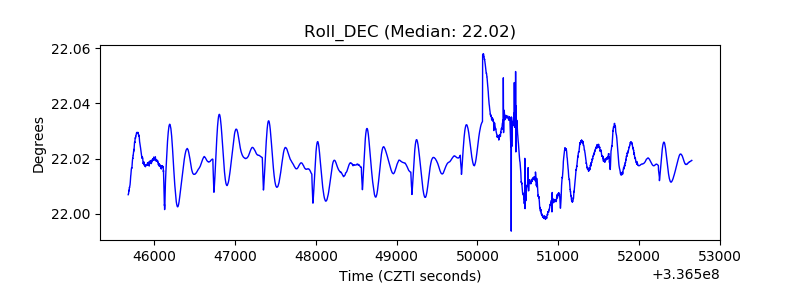 |
| _Roll_RA | 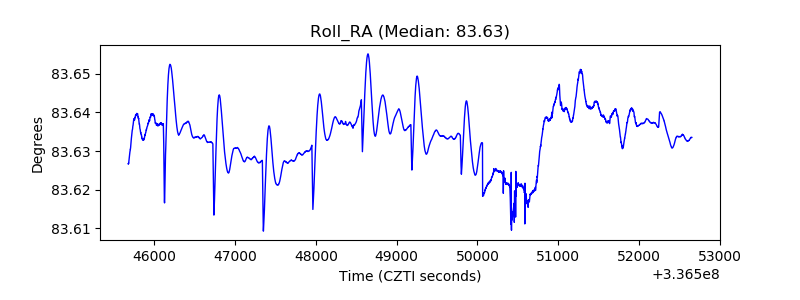 |
| Veto Counter | 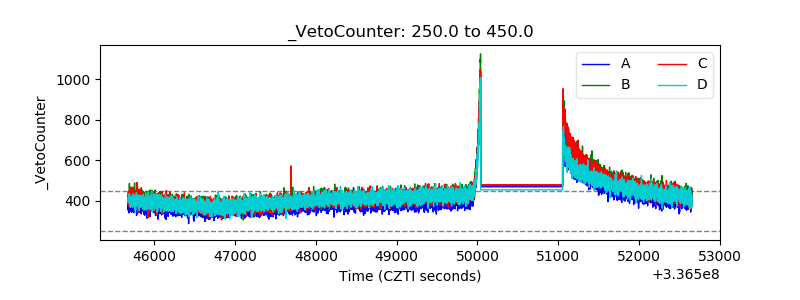 |