| Param | Original file | Final file |
|---|---|---|
| Filename | modeM0/AS1A09_145T01_9000003848_26631cztM0_level2.evt | modeM0/AS1A09_145T01_9000003848_26631cztM0_level2_quad_clean.evt |
| Size (bytes) | 494,481,600 | 90,184,320 |
| Size | 471.6 MB | 86.0 MB |
| Events in quadrant A | 3,076,302 | 602,000 |
| Events in quadrant B | 3,809,349 | 594,399 |
| Events in quadrant C | 3,103,654 | 572,406 |
| Events in quadrant D | 4,590,915 | 555,209 |
| Mode M0 | |||
|---|---|---|---|
| Quadrant | BADHDUFLAG | Total packets | Discarded packets |
| A | 0 | 12539 | 0 |
| B | 0 | 15703 | 0 |
| C | 0 | 12698 | 0 |
| D | 0 | 17474 | 0 |
| Mode M9 | |||
|---|---|---|---|
| Quadrant | BADHDUFLAG | Total packets | Discarded packets |
| A | 0 | 11 | 0 |
| B | 0 | 11 | 0 |
| C | 0 | 11 | 0 |
| D | 0 | 11 | 0 |
| Quadrant | Total seconds | Saturated seconds | Saturation percentage |
|---|---|---|---|
| A | 5822 | 51 | 0.875988% |
| B | 5823 | 93 | 1.597115% |
| C | 5823 | 87 | 1.494075% |
| D | 5822 | 517 | 8.880110% |
Noise dominated data is calculated using 1-second bins in cleaned event files. If a bin has >2000 counts, and if more than 50% of those come from <1% of pixels, then it is considered to be noise-dominated and hence unusable.
| Quadrant | # 1 sec bins | Bins with >0 counts | Bins with >2000 counts | High rate bins dominated by noise | Noise dominated (total time) | Noise dominated (detector-on time) | Marked lightcurve |
|---|---|---|---|---|---|---|---|
| A | 6942 | 5823 | 6 | 6 | 0.09% | 0.10% | 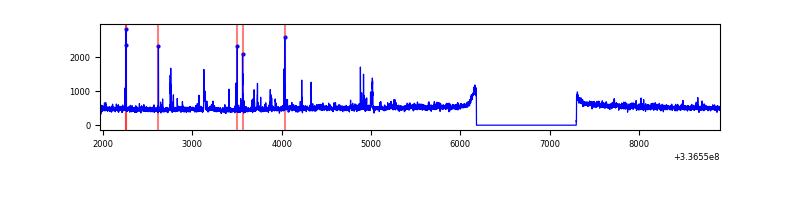 |
| B | 6943 | 5824 | 16 | 16 | 0.23% | 0.27% | 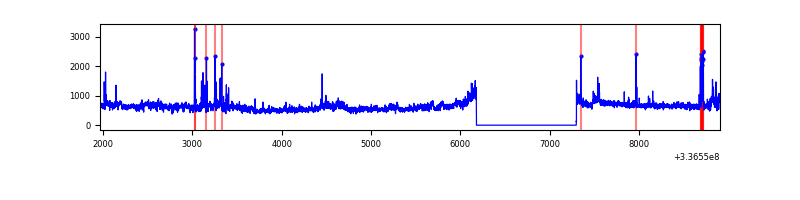 |
| C | 6943 | 5824 | 0 | 0 | 0.00% | 0.00% | 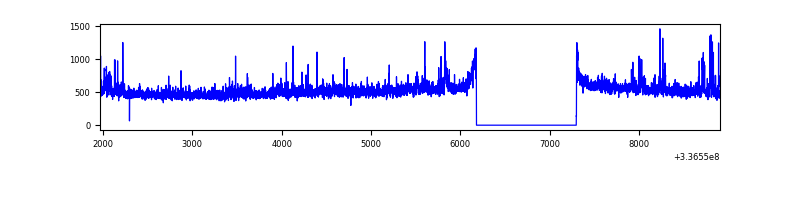 |
| D | 6942 | 5823 | 465 | 465 | 6.70% | 7.99% | 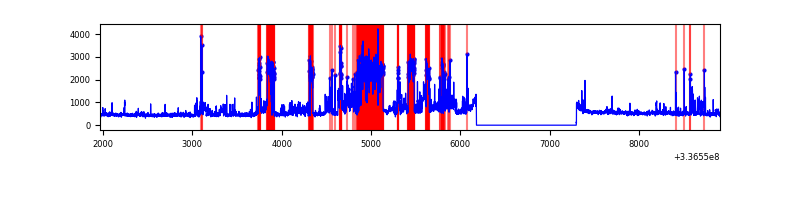 |
Top three noisy pixels from each quadrant. If the there are fewer than three noisy pixels in the level2.evt file, extra rows are filled as -1
| Pixel properties | Quadrant properties | ||||||
|---|---|---|---|---|---|---|---|
| Quadrant | DetID | PixID | Counts | Sigma | Mean | Median | Sigma |
| A | 0 | 13 | 112302 | 726.59 | 765 | 754 | 153.5 |
| A | 5 | 168 | 12242 | 74.83 | 765 | 754 | 153.5 |
| A | 13 | 254 | 9641 | 57.89 | 765 | 754 | 153.5 |
| B | 0 | 189 | 712322 | 4983.28 | 748 | 733 | 142.8 |
| B | 10 | 245 | 110602 | 769.42 | 748 | 733 | 142.8 |
| B | 15 | 33 | 20754 | 140.21 | 748 | 733 | 142.8 |
| C | 3 | 233 | 156341 | 920.76 | 720 | 727 | 169.0 |
| C | 14 | 238 | 117285 | 689.67 | 720 | 727 | 169.0 |
| C | 15 | 208 | 19074 | 108.56 | 720 | 727 | 169.0 |
| D | 1 | 52 | 1500291 | 8549.16 | 710 | 690 | 175.4 |
| D | 2 | 250 | 239027 | 1358.75 | 710 | 690 | 175.4 |
| D | 7 | 80 | 78403 | 443.04 | 710 | 690 | 175.4 |
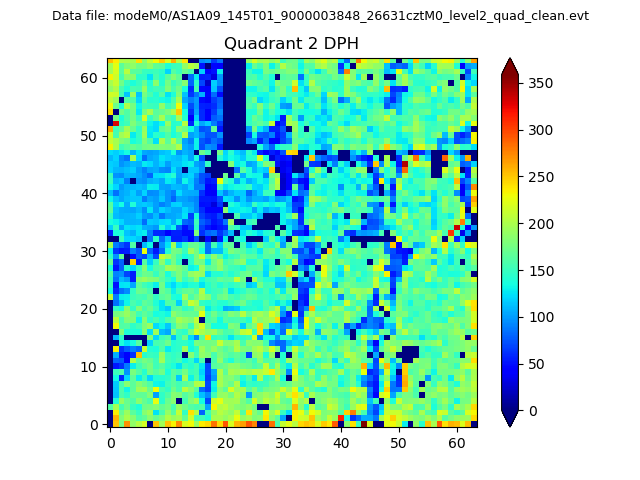
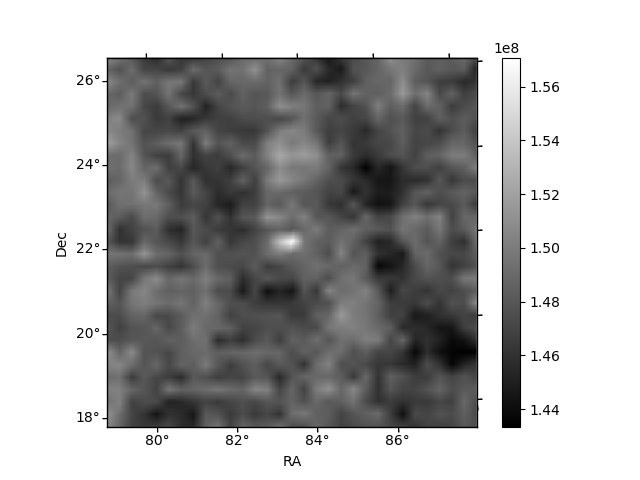
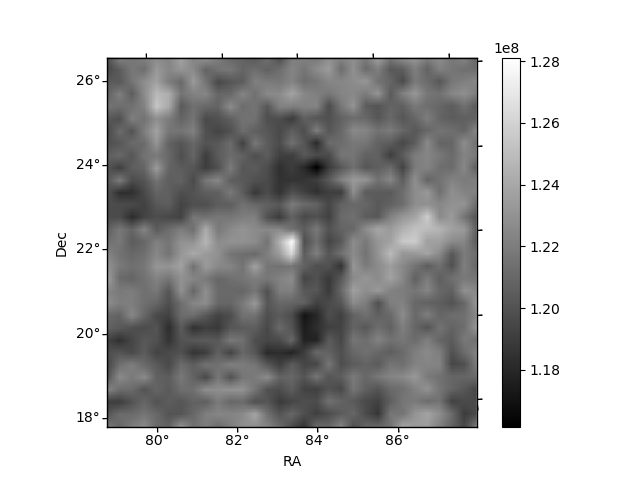
Histogram calculated using DETX and DETY for each event in the final _common_clean file
| Quadrant A | 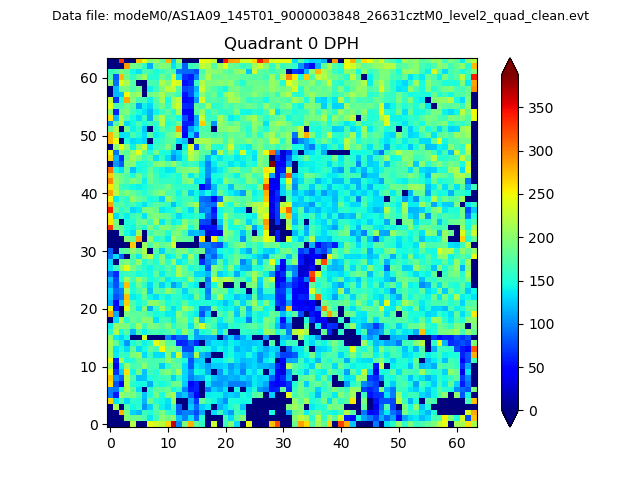 |
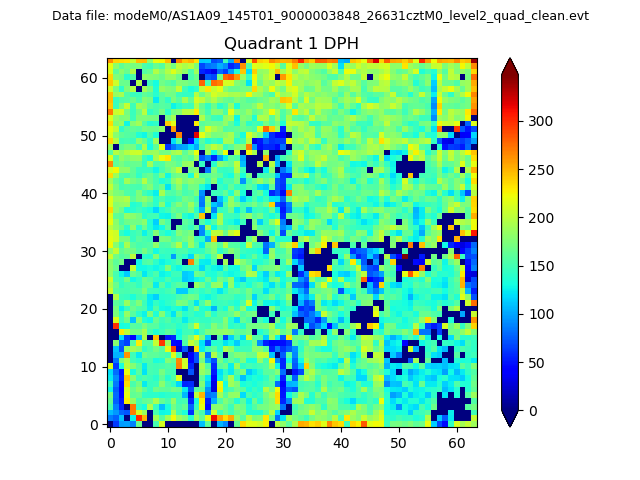 |
Quadrant B |
|---|---|---|---|
| Quadrant D | 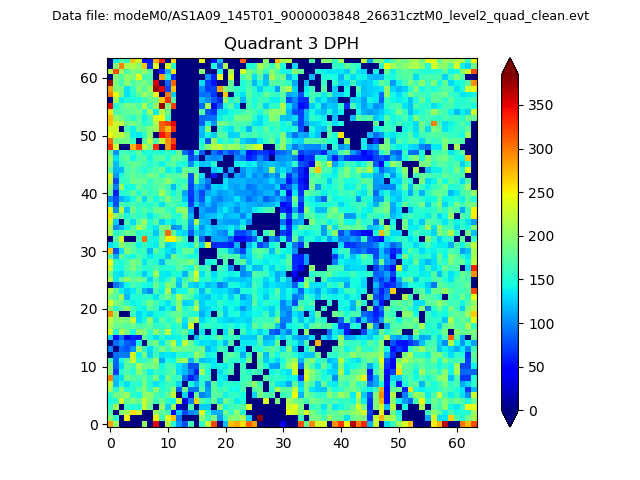 |
 |
Quadrant C |
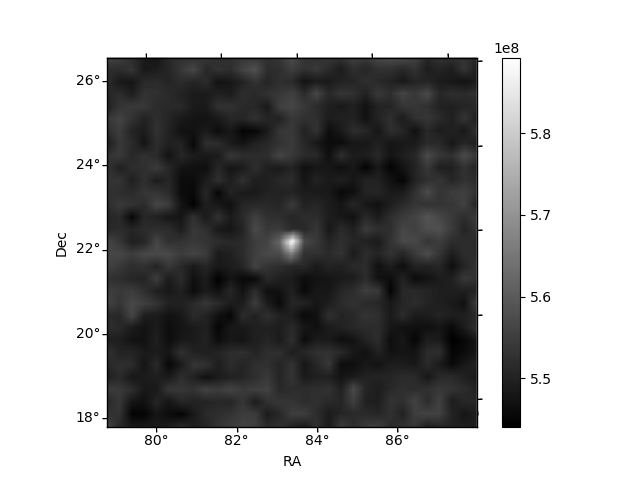
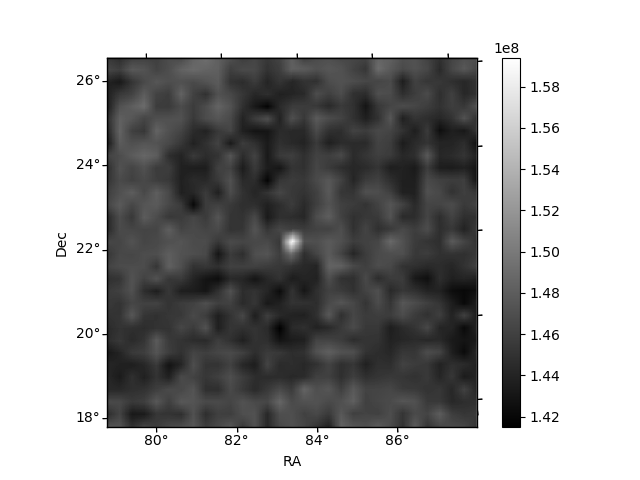
| Plot type | Count rate plots | Images |
|---|---|---|
| Comparison with Poisson distribution Blue bars denote a histogram of data divided into 1 sec bins. Red curve is a Poisson curve with rate = median count rate of data. |
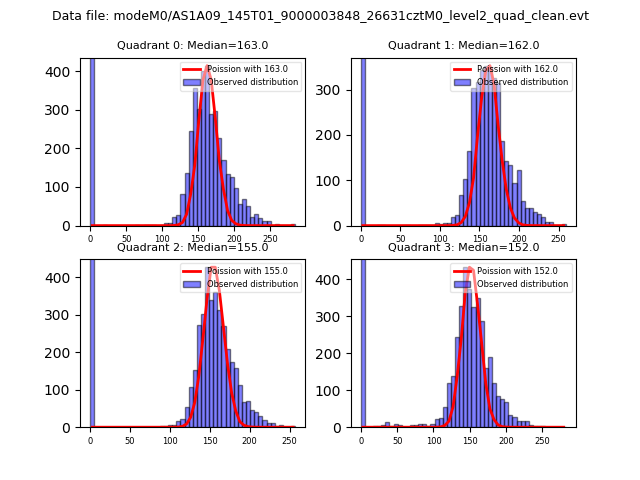 |
 |
| Quadrant-wise count rates Data is divided into 100 sec bins |
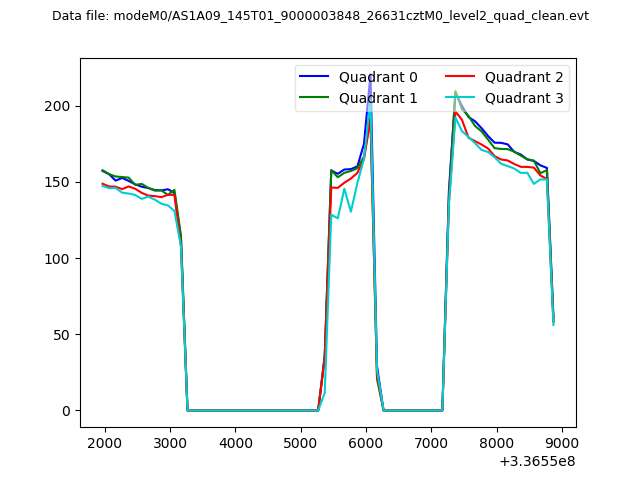 |
|
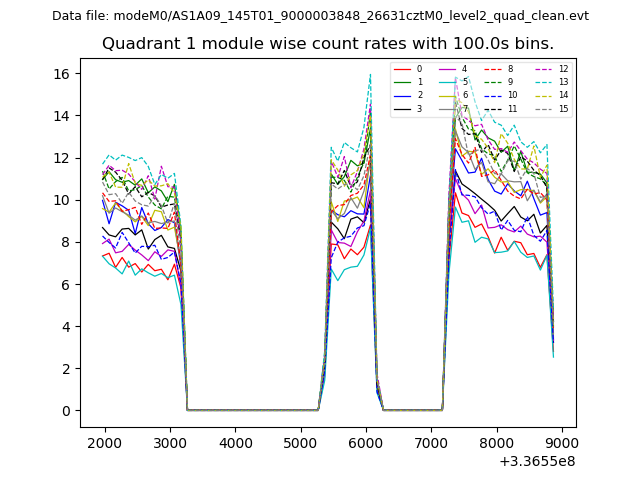
| Module-wise count rates for Quadrant A Data is divided into 100 sec bins |
 |
 |
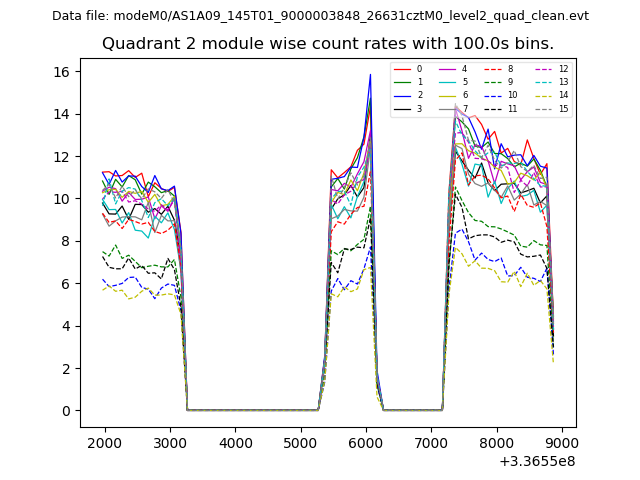
| Module-wise count rates for Quadrant B Data is divided into 100 sec bins |
 |
 |
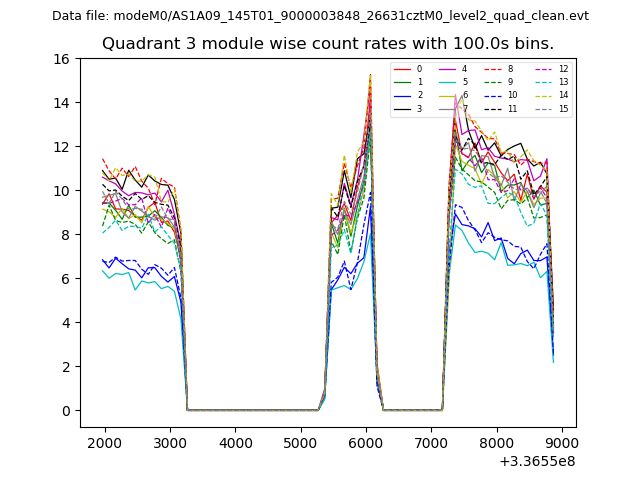
| Module-wise count rates for Quadrant C Data is divided into 100 sec bins |
 |
 |
| Module-wise count rates for Quadrant D Data is divided into 100 sec bins |
 |
 |
| Parameter | Plot |
|---|---|
| CZT HV Monitor | 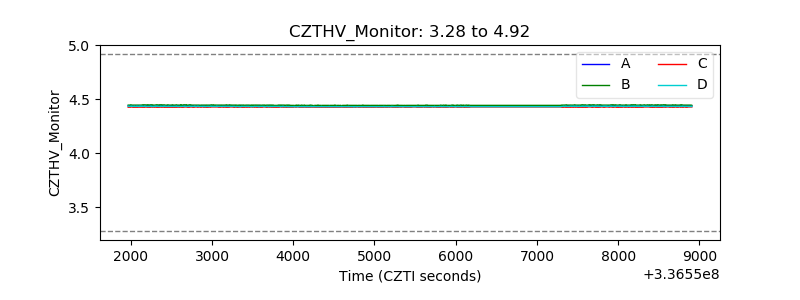 |
| D_VDD | 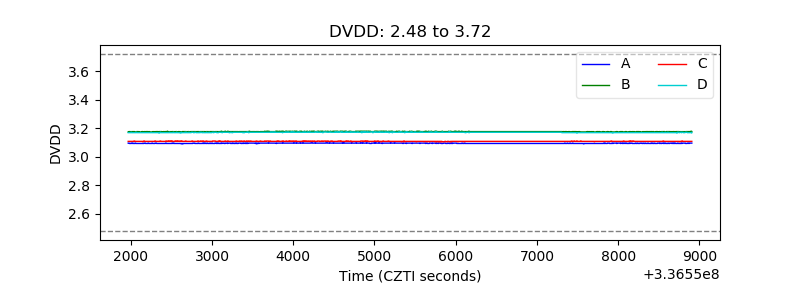 |
| Temperature 1 | 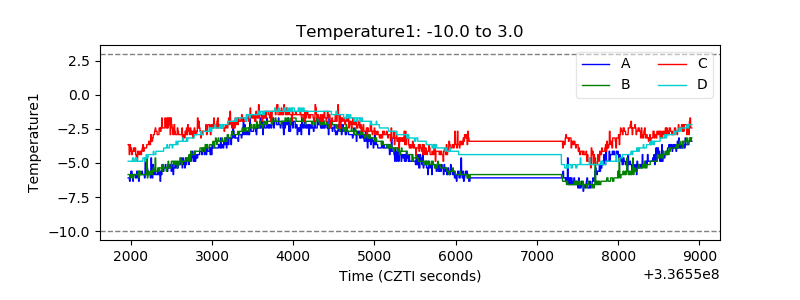 |
| Veto HV Monitor | 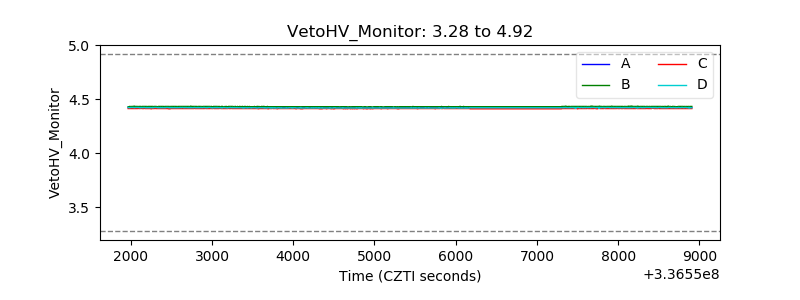 |
| Veto LLD | 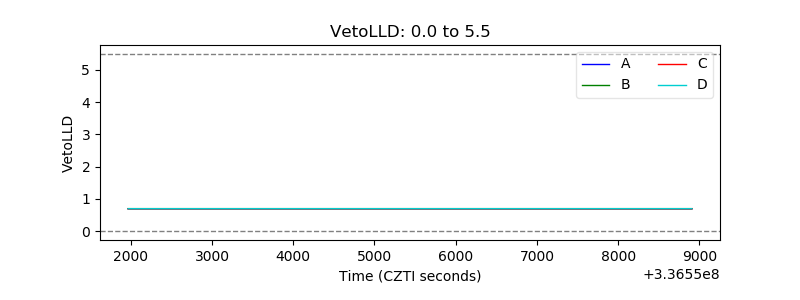 |
| Alpha Counter |  |
| _CPM_Rate | 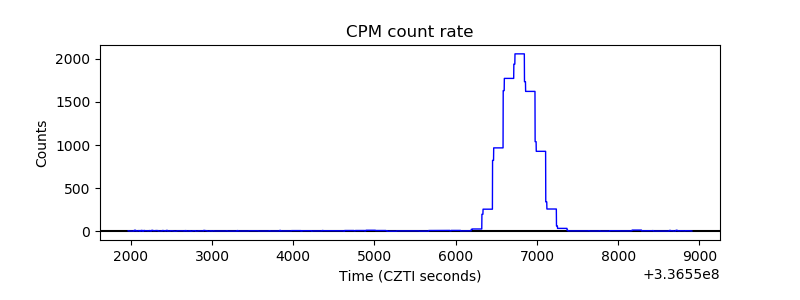 |
| CZT Counter | 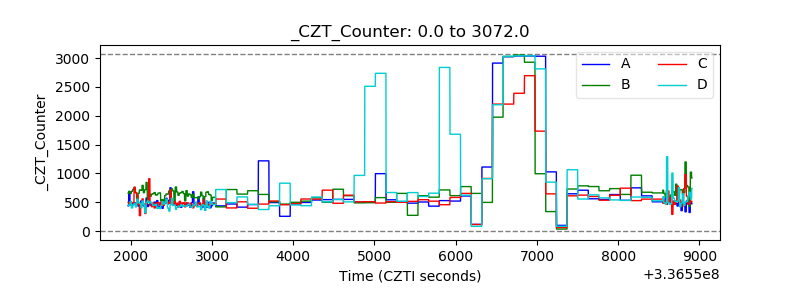 |
| +2.5 Volts monitor |  |
| +5 Volts monitor |  |
| _ROLL_ROT | 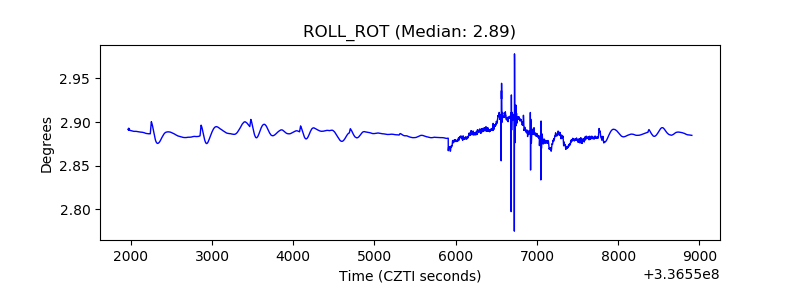 |
| _Roll_DEC | 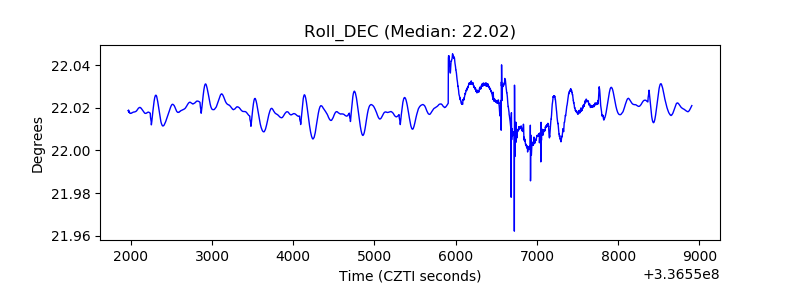 |
| _Roll_RA | 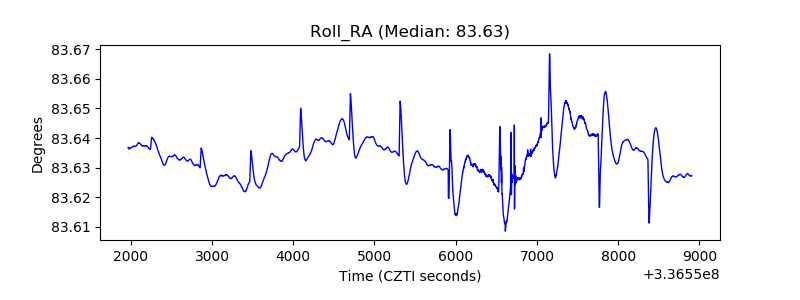 |
| Veto Counter | 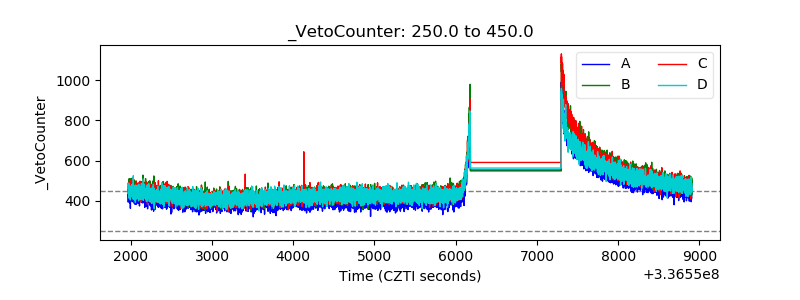 |