| Param | Original file | Final file |
|---|---|---|
| Filename | modeM0/AS1A09_145T01_9000003848_26632cztM0_level2.evt | modeM0/AS1A09_145T01_9000003848_26632cztM0_level2_quad_clean.evt |
| Size (bytes) | 540,912,960 | 96,730,560 |
| Size | 515.9 MB | 92.2 MB |
| Events in quadrant A | 3,219,947 | 651,216 |
| Events in quadrant B | 4,109,076 | 645,226 |
| Events in quadrant C | 3,282,026 | 618,172 |
| Events in quadrant D | 5,369,565 | 601,306 |
| Mode M0 | |||
|---|---|---|---|
| Quadrant | BADHDUFLAG | Total packets | Discarded packets |
| A | 0 | 12976 | 0 |
| B | 0 | 16555 | 0 |
| C | 0 | 13310 | 0 |
| D | 0 | 19755 | 0 |
| Mode M9 | |||
|---|---|---|---|
| Quadrant | BADHDUFLAG | Total packets | Discarded packets |
| A | 0 | 12 | 0 |
| B | 0 | 12 | 0 |
| C | 0 | 12 | 0 |
| D | 0 | 12 | 0 |
| Quadrant | Total seconds | Saturated seconds | Saturation percentage |
|---|---|---|---|
| A | 5920 | 66 | 1.114865% |
| B | 5921 | 115 | 1.942239% |
| C | 5921 | 83 | 1.401790% |
| D | 5920 | 790 | 13.344595% |
Noise dominated data is calculated using 1-second bins in cleaned event files. If a bin has >2000 counts, and if more than 50% of those come from <1% of pixels, then it is considered to be noise-dominated and hence unusable.
| Quadrant | # 1 sec bins | Bins with >0 counts | Bins with >2000 counts | High rate bins dominated by noise | Noise dominated (total time) | Noise dominated (detector-on time) | Marked lightcurve |
|---|---|---|---|---|---|---|---|
| A | 7140 | 5921 | 7 | 7 | 0.10% | 0.12% | 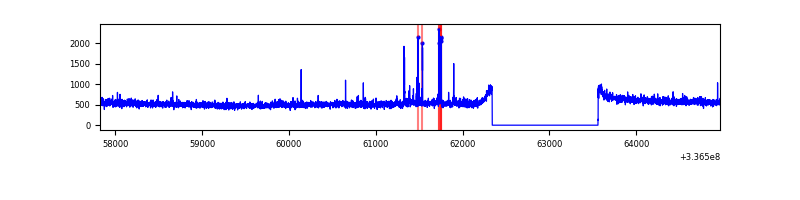 |
| B | 7141 | 5922 | 13 | 13 | 0.18% | 0.22% | 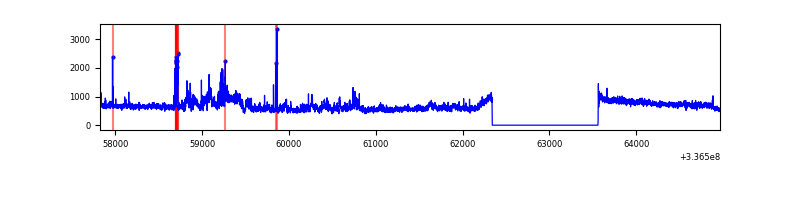 |
| C | 7141 | 5922 | 0 | 0 | 0.00% | 0.00% | 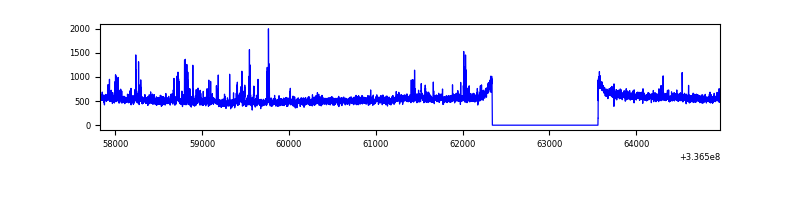 |
| D | 7140 | 5921 | 698 | 698 | 9.78% | 11.79% | 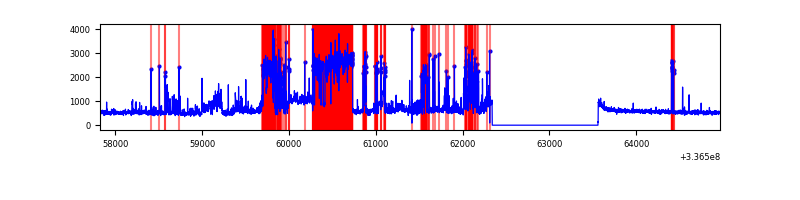 |
Top three noisy pixels from each quadrant. If the there are fewer than three noisy pixels in the level2.evt file, extra rows are filled as -1
| Pixel properties | Quadrant properties | ||||||
|---|---|---|---|---|---|---|---|
| Quadrant | DetID | PixID | Counts | Sigma | Mean | Median | Sigma |
| A | 0 | 13 | 59241 | 357.5 | 818 | 806 | 163.5 |
| A | 13 | 254 | 9371 | 52.4 | 818 | 806 | 163.5 |
| A | 0 | 226 | 7050 | 38.2 | 818 | 806 | 163.5 |
| B | 0 | 189 | 879827 | 5889.65 | 796 | 780 | 149.3 |
| B | 10 | 245 | 90940 | 604.07 | 796 | 780 | 149.3 |
| B | 12 | 111 | 17349 | 111.01 | 796 | 780 | 149.3 |
| C | 3 | 233 | 157834 | 883.42 | 765 | 773 | 177.8 |
| C | 14 | 238 | 126230 | 705.66 | 765 | 773 | 177.8 |
| C | 15 | 208 | 7410 | 37.33 | 765 | 773 | 177.8 |
| D | 7 | 80 | 2003170 | 11148.33 | 741 | 722 | 179.6 |
| D | 2 | 250 | 272885 | 1515.23 | 741 | 722 | 179.6 |
| D | 1 | 52 | 212058 | 1176.58 | 741 | 722 | 179.6 |
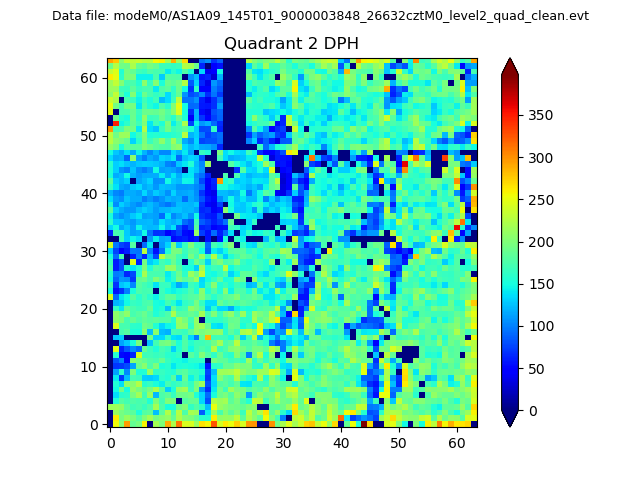
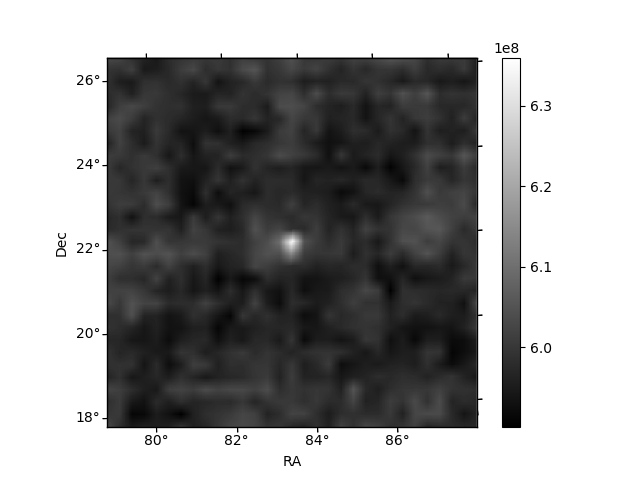
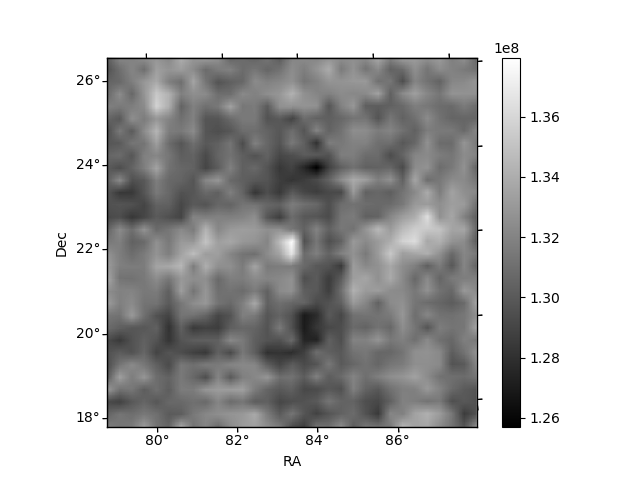
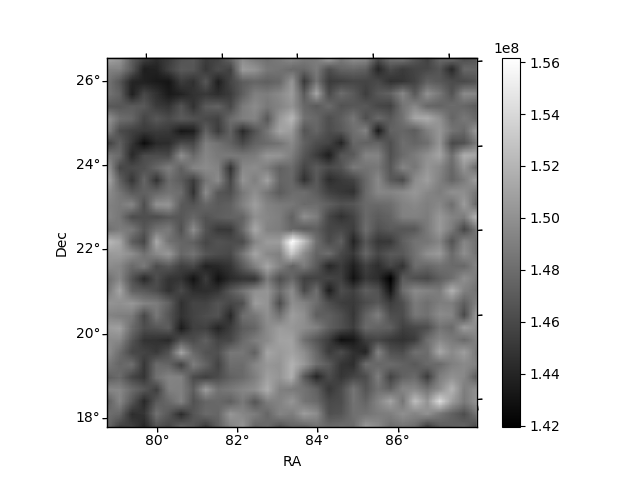
Histogram calculated using DETX and DETY for each event in the final _common_clean file
| Quadrant A | 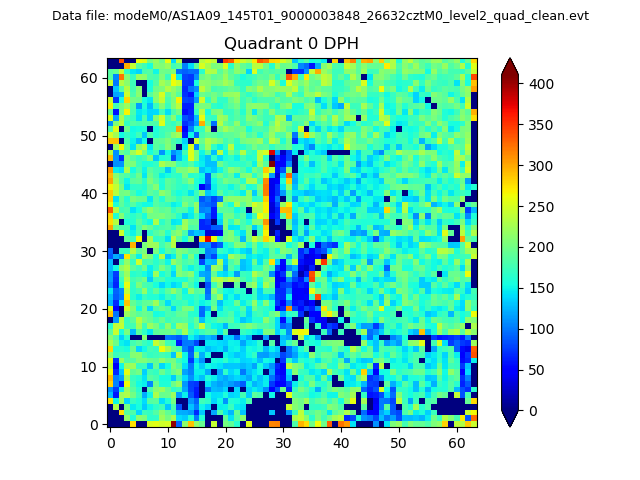 |
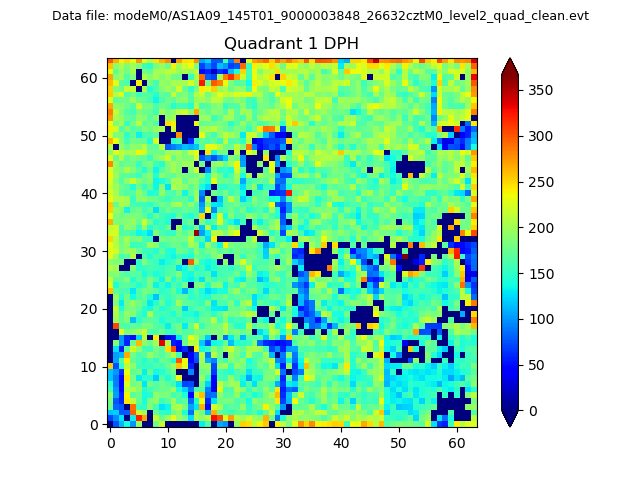 |
Quadrant B |
|---|---|---|---|
| Quadrant D | 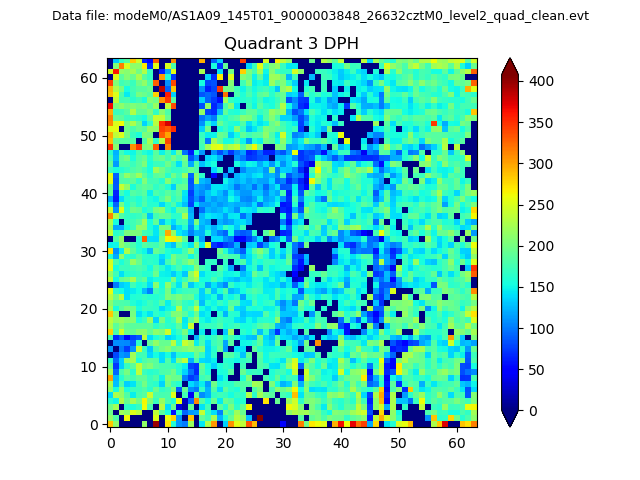 |
 |
Quadrant C |
| Plot type | Count rate plots | Images |
|---|---|---|
| Comparison with Poisson distribution Blue bars denote a histogram of data divided into 1 sec bins. Red curve is a Poisson curve with rate = median count rate of data. |
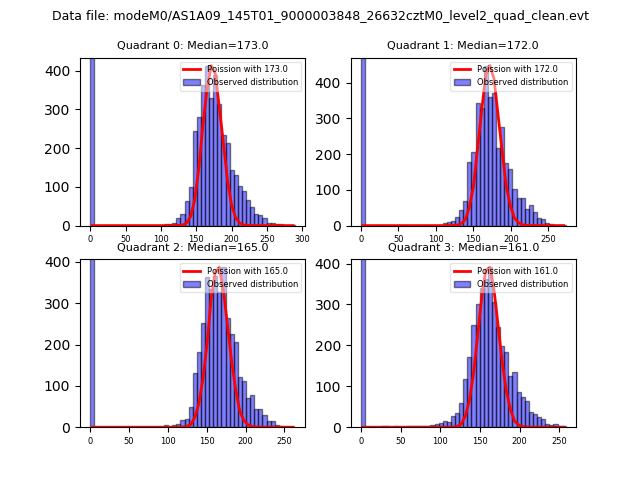 |
 |
| Quadrant-wise count rates Data is divided into 100 sec bins |
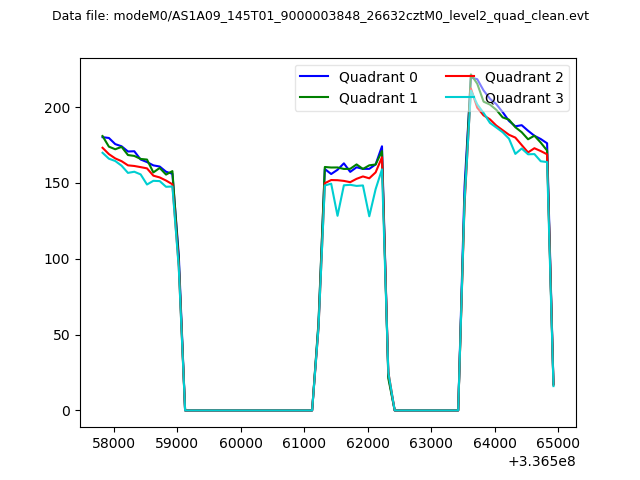 |
|
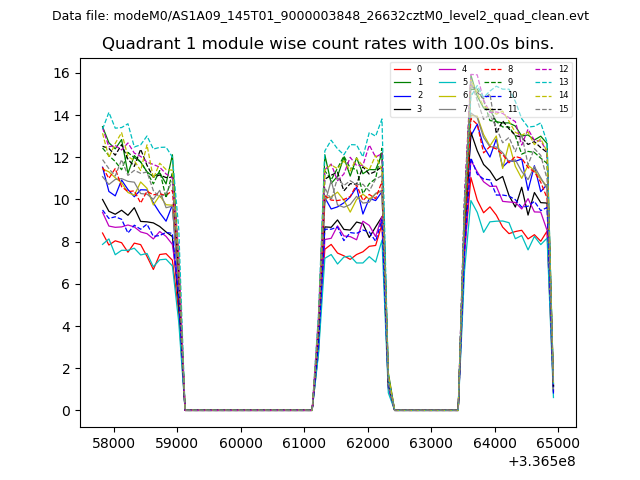
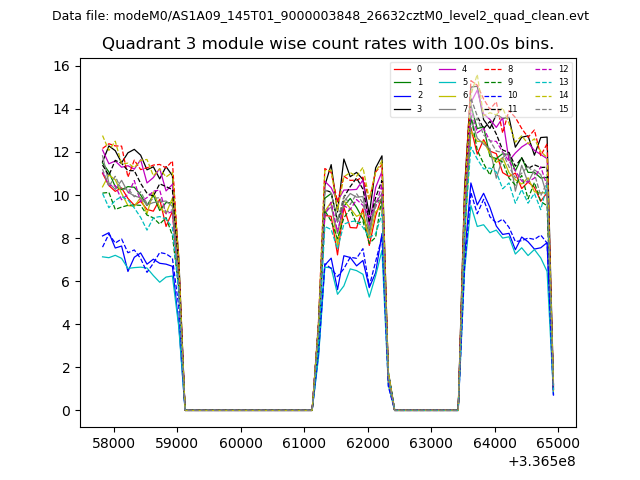
| Module-wise count rates for Quadrant A Data is divided into 100 sec bins |
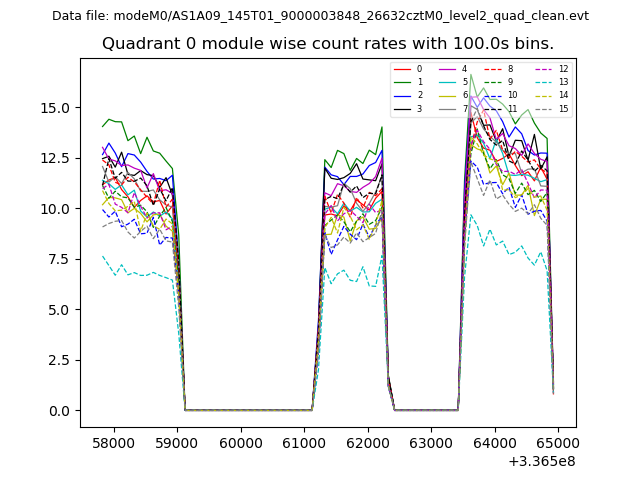 |
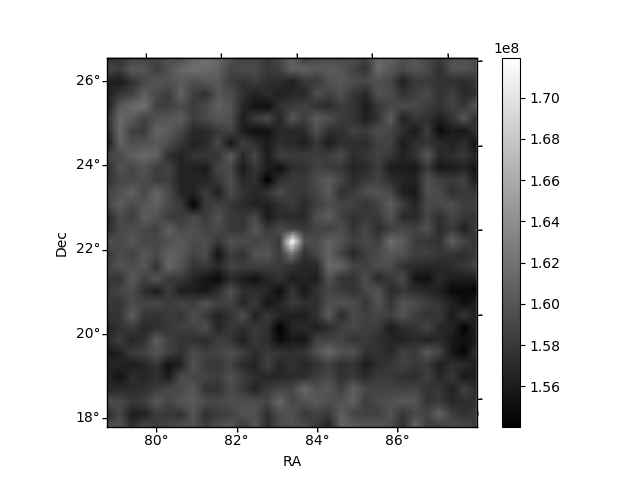 |
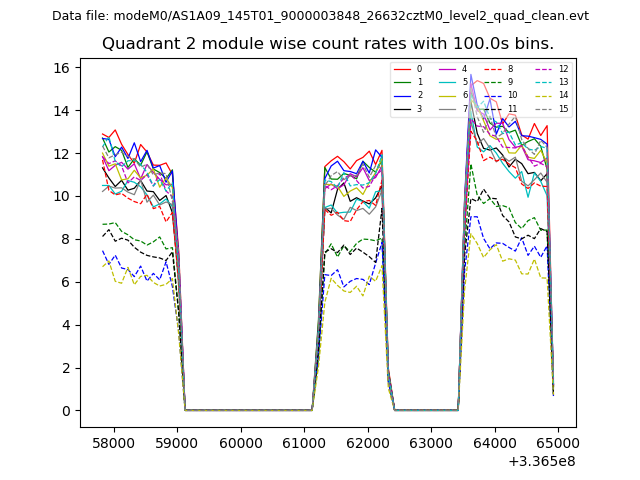
| Module-wise count rates for Quadrant B Data is divided into 100 sec bins |
 |
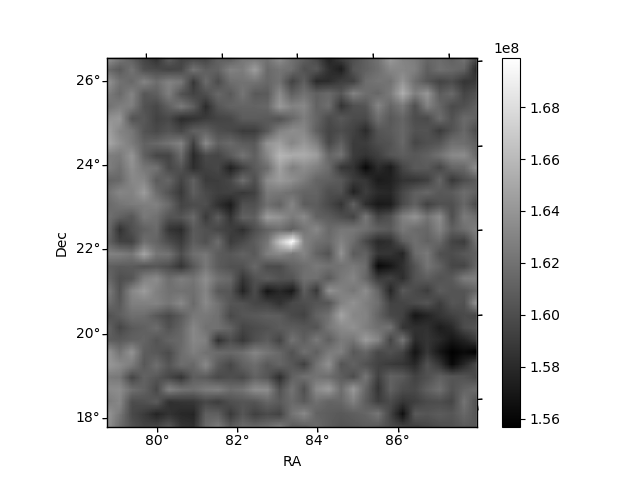 |
| Module-wise count rates for Quadrant C Data is divided into 100 sec bins |
 |
 |
| Module-wise count rates for Quadrant D Data is divided into 100 sec bins |
 |
 |
| Parameter | Plot |
|---|---|
| CZT HV Monitor | 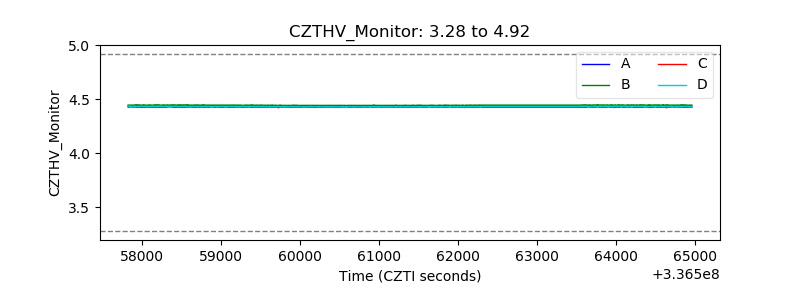 |
| D_VDD | 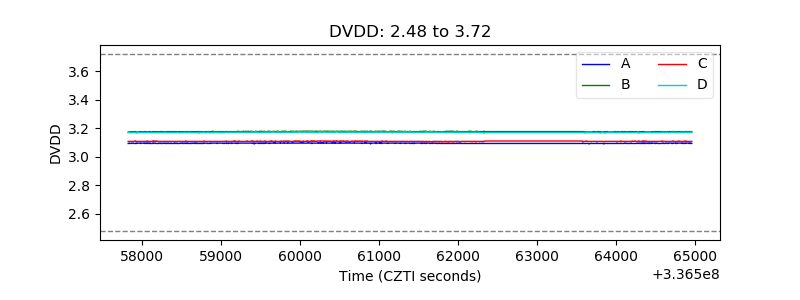 |
| Temperature 1 | 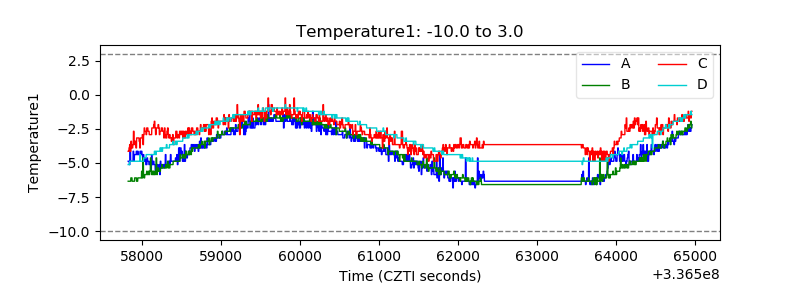 |
| Veto HV Monitor | 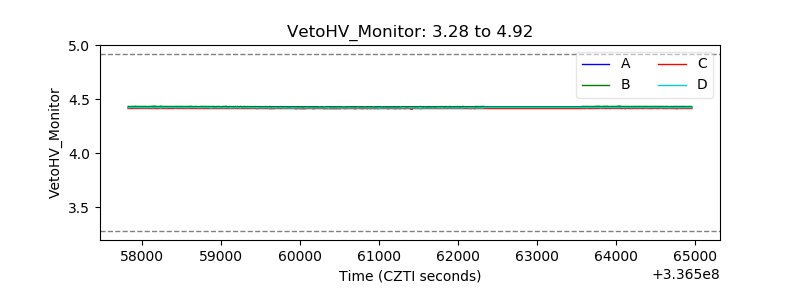 |
| Veto LLD | 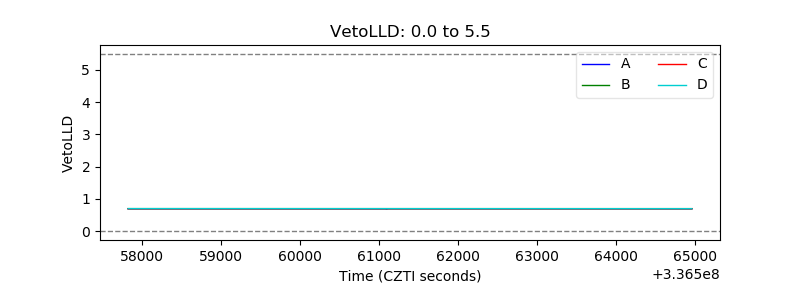 |
| Alpha Counter | 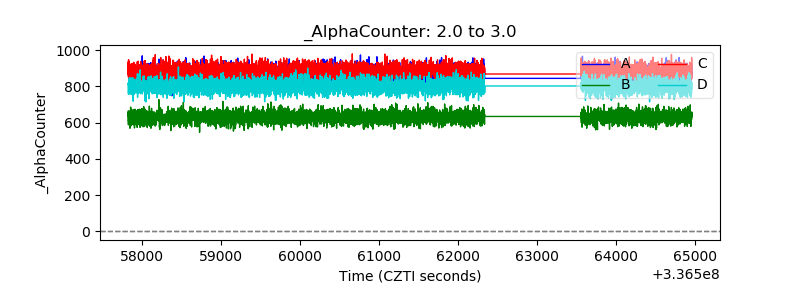 |
| _CPM_Rate | 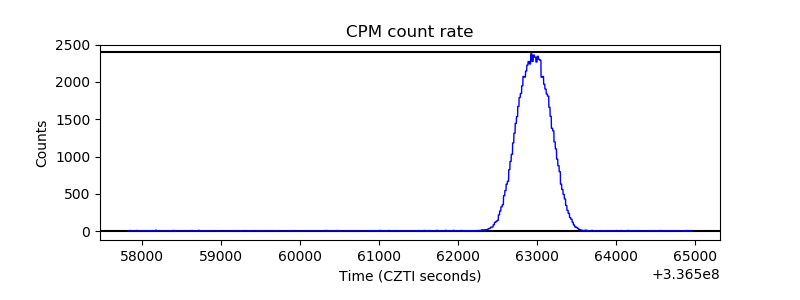 |
| CZT Counter | 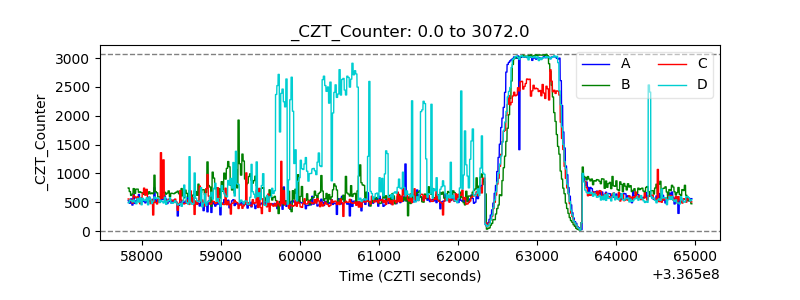 |
| +2.5 Volts monitor | 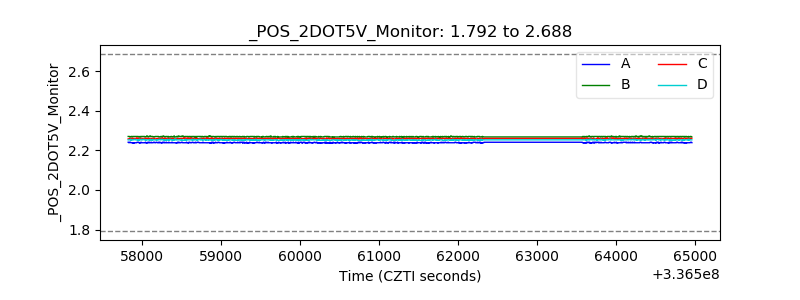 |
| +5 Volts monitor | 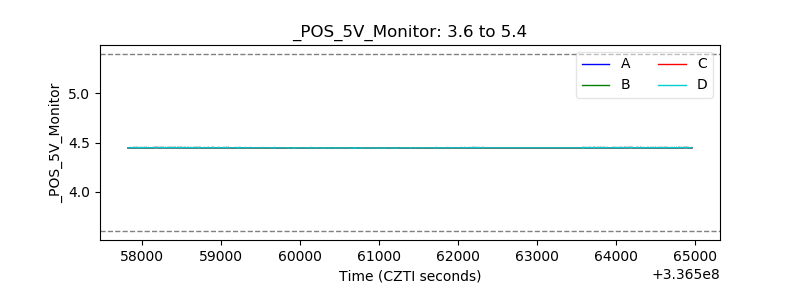 |
| _ROLL_ROT | 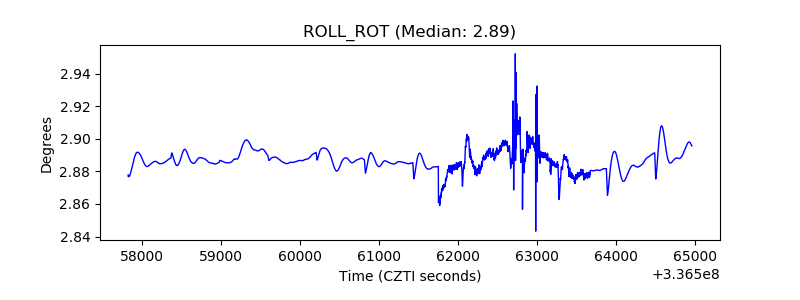 |
| _Roll_DEC | 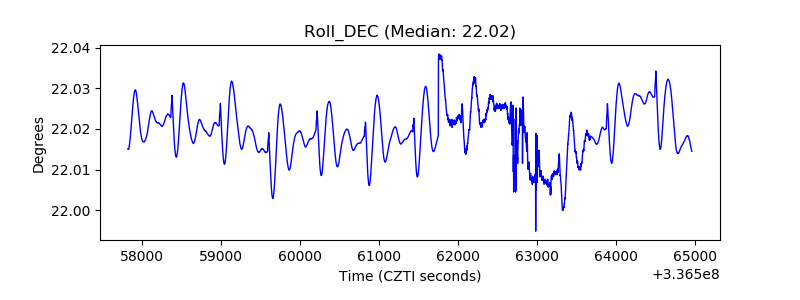 |
| _Roll_RA | 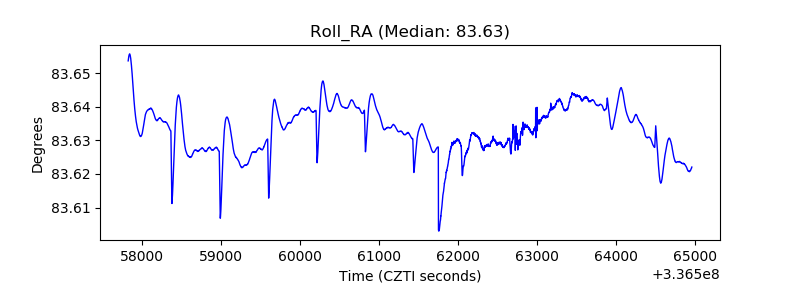 |
| Veto Counter | 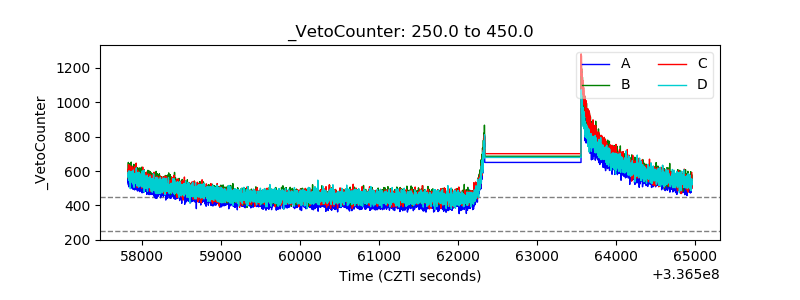 |