| Param | Original file | Final file |
|---|---|---|
| Filename | modeM0/AS1A09_145T01_9000003848_26633cztM0_level2.evt | modeM0/AS1A09_145T01_9000003848_26633cztM0_level2_quad_clean.evt |
| Size (bytes) | 587,145,600 | 93,121,920 |
| Size | 559.9 MB | 88.8 MB |
| Events in quadrant A | 3,523,449 | 617,192 |
| Events in quadrant B | 3,907,884 | 614,180 |
| Events in quadrant C | 3,549,883 | 588,977 |
| Events in quadrant D | 6,386,962 | 573,053 |
| Mode M0 | |||
|---|---|---|---|
| Quadrant | BADHDUFLAG | Total packets | Discarded packets |
| A | 0 | 14114 | 0 |
| B | 0 | 15972 | 0 |
| C | 0 | 14309 | 0 |
| D | 0 | 22863 | 0 |
| Mode M9 | |||
|---|---|---|---|
| Quadrant | BADHDUFLAG | Total packets | Discarded packets |
| A | 0 | 13 | 0 |
| B | 0 | 13 | 0 |
| C | 0 | 13 | 0 |
| D | 0 | 13 | 0 |
| Quadrant | Total seconds | Saturated seconds | Saturation percentage |
|---|---|---|---|
| A | 6114 | 68 | 1.112202% |
| B | 6114 | 66 | 1.079490% |
| C | 6114 | 97 | 1.586523% |
| D | 6113 | 1190 | 19.466710% |
Noise dominated data is calculated using 1-second bins in cleaned event files. If a bin has >2000 counts, and if more than 50% of those come from <1% of pixels, then it is considered to be noise-dominated and hence unusable.
| Quadrant | # 1 sec bins | Bins with >0 counts | Bins with >2000 counts | High rate bins dominated by noise | Noise dominated (total time) | Noise dominated (detector-on time) | Marked lightcurve |
|---|---|---|---|---|---|---|---|
| A | 7419 | 6115 | 10 | 10 | 0.13% | 0.16% | 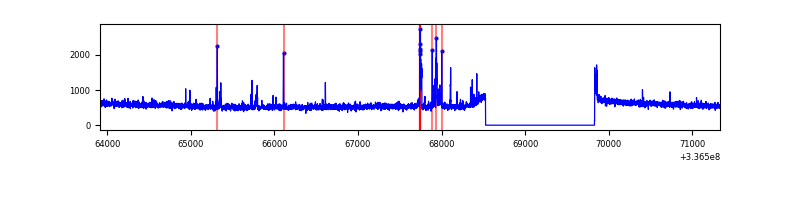 |
| B | 7419 | 6115 | 6 | 6 | 0.08% | 0.10% | 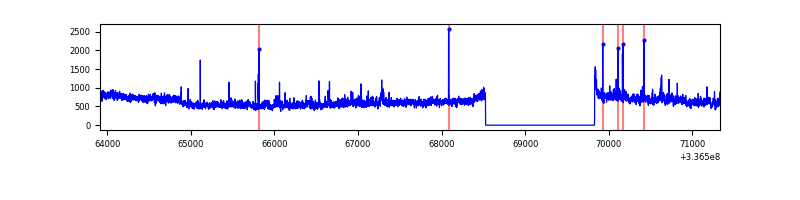 |
| C | 7419 | 6115 | 15 | 15 | 0.20% | 0.25% | 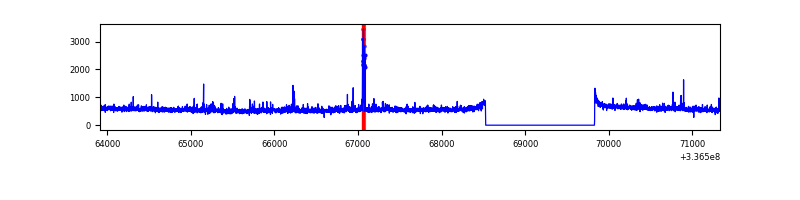 |
| D | 7419 | 6115 | 1039 | 1039 | 14.00% | 16.99% | 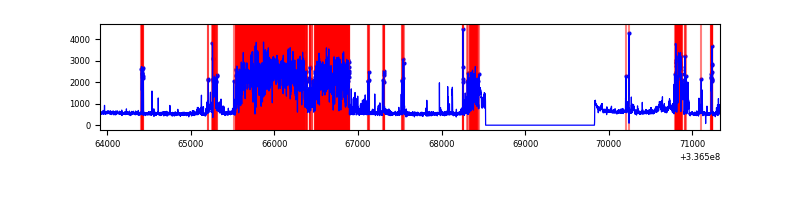 |
Top three noisy pixels from each quadrant. If the there are fewer than three noisy pixels in the level2.evt file, extra rows are filled as -1
| Pixel properties | Quadrant properties | ||||||
|---|---|---|---|---|---|---|---|
| Quadrant | DetID | PixID | Counts | Sigma | Mean | Median | Sigma |
| A | 0 | 13 | 145505 | 838.78 | 876 | 864 | 172.4 |
| A | 13 | 254 | 9953 | 52.71 | 876 | 864 | 172.4 |
| A | 0 | 226 | 7816 | 40.31 | 876 | 864 | 172.4 |
| B | 0 | 189 | 477640 | 3009.54 | 851 | 836 | 158.4 |
| B | 10 | 245 | 59403 | 369.67 | 851 | 836 | 158.4 |
| B | 3 | 112 | 19210 | 115.97 | 851 | 836 | 158.4 |
| C | 3 | 233 | 166850 | 882.81 | 817 | 826 | 188.1 |
| C | 14 | 238 | 134848 | 712.64 | 817 | 826 | 188.1 |
| C | 2 | 16 | 52651 | 275.57 | 817 | 826 | 188.1 |
| D | 12 | 233 | 2118840 | 11084.55 | 780 | 760 | 191.1 |
| D | 1 | 52 | 685785 | 3584.94 | 780 | 760 | 191.1 |
| D | 7 | 80 | 557754 | 2914.92 | 780 | 760 | 191.1 |
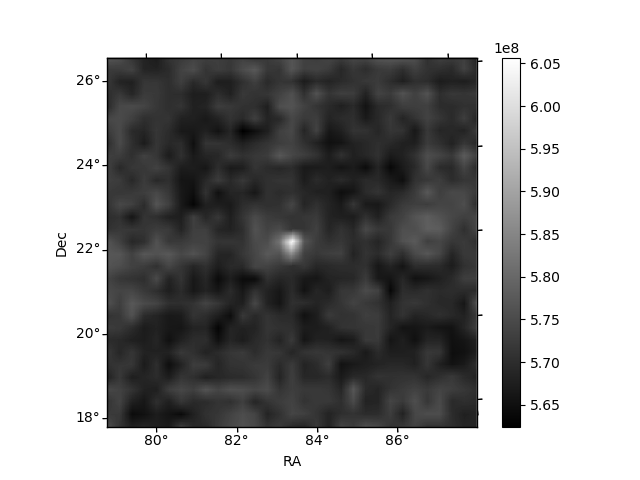
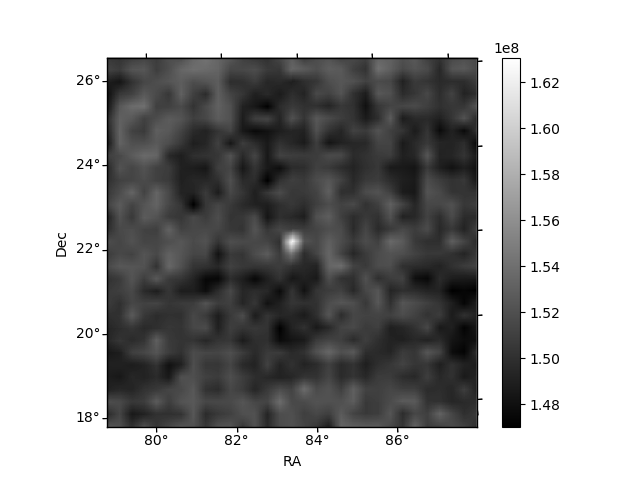
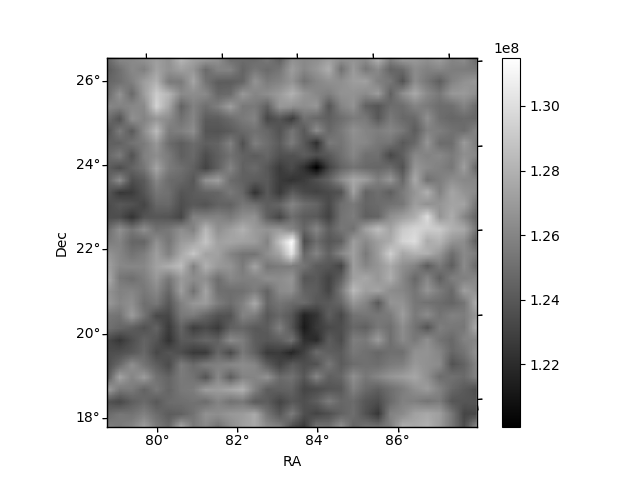
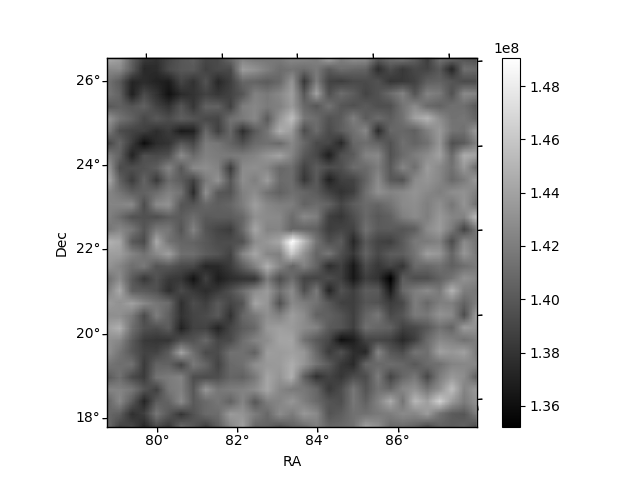
Histogram calculated using DETX and DETY for each event in the final _common_clean file
| Quadrant A | 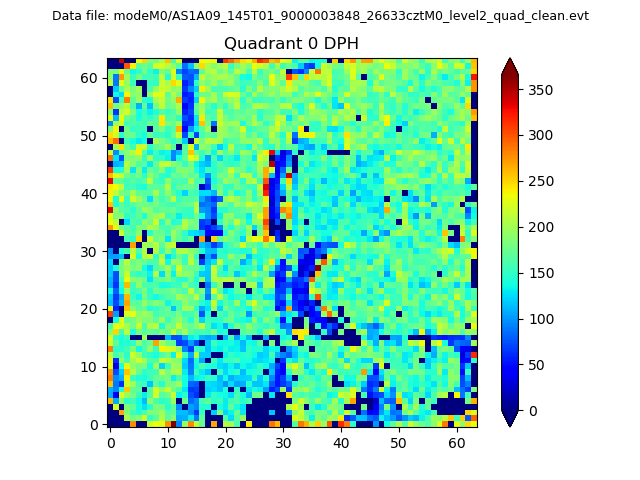 |
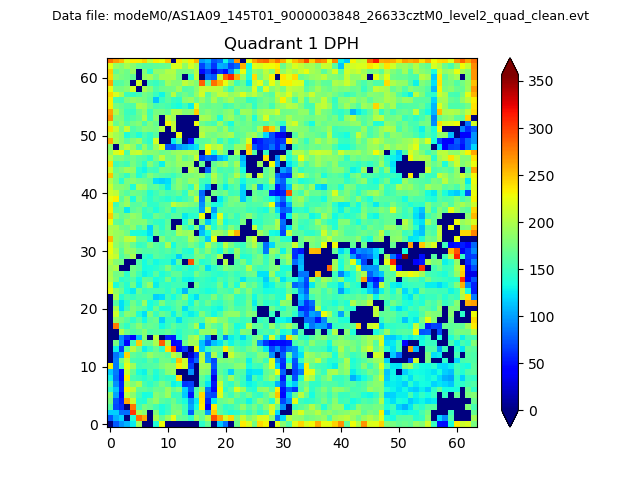 |
Quadrant B |
|---|---|---|---|
| Quadrant D | 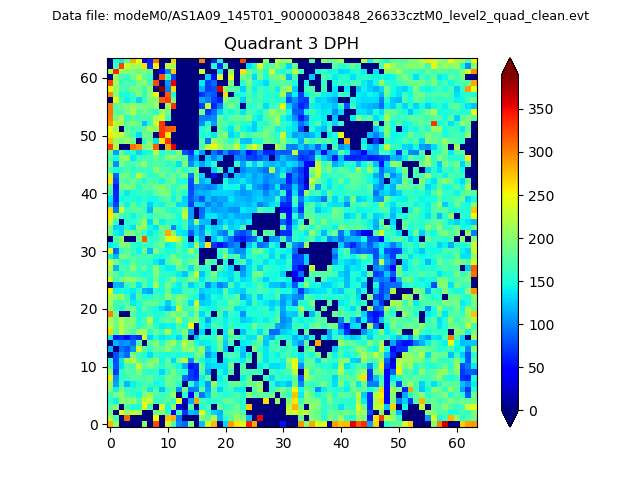 |
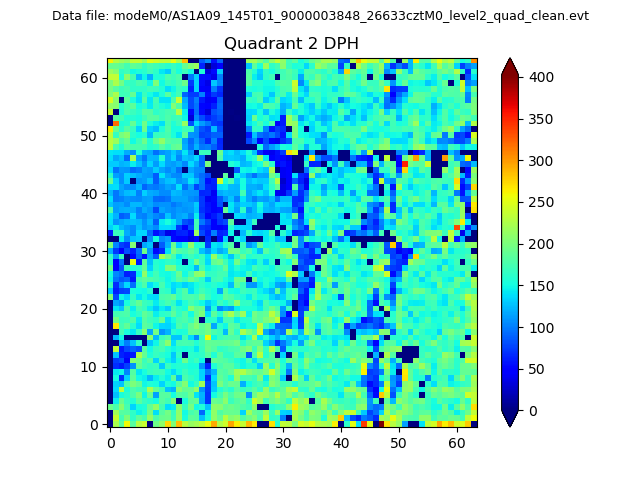 |
Quadrant C |
| Plot type | Count rate plots | Images |
|---|---|---|
| Comparison with Poisson distribution Blue bars denote a histogram of data divided into 1 sec bins. Red curve is a Poisson curve with rate = median count rate of data. |
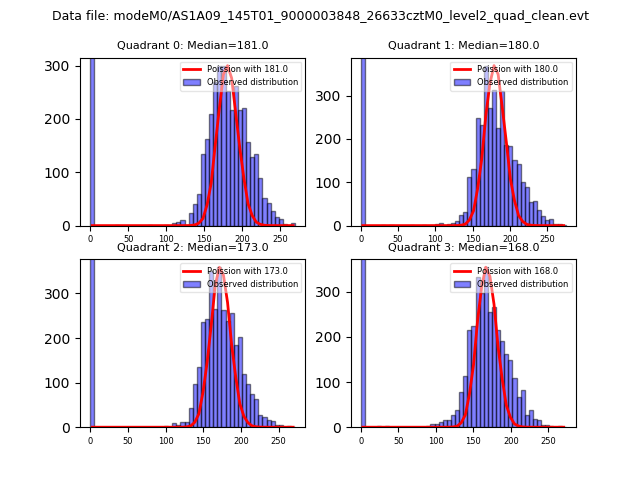 |
 |
| Quadrant-wise count rates Data is divided into 100 sec bins |
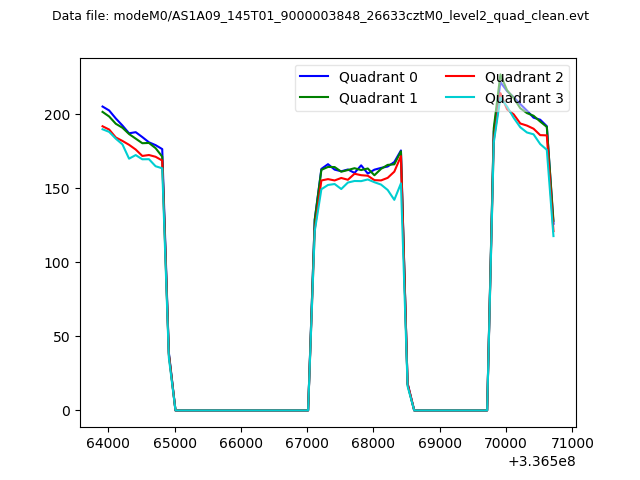 |
|
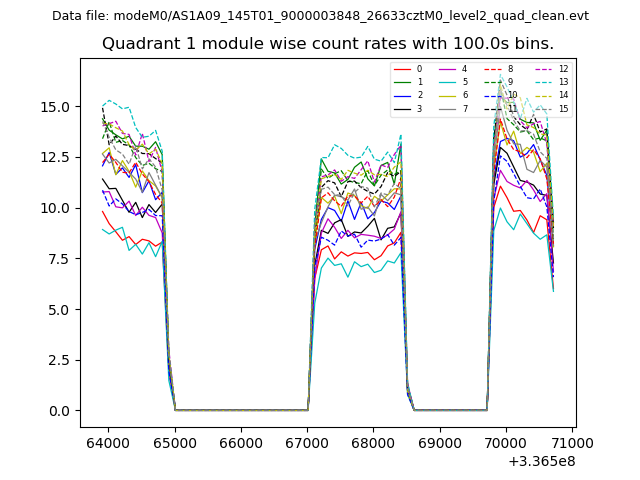
| Module-wise count rates for Quadrant A Data is divided into 100 sec bins |
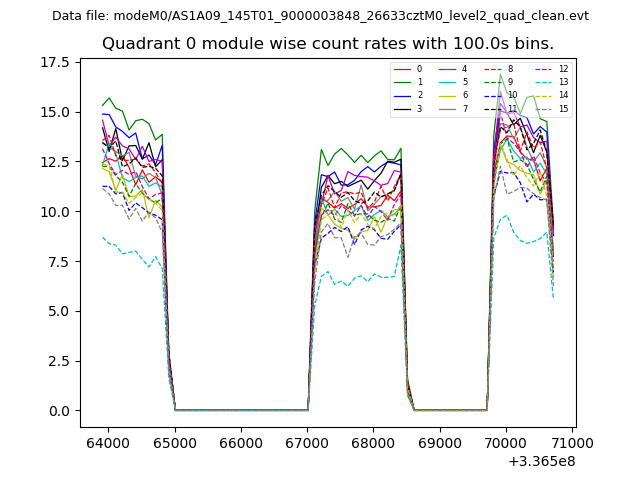 |
 |
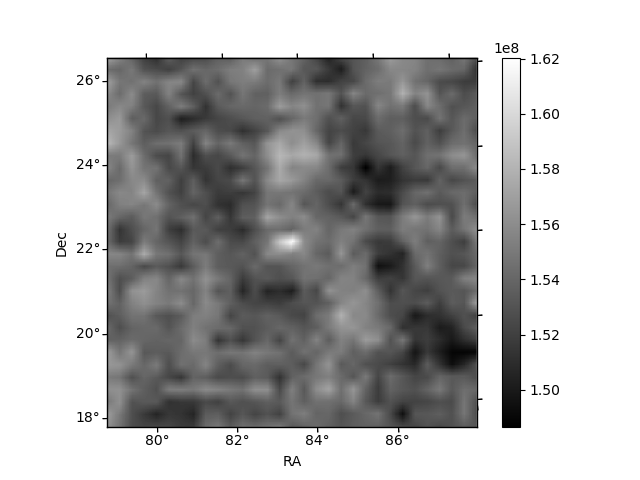
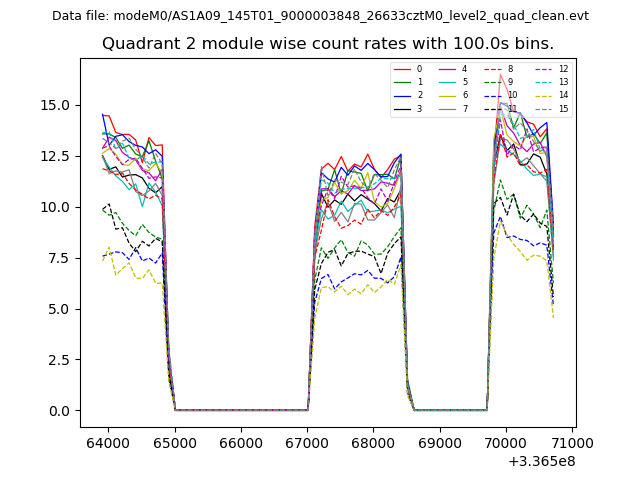
| Module-wise count rates for Quadrant B Data is divided into 100 sec bins |
 |
 |
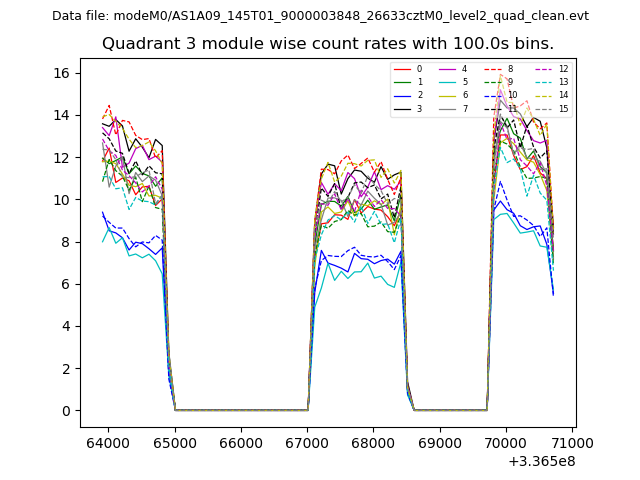
| Module-wise count rates for Quadrant C Data is divided into 100 sec bins |
 |
 |
| Module-wise count rates for Quadrant D Data is divided into 100 sec bins |
 |
 |
| Parameter | Plot |
|---|---|
| CZT HV Monitor | 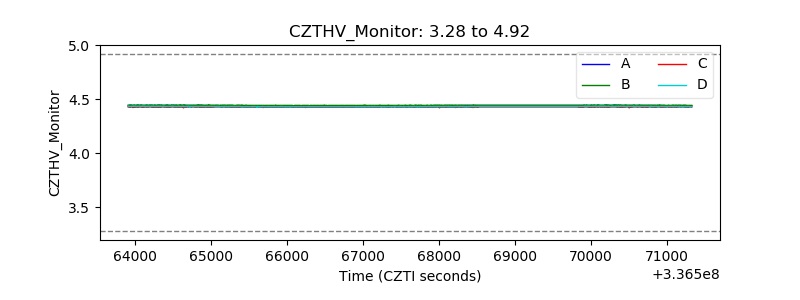 |
| D_VDD | 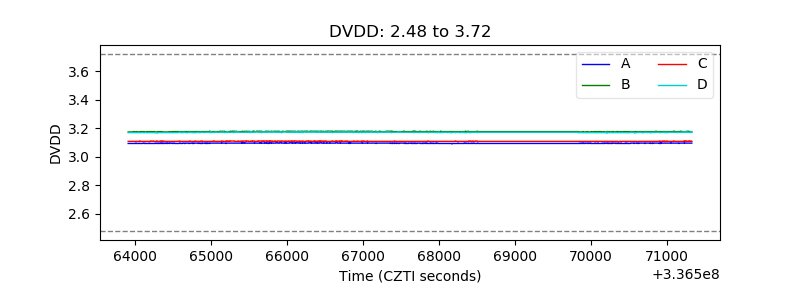 |
| Temperature 1 | 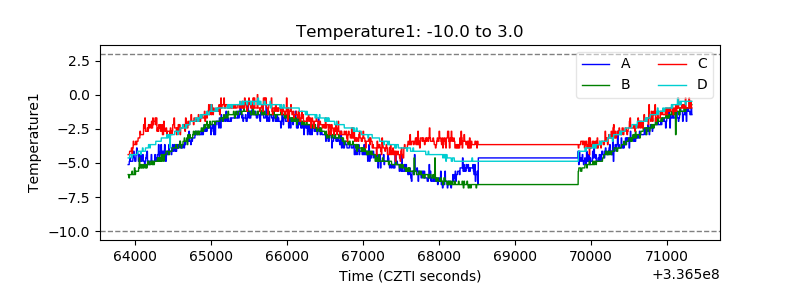 |
| Veto HV Monitor | 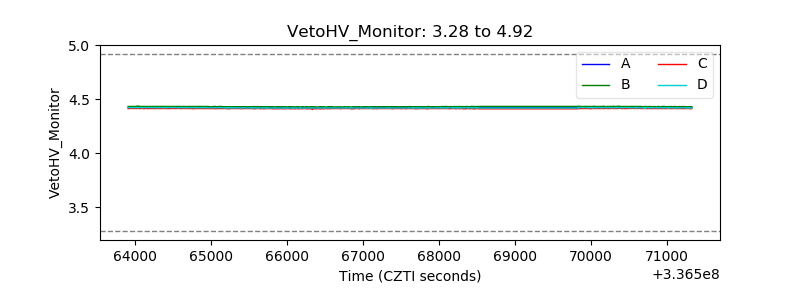 |
| Veto LLD | 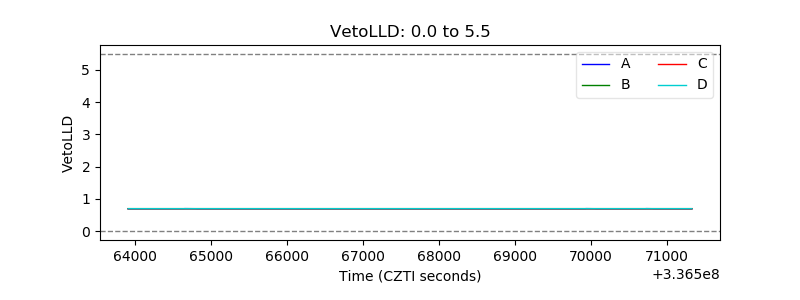 |
| Alpha Counter | 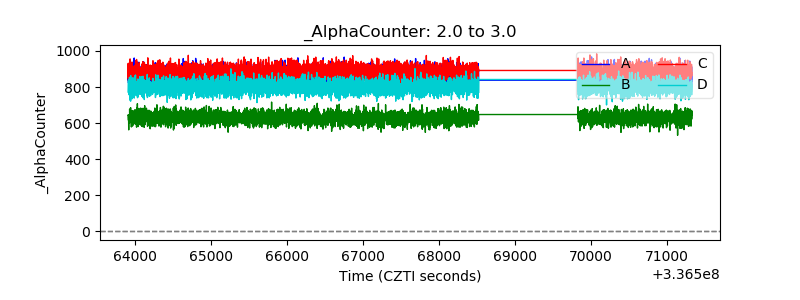 |
| _CPM_Rate | 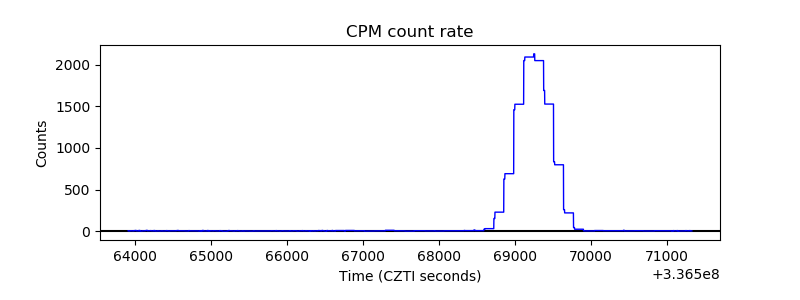 |
| CZT Counter | 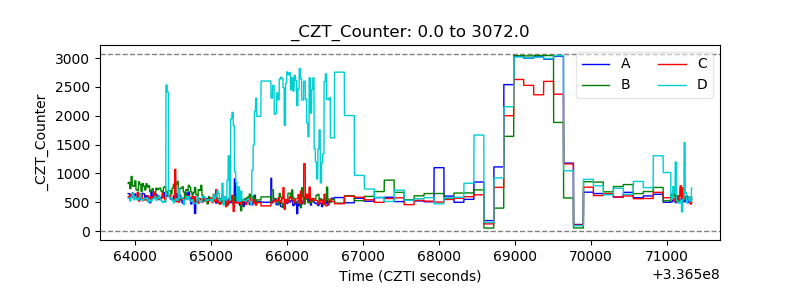 |
| +2.5 Volts monitor | 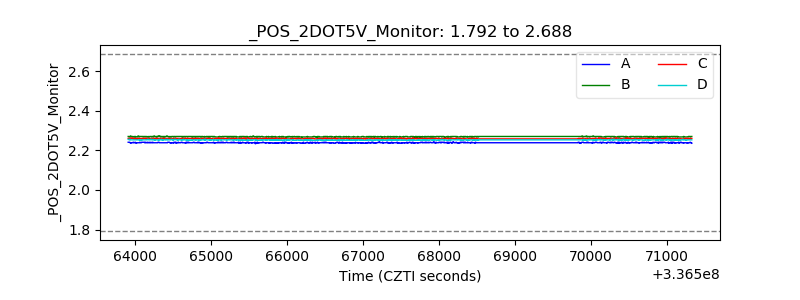 |
| +5 Volts monitor | 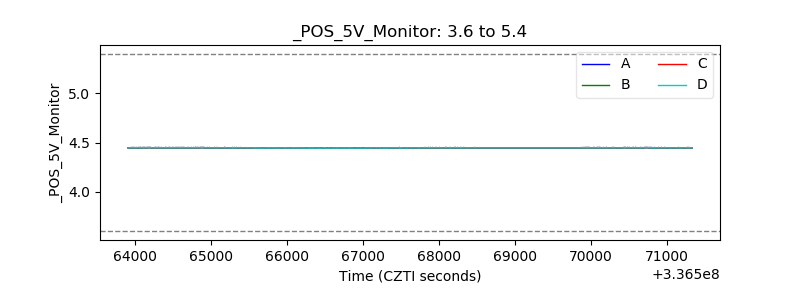 |
| _ROLL_ROT | 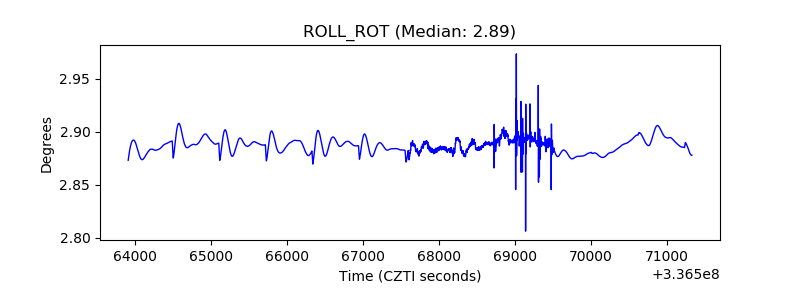 |
| _Roll_DEC | 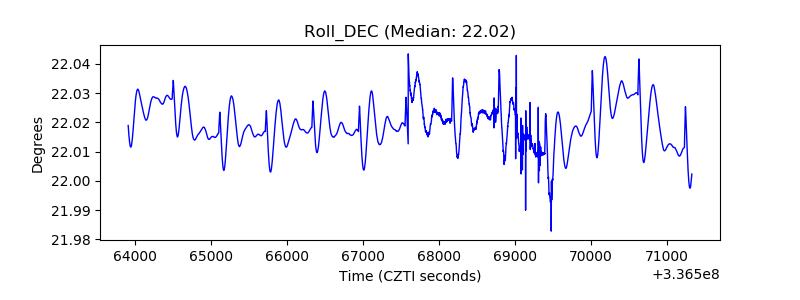 |
| _Roll_RA | 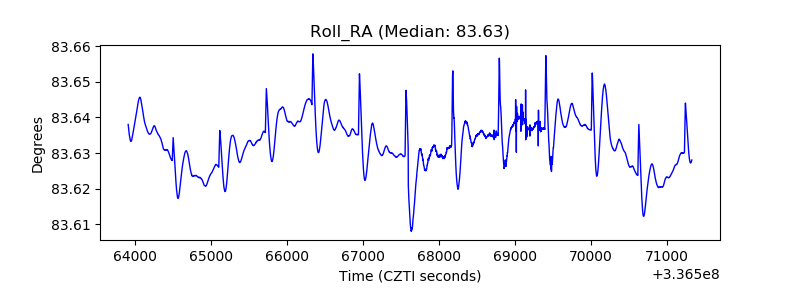 |
| Veto Counter | 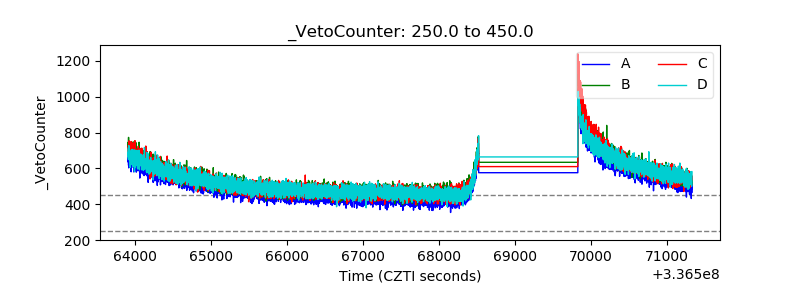 |