| Param | Original file | Final file |
|---|---|---|
| Filename | modeM0/AS1A09_145T01_9000003848_26634cztM0_level2.evt | modeM0/AS1A09_145T01_9000003848_26634cztM0_level2_quad_clean.evt |
| Size (bytes) | 575,072,640 | 87,739,200 |
| Size | 548.4 MB | 83.7 MB |
| Events in quadrant A | 3,569,002 | 572,508 |
| Events in quadrant B | 4,356,023 | 564,476 |
| Events in quadrant C | 3,735,009 | 545,373 |
| Events in quadrant D | 5,323,935 | 529,022 |
| Mode M0 | |||
|---|---|---|---|
| Quadrant | BADHDUFLAG | Total packets | Discarded packets |
| A | 0 | 14399 | 0 |
| B | 0 | 17421 | 0 |
| C | 0 | 15135 | 0 |
| D | 0 | 20241 | 0 |
| Mode M9 | |||
|---|---|---|---|
| Quadrant | BADHDUFLAG | Total packets | Discarded packets |
| A | 0 | 14 | 0 |
| B | 0 | 14 | 0 |
| C | 0 | 14 | 0 |
| D | 0 | 14 | 0 |
| Quadrant | Total seconds | Saturated seconds | Saturation percentage |
|---|---|---|---|
| A | 6393 | 69 | 1.079305% |
| B | 6394 | 201 | 3.143572% |
| C | 6394 | 105 | 1.642165% |
| D | 6394 | 301 | 4.707538% |
Noise dominated data is calculated using 1-second bins in cleaned event files. If a bin has >2000 counts, and if more than 50% of those come from <1% of pixels, then it is considered to be noise-dominated and hence unusable.
| Quadrant | # 1 sec bins | Bins with >0 counts | Bins with >2000 counts | High rate bins dominated by noise | Noise dominated (total time) | Noise dominated (detector-on time) | Marked lightcurve |
|---|---|---|---|---|---|---|---|
| A | 7713 | 6395 | 1 | 1 | 0.01% | 0.02% | 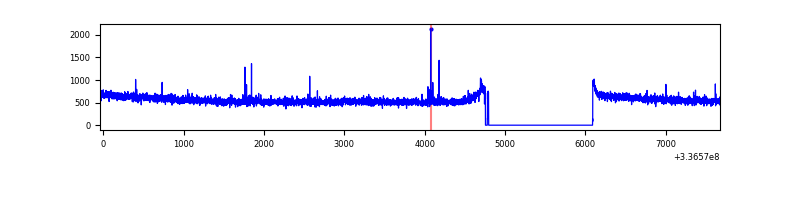 |
| B | 7714 | 6396 | 96 | 96 | 1.24% | 1.50% | 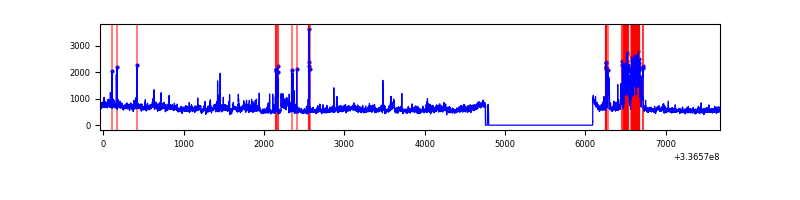 |
| C | 7714 | 6396 | 0 | 0 | 0.00% | 0.00% | 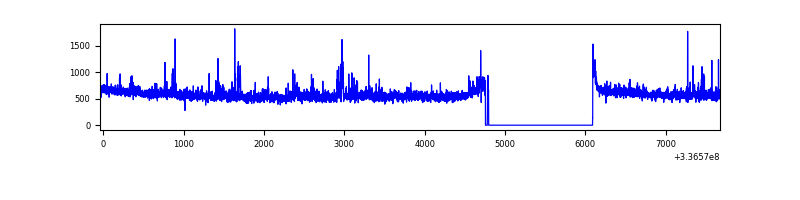 |
| D | 7714 | 6396 | 218 | 218 | 2.83% | 3.41% | 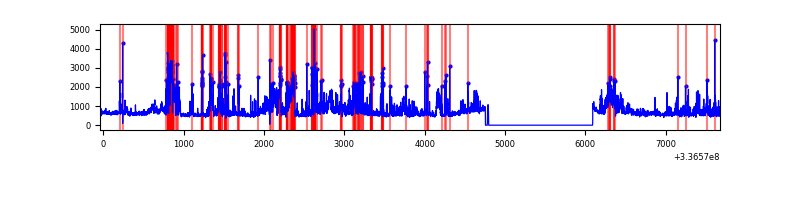 |
Top three noisy pixels from each quadrant. If the there are fewer than three noisy pixels in the level2.evt file, extra rows are filled as -1
| Pixel properties | Quadrant properties | ||||||
|---|---|---|---|---|---|---|---|
| Quadrant | DetID | PixID | Counts | Sigma | Mean | Median | Sigma |
| A | 0 | 13 | 27896 | 149.08 | 919 | 907 | 181.0 |
| A | 13 | 254 | 10746 | 54.35 | 919 | 907 | 181.0 |
| A | 0 | 226 | 8115 | 39.81 | 919 | 907 | 181.0 |
| B | 10 | 245 | 430842 | 2601.91 | 891 | 874 | 165.3 |
| B | 0 | 189 | 321314 | 1939.11 | 891 | 874 | 165.3 |
| B | 3 | 112 | 59343 | 353.82 | 891 | 874 | 165.3 |
| C | 3 | 233 | 211001 | 1055.76 | 865 | 874 | 199.0 |
| C | 14 | 238 | 143046 | 714.33 | 865 | 874 | 199.0 |
| C | 15 | 208 | 6360 | 27.56 | 865 | 874 | 199.0 |
| D | 1 | 52 | 855848 | 4046.51 | 876 | 855 | 211.3 |
| D | 7 | 80 | 657949 | 3109.89 | 876 | 855 | 211.3 |
| D | 12 | 233 | 319252 | 1506.91 | 876 | 855 | 211.3 |
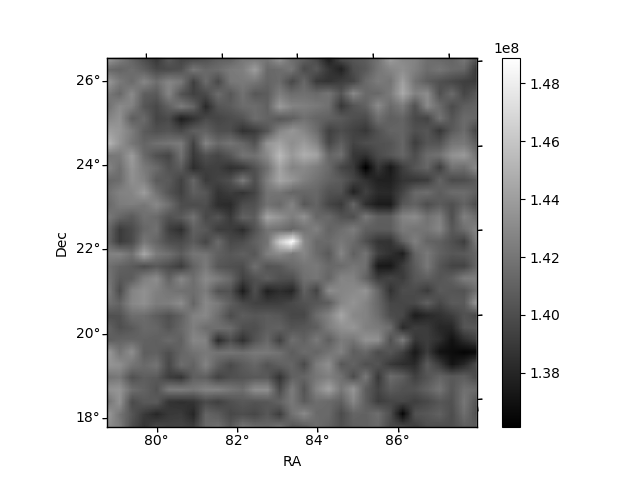
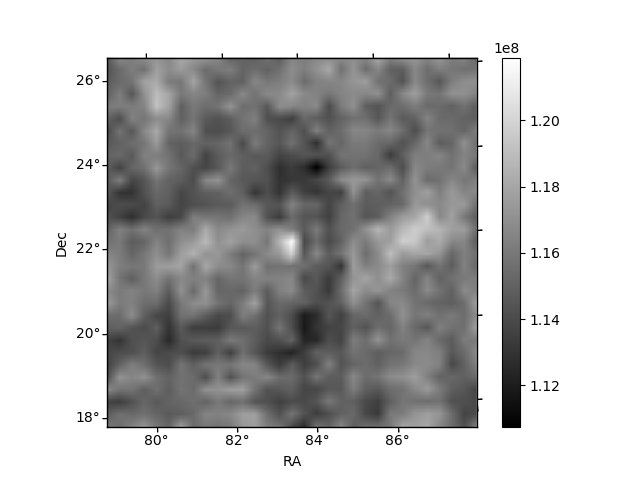
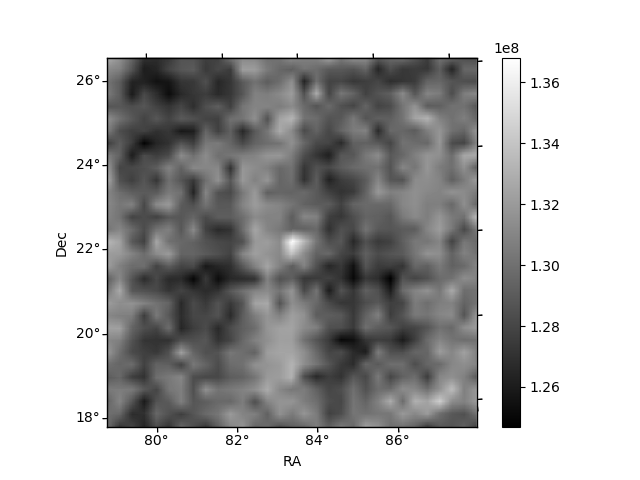
Histogram calculated using DETX and DETY for each event in the final _common_clean file
| Quadrant A | 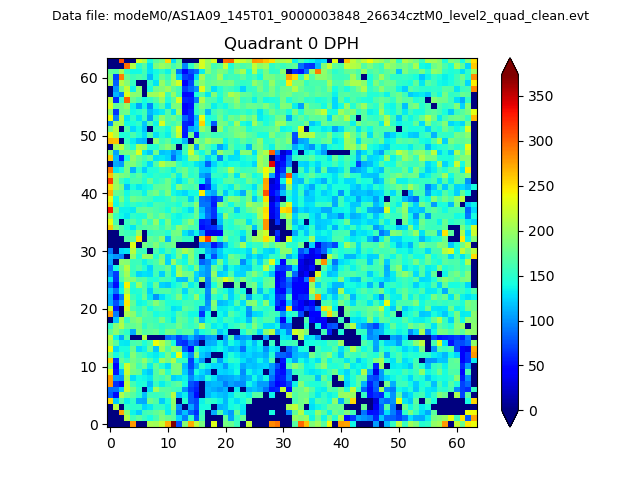 |
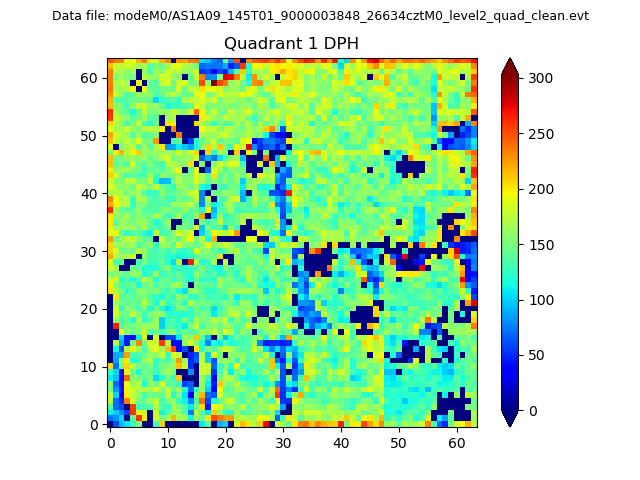 |
Quadrant B |
|---|---|---|---|
| Quadrant D | 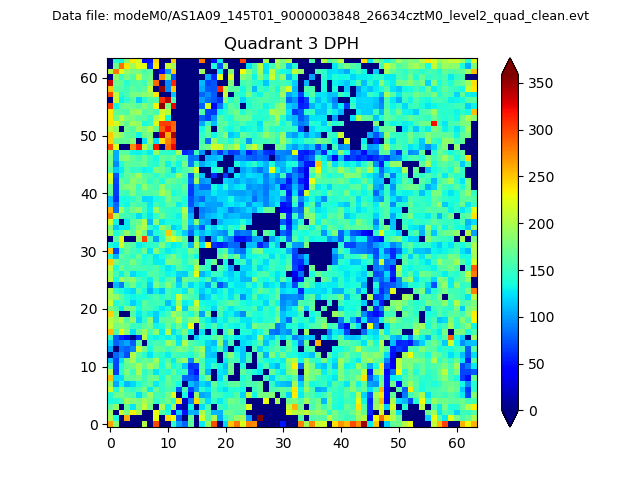 |
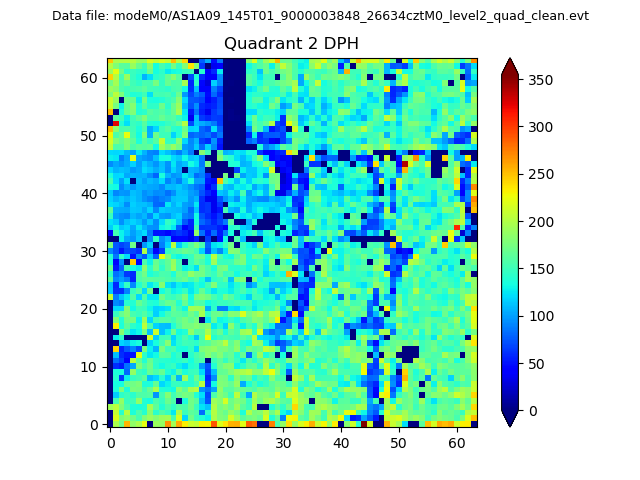 |
Quadrant C |
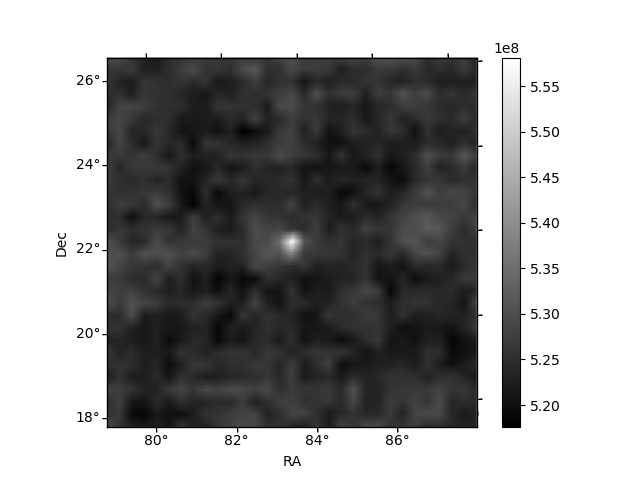
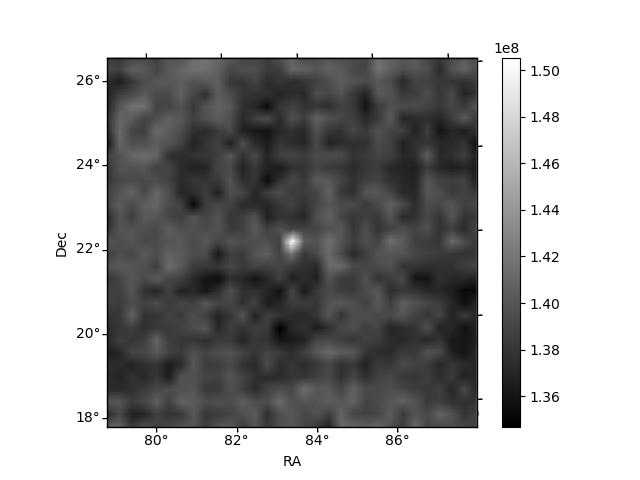
| Plot type | Count rate plots | Images |
|---|---|---|
| Comparison with Poisson distribution Blue bars denote a histogram of data divided into 1 sec bins. Red curve is a Poisson curve with rate = median count rate of data. |
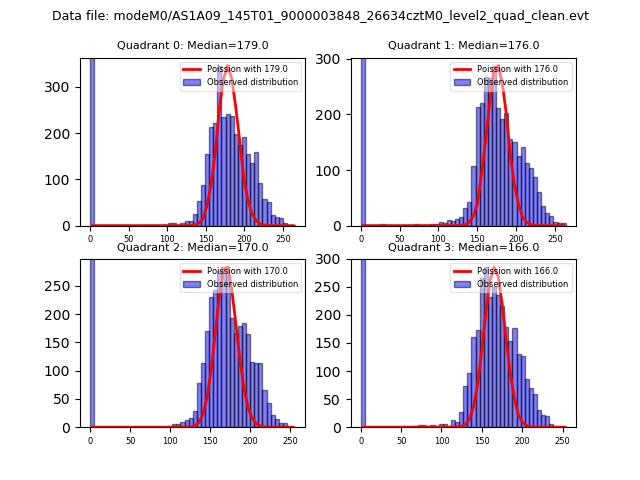 |
 |
| Quadrant-wise count rates Data is divided into 100 sec bins |
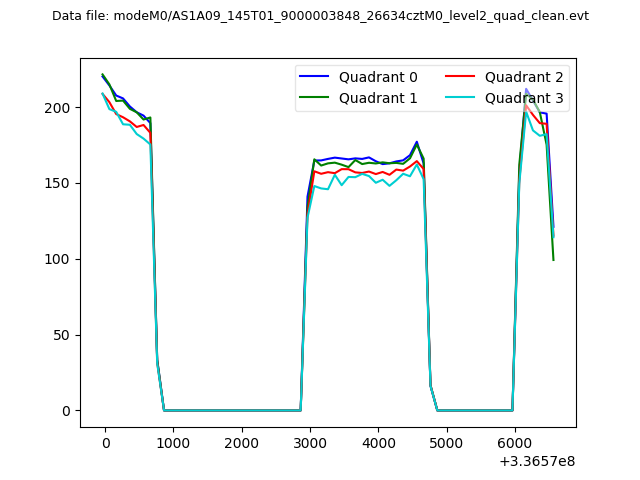 |
|
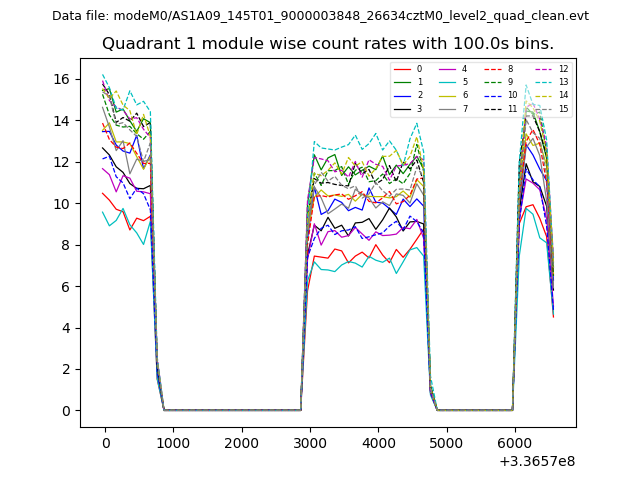
| Module-wise count rates for Quadrant A Data is divided into 100 sec bins |
 |
 |
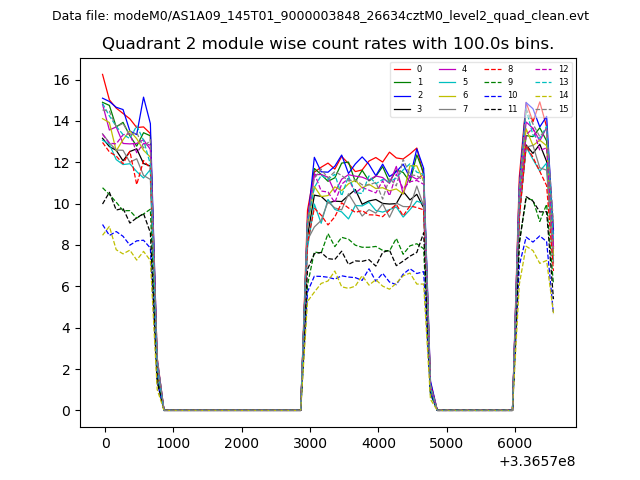
| Module-wise count rates for Quadrant B Data is divided into 100 sec bins |
 |
 |
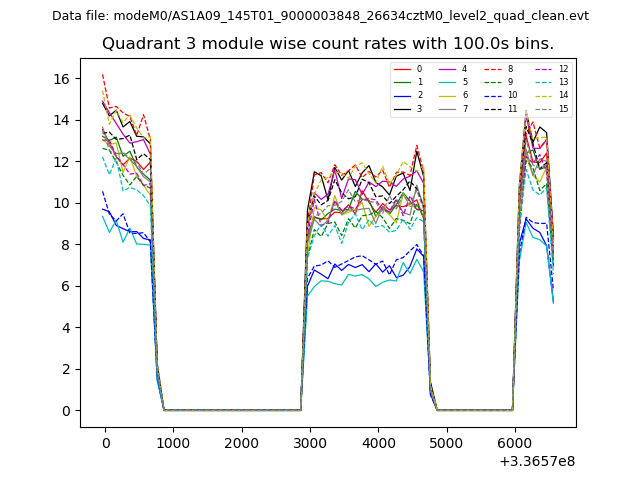
| Module-wise count rates for Quadrant C Data is divided into 100 sec bins |
 |
 |
| Module-wise count rates for Quadrant D Data is divided into 100 sec bins |
 |
 |
| Parameter | Plot |
|---|---|
| CZT HV Monitor | 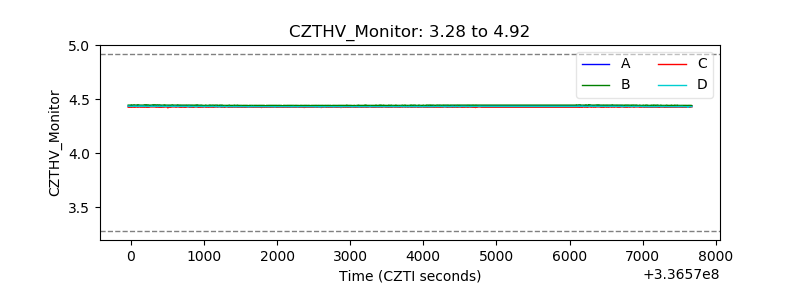 |
| D_VDD | 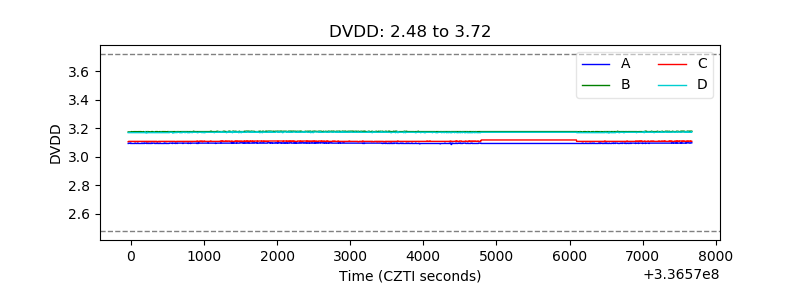 |
| Temperature 1 | 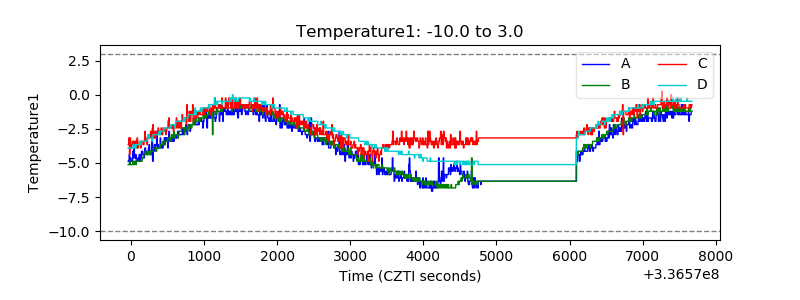 |
| Veto HV Monitor | 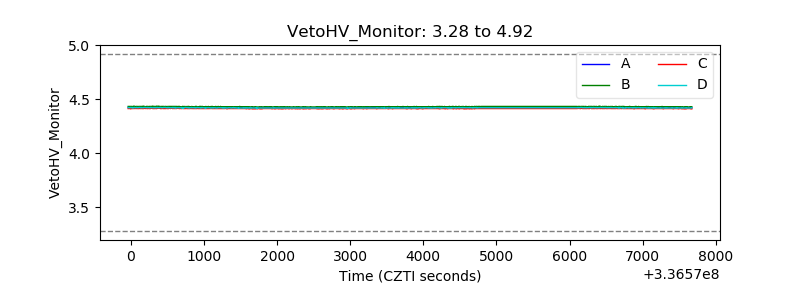 |
| Veto LLD | 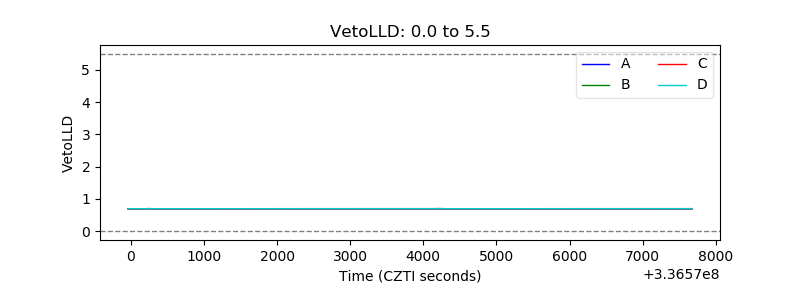 |
| Alpha Counter | 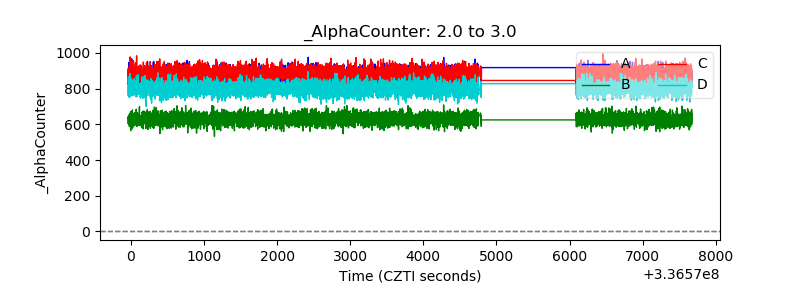 |
| _CPM_Rate | 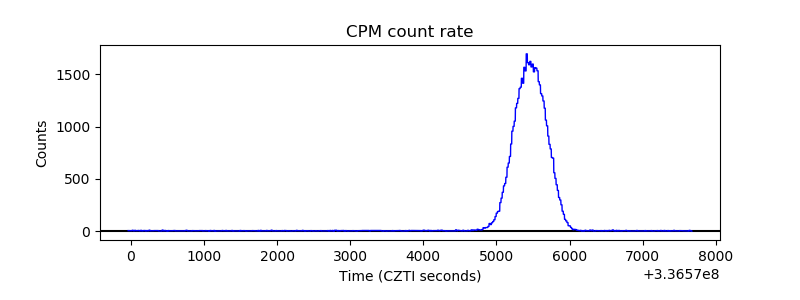 |
| CZT Counter | 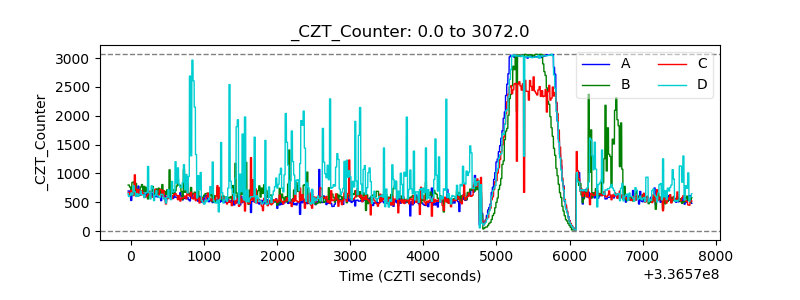 |
| +2.5 Volts monitor |  |
| +5 Volts monitor | 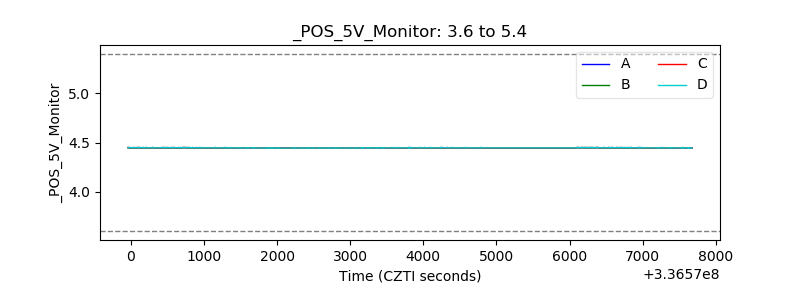 |
| _ROLL_ROT | 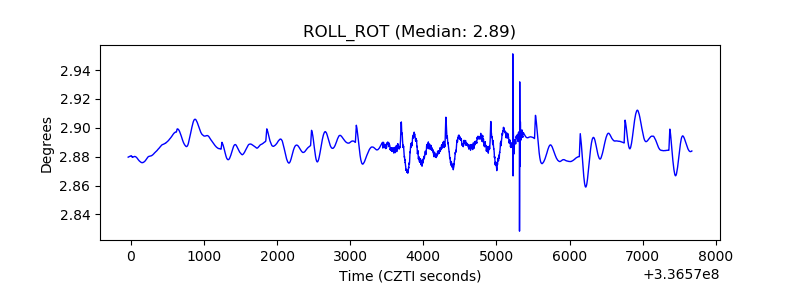 |
| _Roll_DEC | 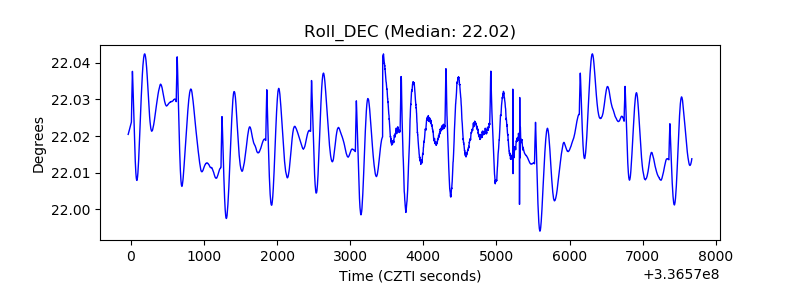 |
| _Roll_RA | 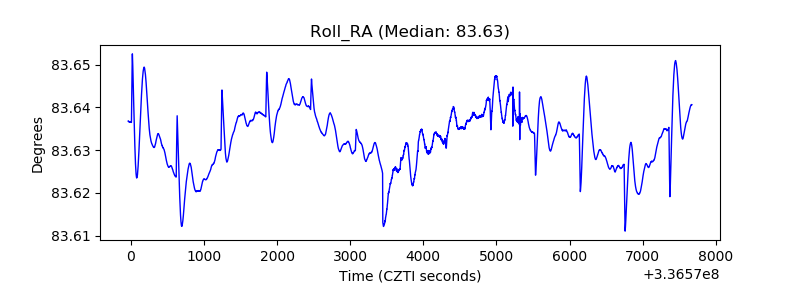 |
| Veto Counter | 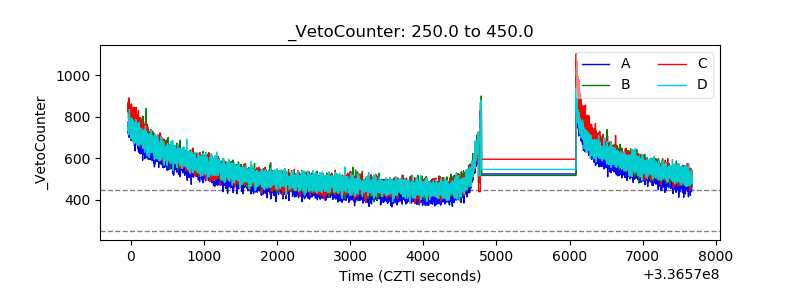 |