| Param | Original file | Final file |
|---|---|---|
| Filename | modeM0/AS1A09_145T01_9000003848_26635cztM0_level2.evt | modeM0/AS1A09_145T01_9000003848_26635cztM0_level2_quad_clean.evt |
| Size (bytes) | 602,841,600 | 78,897,600 |
| Size | 574.9 MB | 75.2 MB |
| Events in quadrant A | 3,664,730 | 503,769 |
| Events in quadrant B | 4,223,320 | 498,476 |
| Events in quadrant C | 3,917,545 | 482,239 |
| Events in quadrant D | 6,006,826 | 446,242 |
| Mode M0 | |||
|---|---|---|---|
| Quadrant | BADHDUFLAG | Total packets | Discarded packets |
| A | 0 | 14673 | 0 |
| B | 0 | 16706 | 0 |
| C | 0 | 15692 | 0 |
| D | 0 | 22245 | 0 |
| Mode M9 | |||
|---|---|---|---|
| Quadrant | BADHDUFLAG | Total packets | Discarded packets |
| A | 0 | 12 | 0 |
| B | 0 | 12 | 0 |
| C | 0 | 12 | 0 |
| D | 0 | 12 | 0 |
| Quadrant | Total seconds | Saturated seconds | Saturation percentage |
|---|---|---|---|
| A | 6565 | 119 | 1.812643% |
| B | 6566 | 230 | 3.502894% |
| C | 6566 | 151 | 2.299726% |
| D | 6566 | 690 | 10.508681% |
Noise dominated data is calculated using 1-second bins in cleaned event files. If a bin has >2000 counts, and if more than 50% of those come from <1% of pixels, then it is considered to be noise-dominated and hence unusable.
| Quadrant | # 1 sec bins | Bins with >0 counts | Bins with >2000 counts | High rate bins dominated by noise | Noise dominated (total time) | Noise dominated (detector-on time) | Marked lightcurve |
|---|---|---|---|---|---|---|---|
| A | 7785 | 6566 | 17 | 17 | 0.22% | 0.26% | 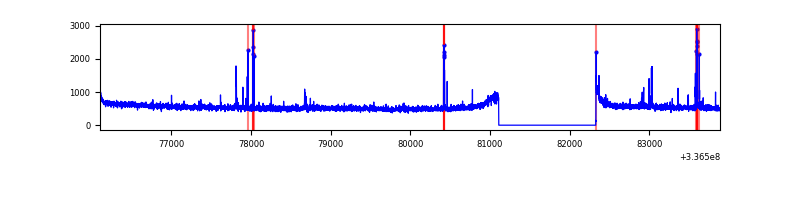 |
| B | 7786 | 6567 | 86 | 86 | 1.10% | 1.31% | 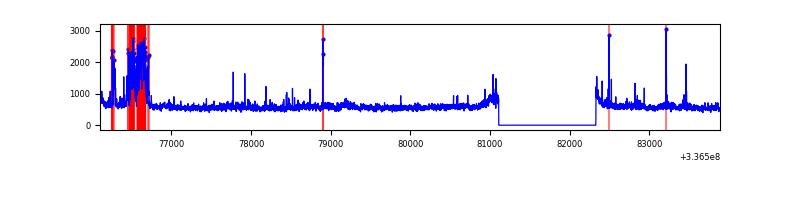 |
| C | 7786 | 6567 | 8 | 8 | 0.10% | 0.12% | 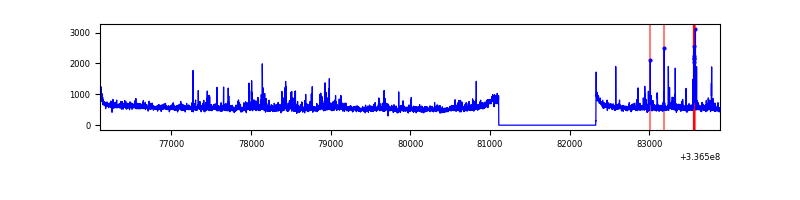 |
| D | 7786 | 6567 | 560 | 560 | 7.19% | 8.53% | 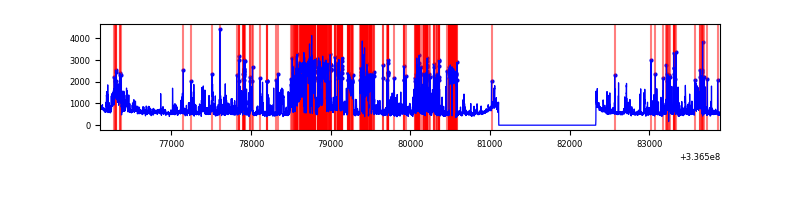 |
Top three noisy pixels from each quadrant. If the there are fewer than three noisy pixels in the level2.evt file, extra rows are filled as -1
| Pixel properties | Quadrant properties | ||||||
|---|---|---|---|---|---|---|---|
| Quadrant | DetID | PixID | Counts | Sigma | Mean | Median | Sigma |
| A | 0 | 13 | 103561 | 557.01 | 922 | 907 | 184.3 |
| A | 13 | 254 | 10759 | 53.46 | 922 | 907 | 184.3 |
| A | 0 | 226 | 8167 | 39.39 | 922 | 907 | 184.3 |
| B | 10 | 245 | 362096 | 2159.86 | 900 | 883 | 167.2 |
| B | 0 | 189 | 232766 | 1386.54 | 900 | 883 | 167.2 |
| B | 3 | 112 | 87275 | 516.58 | 900 | 883 | 167.2 |
| C | 3 | 233 | 244284 | 1202.87 | 876 | 885 | 202.3 |
| C | 14 | 238 | 143324 | 703.93 | 876 | 885 | 202.3 |
| C | 2 | 16 | 109418 | 536.36 | 876 | 885 | 202.3 |
| D | 1 | 52 | 2282472 | 10628.53 | 868 | 845 | 214.7 |
| D | 7 | 80 | 260521 | 1209.65 | 868 | 845 | 214.7 |
| D | 2 | 250 | 110792 | 512.17 | 868 | 845 | 214.7 |
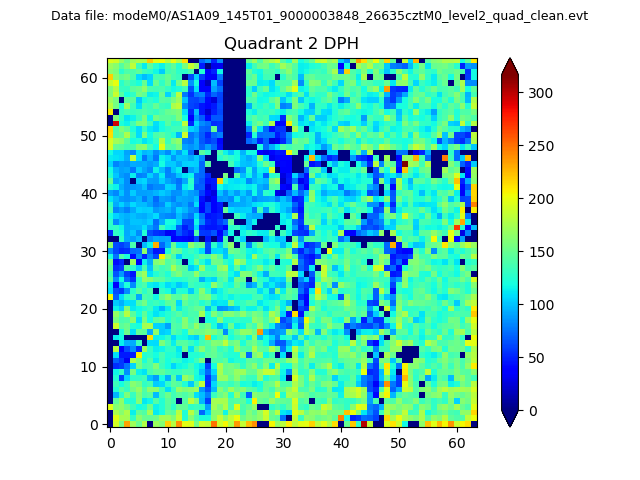
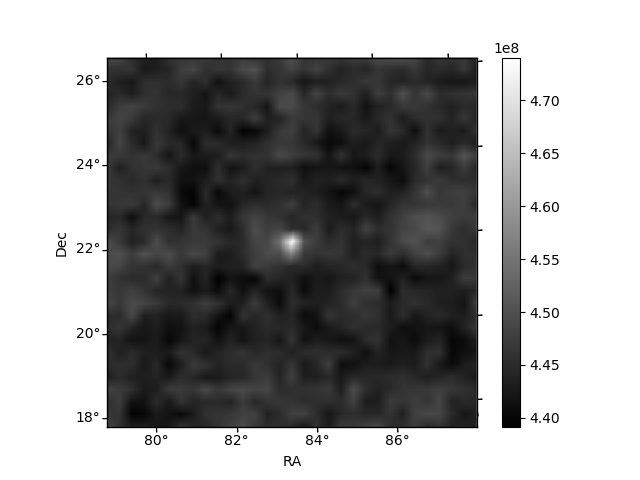
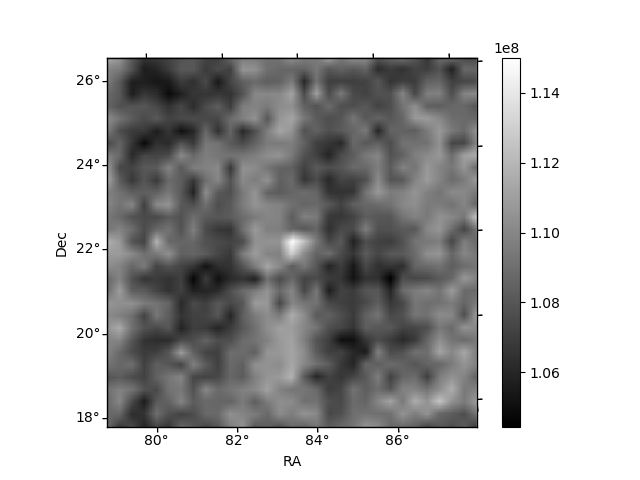
Histogram calculated using DETX and DETY for each event in the final _common_clean file
| Quadrant A | 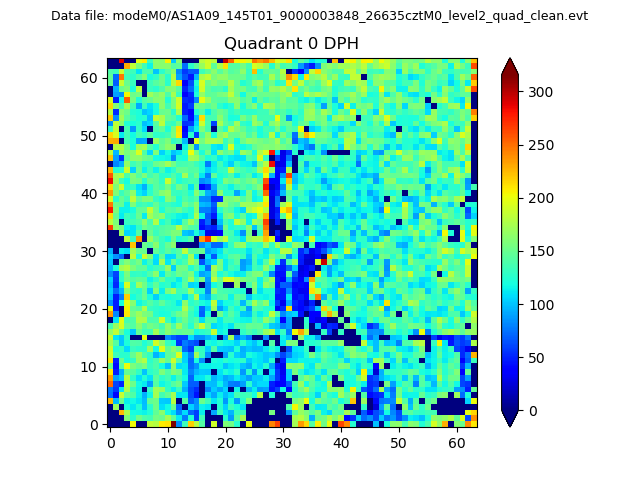 |
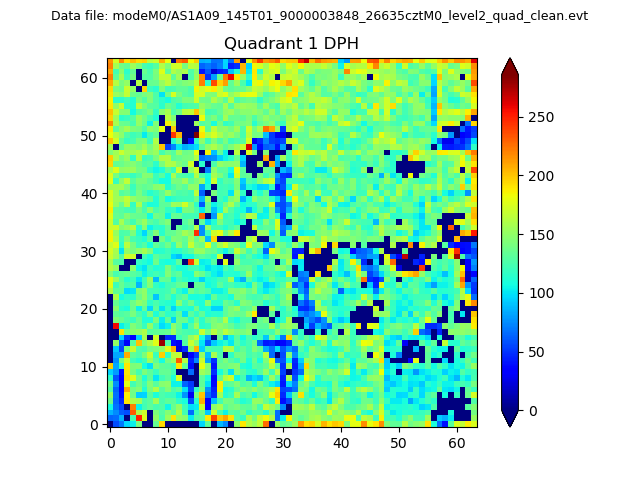 |
Quadrant B |
|---|---|---|---|
| Quadrant D | 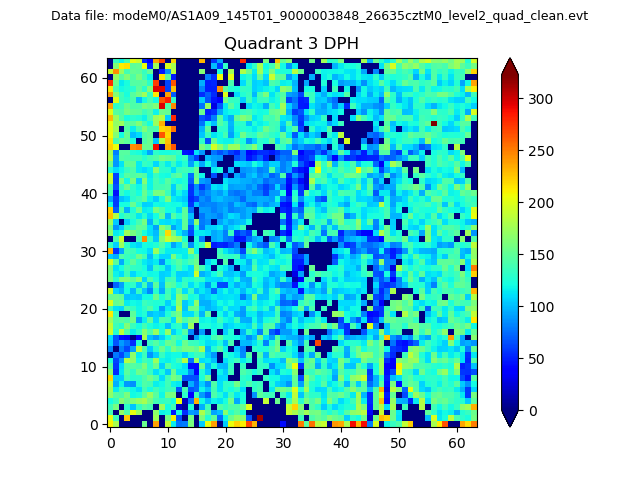 |
 |
Quadrant C |
| Plot type | Count rate plots | Images |
|---|---|---|
| Comparison with Poisson distribution Blue bars denote a histogram of data divided into 1 sec bins. Red curve is a Poisson curve with rate = median count rate of data. |
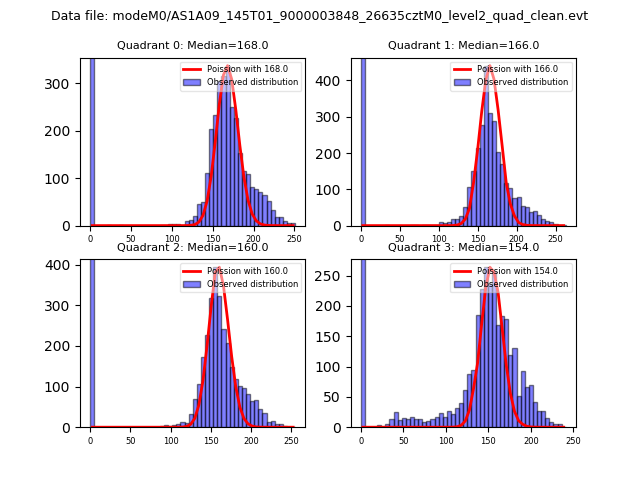 |
 |
| Quadrant-wise count rates Data is divided into 100 sec bins |
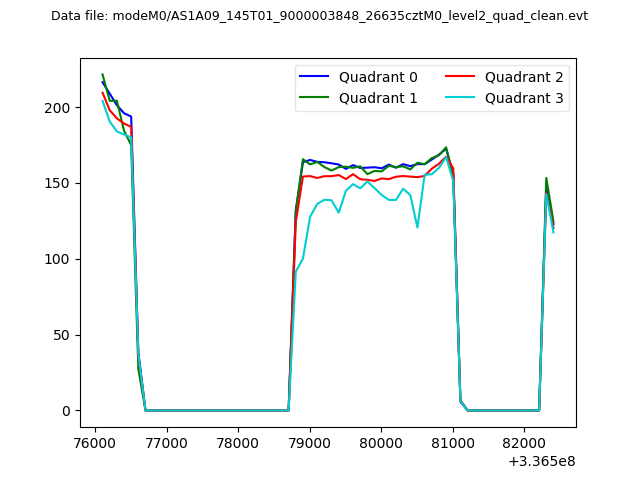 |
|
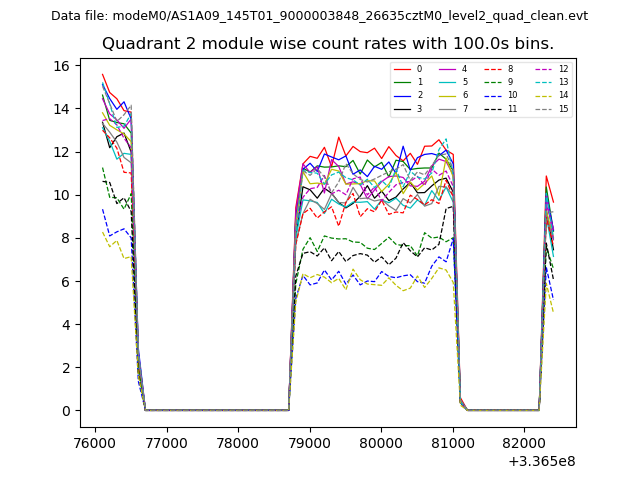
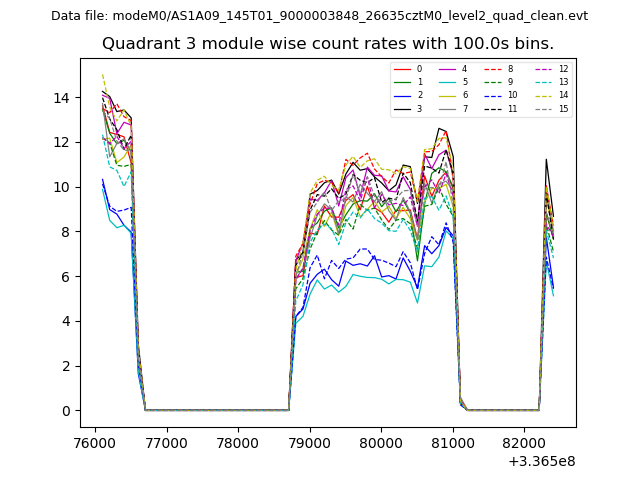
| Module-wise count rates for Quadrant A Data is divided into 100 sec bins |
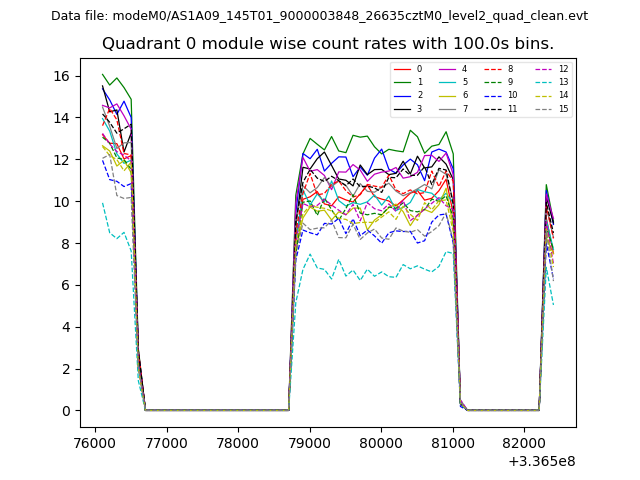 |
 |
| Module-wise count rates for Quadrant B Data is divided into 100 sec bins |
 |
 |
| Module-wise count rates for Quadrant C Data is divided into 100 sec bins |
 |
 |
| Module-wise count rates for Quadrant D Data is divided into 100 sec bins |
 |
 |
| Parameter | Plot |
|---|---|
| CZT HV Monitor | 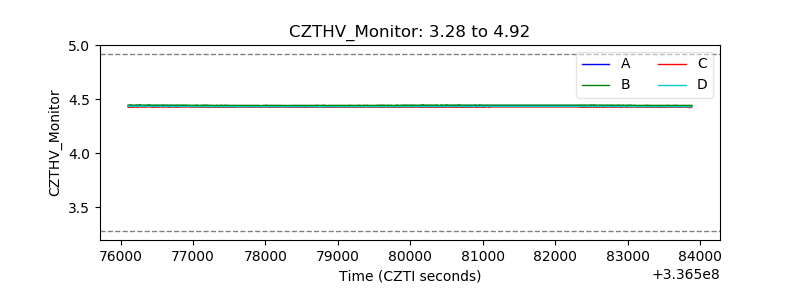 |
| D_VDD | 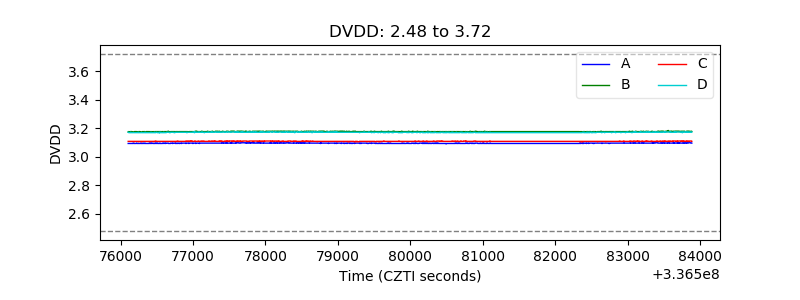 |
| Temperature 1 | 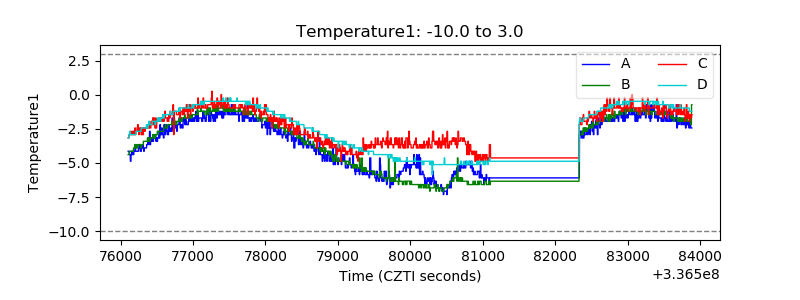 |
| Veto HV Monitor | 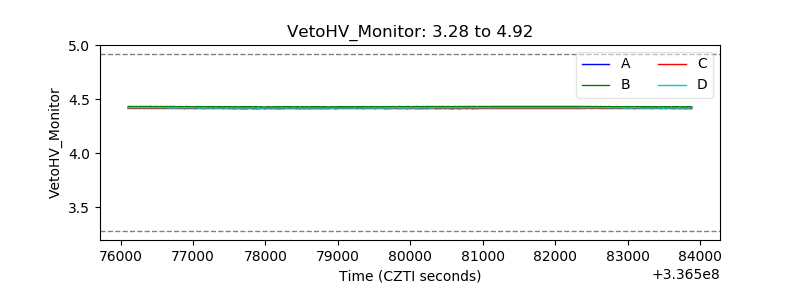 |
| Veto LLD | 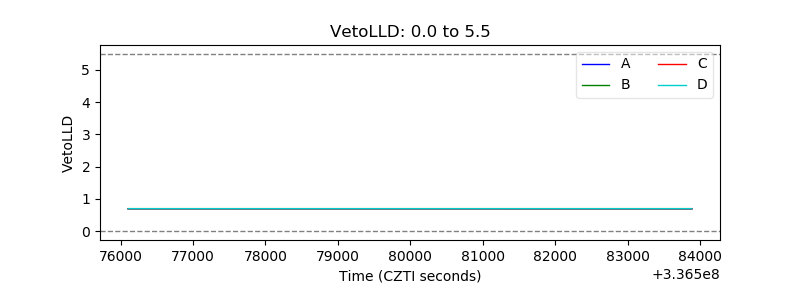 |
| Alpha Counter | 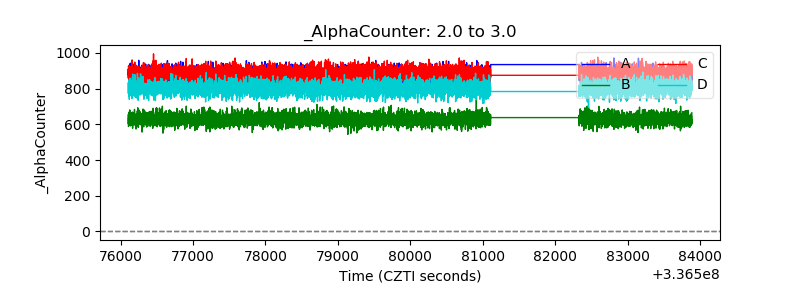 |
| _CPM_Rate | 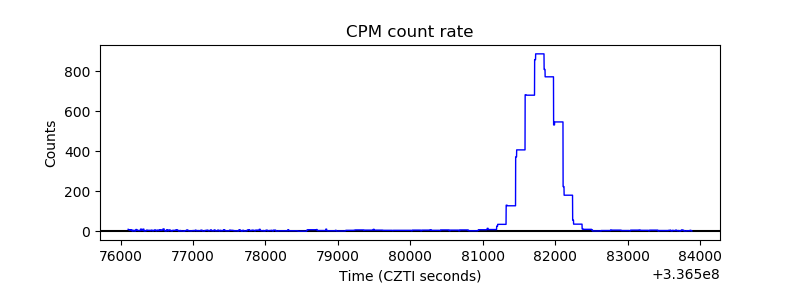 |
| CZT Counter | 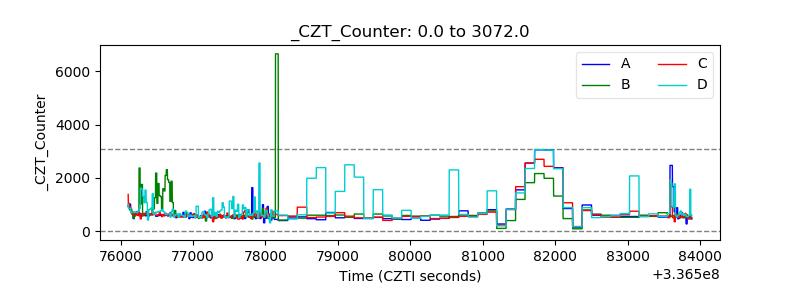 |
| +2.5 Volts monitor |  |
| +5 Volts monitor |  |
| _ROLL_ROT | 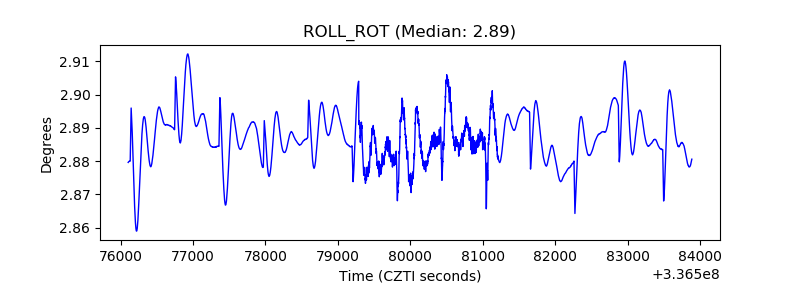 |
| _Roll_DEC | 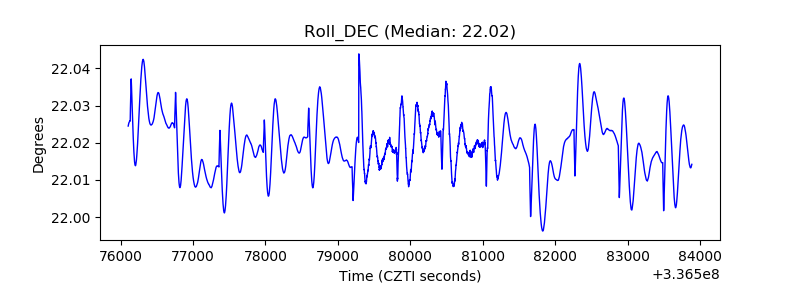 |
| _Roll_RA | 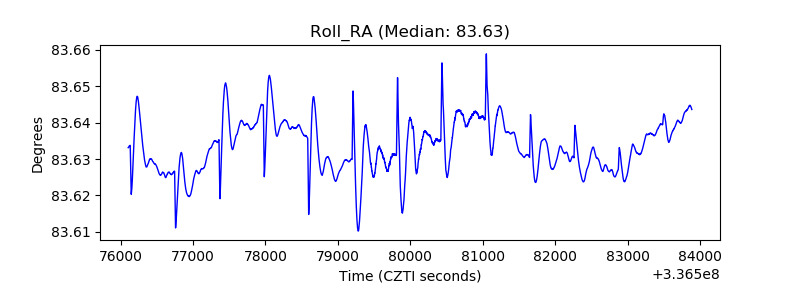 |
| Veto Counter | 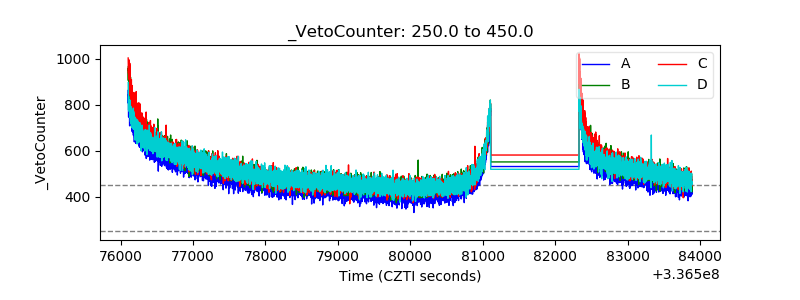 |