| Param | Original file | Final file |
|---|---|---|
| Filename | modeM0/AS1A09_145T01_9000003848_26636cztM0_level2.evt | modeM0/AS1A09_145T01_9000003848_26636cztM0_level2_quad_clean.evt |
| Size (bytes) | 385,056,000 | 55,955,520 |
| Size | 367.2 MB | 53.4 MB |
| Events in quadrant A | 2,619,137 | 357,022 |
| Events in quadrant B | 2,828,848 | 356,193 |
| Events in quadrant C | 2,486,899 | 346,407 |
| Events in quadrant D | 3,425,314 | 322,929 |
| Mode M0 | |||
|---|---|---|---|
| Quadrant | BADHDUFLAG | Total packets | Discarded packets |
| A | 0 | 10430 | 0 |
| B | 0 | 11311 | 0 |
| C | 0 | 9958 | 0 |
| D | 0 | 12980 | 0 |
| Mode M9 | |||
|---|---|---|---|
| Quadrant | BADHDUFLAG | Total packets | Discarded packets |
| A | 0 | 11 | 0 |
| B | 0 | 11 | 0 |
| C | 0 | 11 | 0 |
| D | 0 | 11 | 0 |
| Quadrant | Total seconds | Saturated seconds | Saturation percentage |
|---|---|---|---|
| A | 4419 | 146 | 3.303915% |
| B | 4405 | 168 | 3.813848% |
| C | 4396 | 138 | 3.139217% |
| D | 4395 | 383 | 8.714448% |
Noise dominated data is calculated using 1-second bins in cleaned event files. If a bin has >2000 counts, and if more than 50% of those come from <1% of pixels, then it is considered to be noise-dominated and hence unusable.
| Quadrant | # 1 sec bins | Bins with >0 counts | Bins with >2000 counts | High rate bins dominated by noise | Noise dominated (total time) | Noise dominated (detector-on time) | Marked lightcurve |
|---|---|---|---|---|---|---|---|
| A | 7696 | 4533 | 46 | 46 | 0.60% | 1.01% | 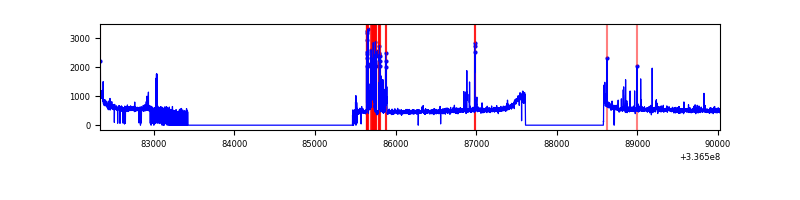 |
| B | 7695 | 4522 | 28 | 28 | 0.36% | 0.62% | 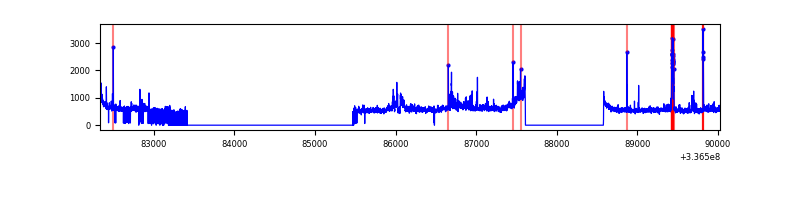 |
| C | 7695 | 4508 | 3 | 3 | 0.04% | 0.07% | 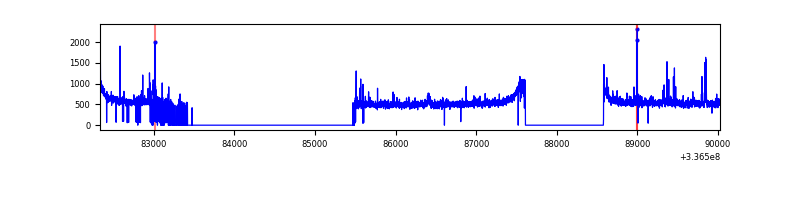 |
| D | 7695 | 4500 | 249 | 249 | 3.24% | 5.53% | 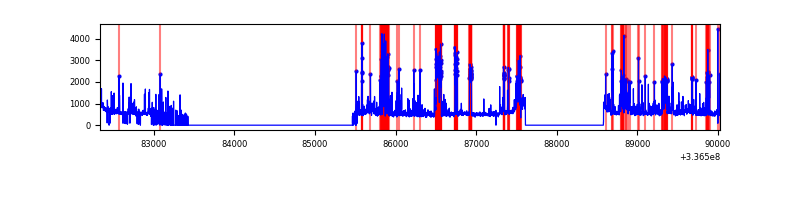 |
Top three noisy pixels from each quadrant. If the there are fewer than three noisy pixels in the level2.evt file, extra rows are filled as -1
| Pixel properties | Quadrant properties | ||||||
|---|---|---|---|---|---|---|---|
| Quadrant | DetID | PixID | Counts | Sigma | Mean | Median | Sigma |
| A | 0 | 13 | 264265 | 2133.52 | 611 | 600 | 123.6 |
| A | 13 | 254 | 7478 | 55.66 | 611 | 600 | 123.6 |
| A | 3 | 137 | 5445 | 39.2 | 611 | 600 | 123.6 |
| B | 0 | 189 | 250945 | 2179.49 | 595 | 582 | 114.9 |
| B | 10 | 245 | 97667 | 845.16 | 595 | 582 | 114.9 |
| B | 3 | 112 | 68547 | 591.66 | 595 | 582 | 114.9 |
| C | 14 | 238 | 91638 | 667.3 | 579 | 586 | 136.4 |
| C | 2 | 16 | 70040 | 509.01 | 579 | 586 | 136.4 |
| C | 3 | 233 | 62620 | 454.63 | 579 | 586 | 136.4 |
| D | 1 | 52 | 785100 | 5557.96 | 575 | 559 | 141.2 |
| D | 7 | 80 | 353971 | 2503.69 | 575 | 559 | 141.2 |
| D | 12 | 16 | 43889 | 306.96 | 575 | 559 | 141.2 |
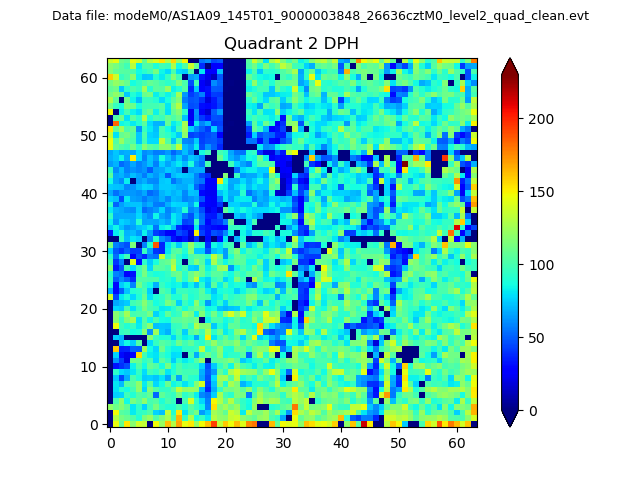
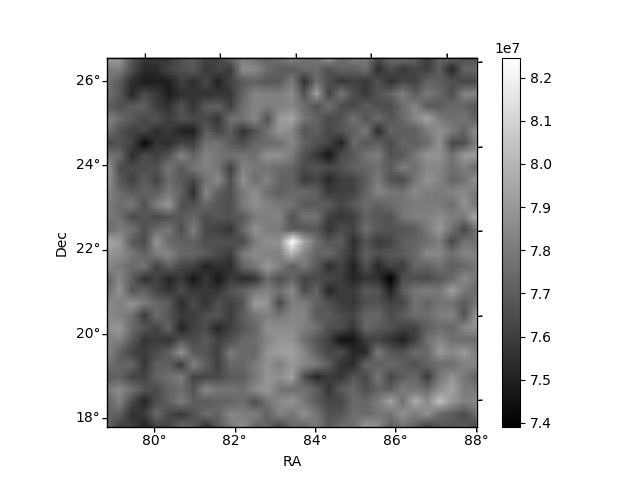
Histogram calculated using DETX and DETY for each event in the final _common_clean file
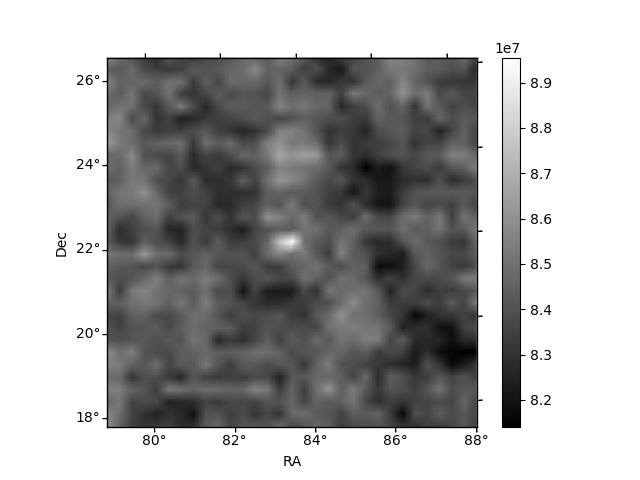
| Quadrant A | 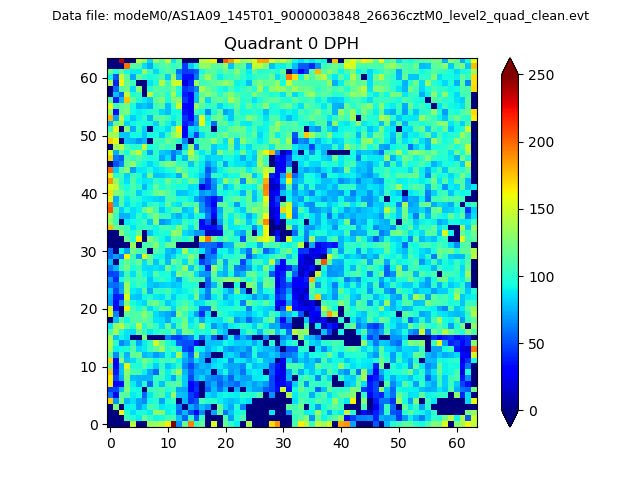 |
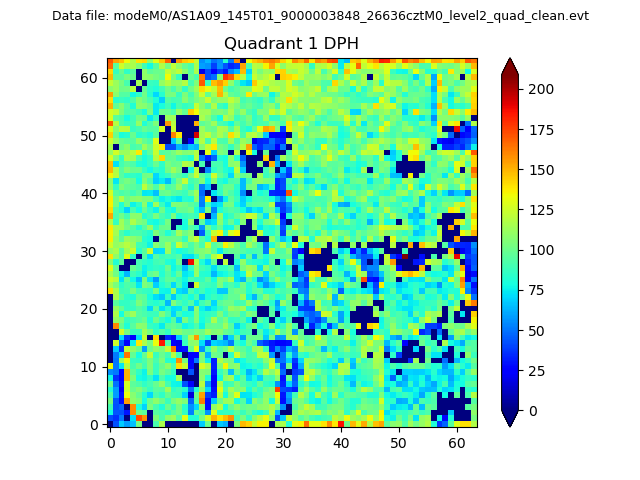 |
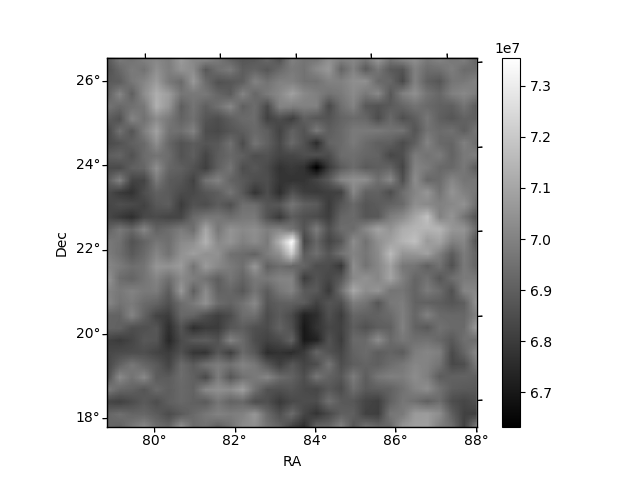
Quadrant B |
|---|---|---|---|
| Quadrant D | 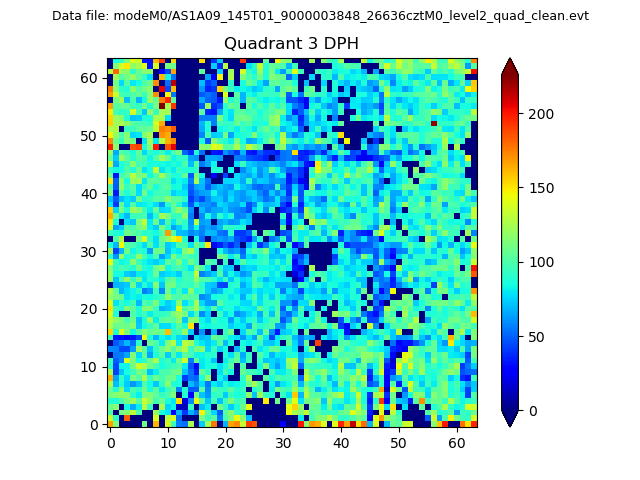 |
 |
Quadrant C |
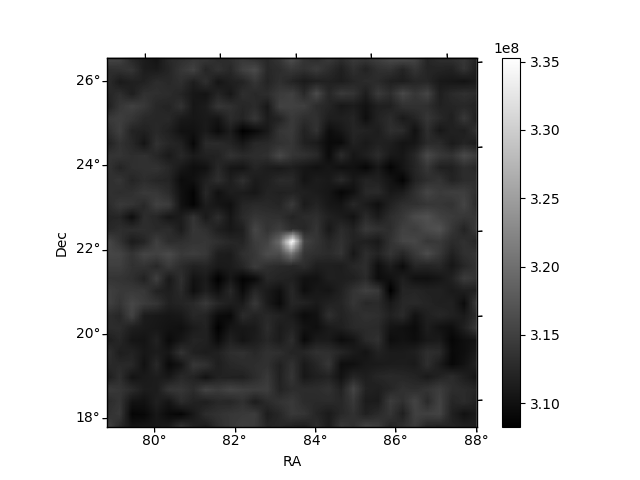
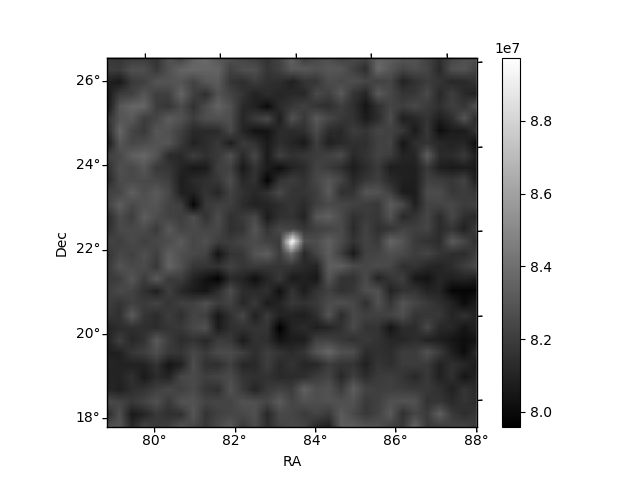
| Plot type | Count rate plots | Images |
|---|---|---|
| Comparison with Poisson distribution Blue bars denote a histogram of data divided into 1 sec bins. Red curve is a Poisson curve with rate = median count rate of data. |
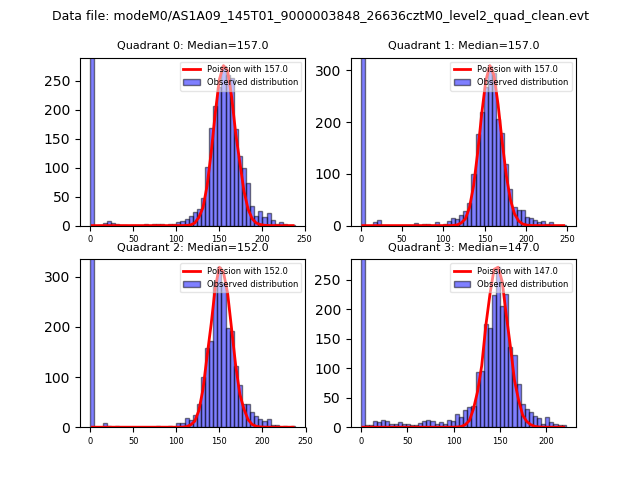 |
 |
| Quadrant-wise count rates Data is divided into 100 sec bins |
 |
|
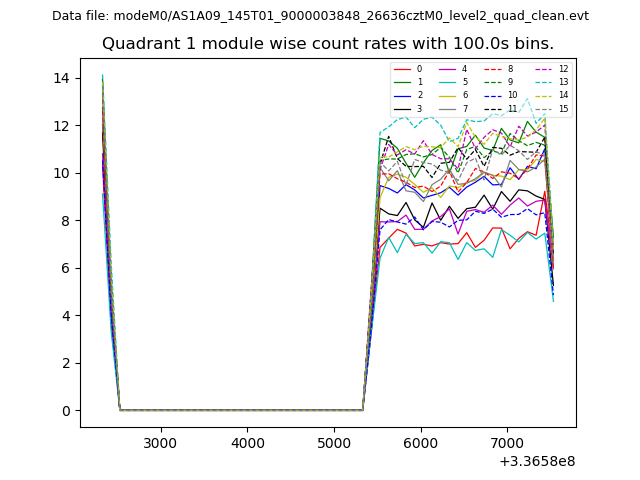
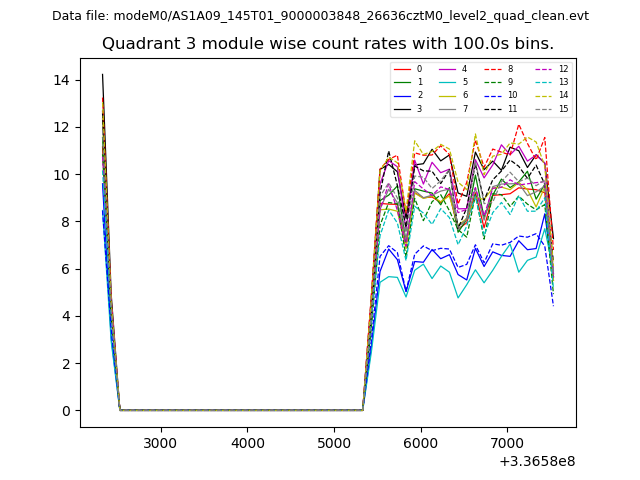
| Module-wise count rates for Quadrant A Data is divided into 100 sec bins |
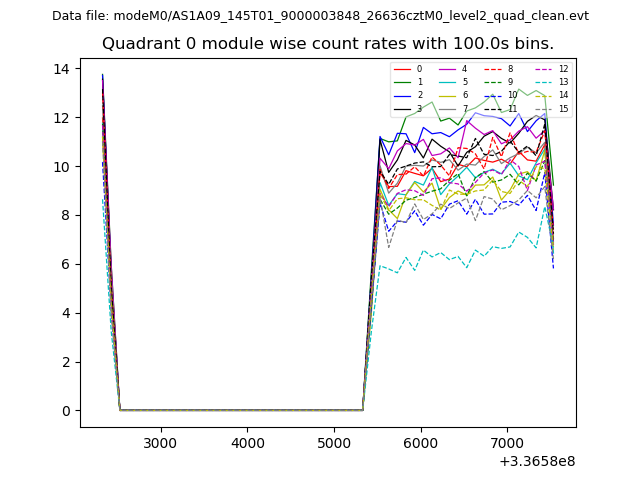 |
 |
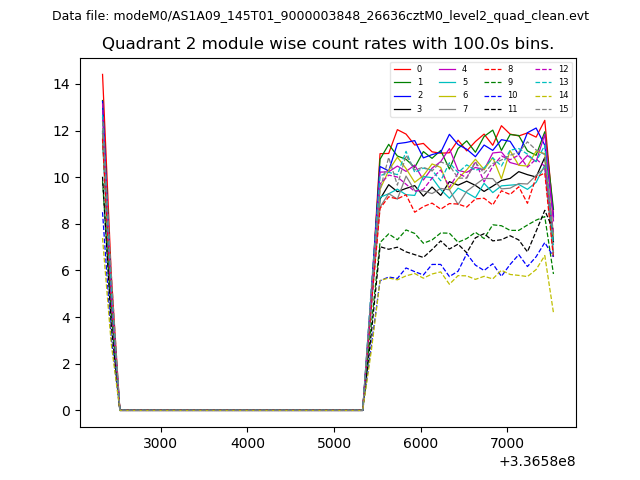
| Module-wise count rates for Quadrant B Data is divided into 100 sec bins |
 |
 |
| Module-wise count rates for Quadrant C Data is divided into 100 sec bins |
 |
 |
| Module-wise count rates for Quadrant D Data is divided into 100 sec bins |
 |
 |
| Parameter | Plot |
|---|---|
| CZT HV Monitor | 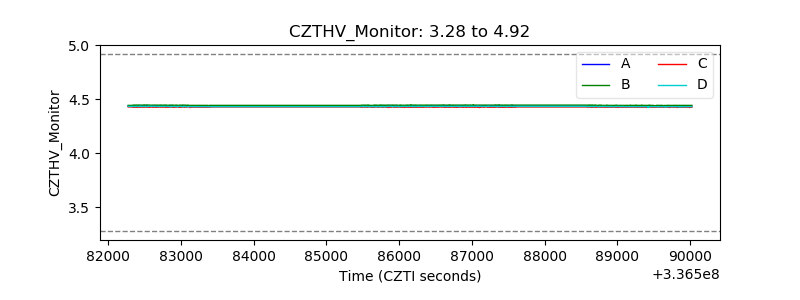 |
| D_VDD | 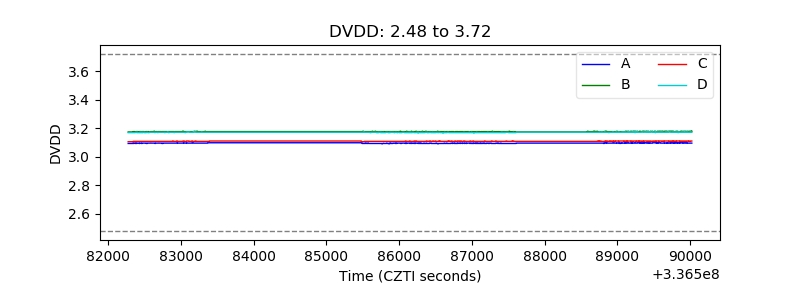 |
| Temperature 1 | 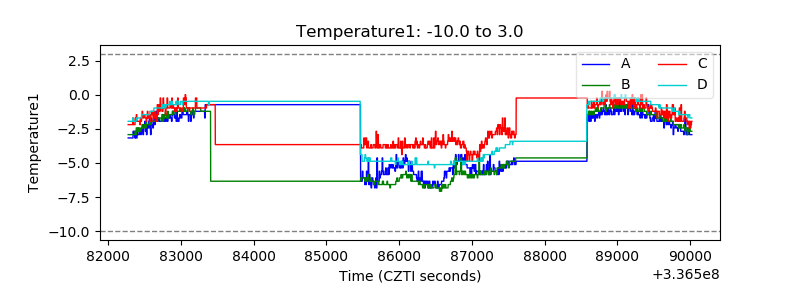 |
| Veto HV Monitor | 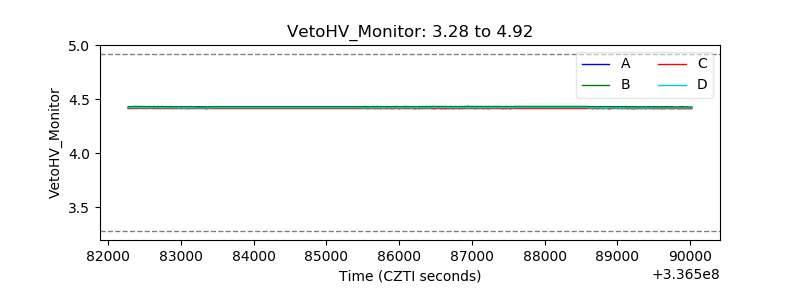 |
| Veto LLD | 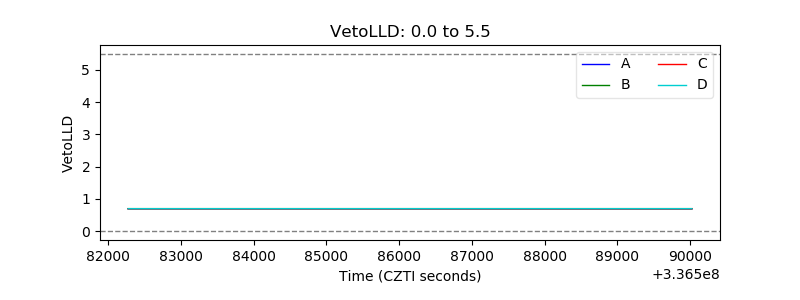 |
| Alpha Counter | 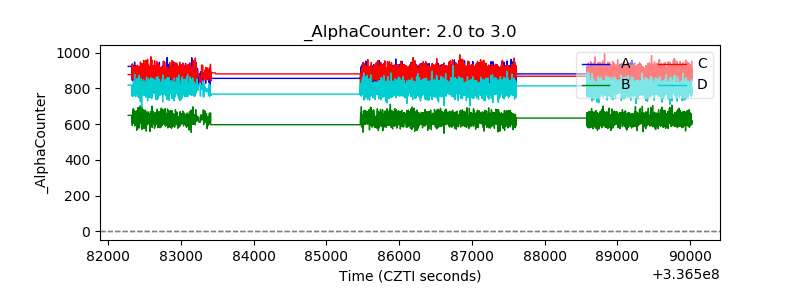 |
| _CPM_Rate |  |
| CZT Counter | 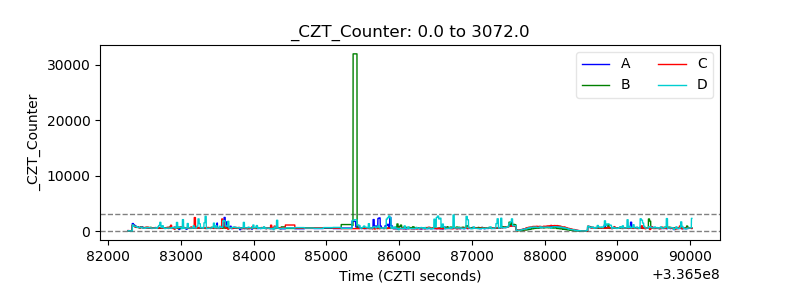 |
| +2.5 Volts monitor |  |
| +5 Volts monitor |  |
| _ROLL_ROT | 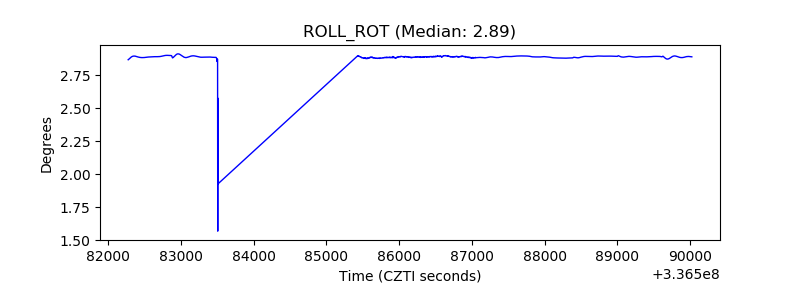 |
| _Roll_DEC | 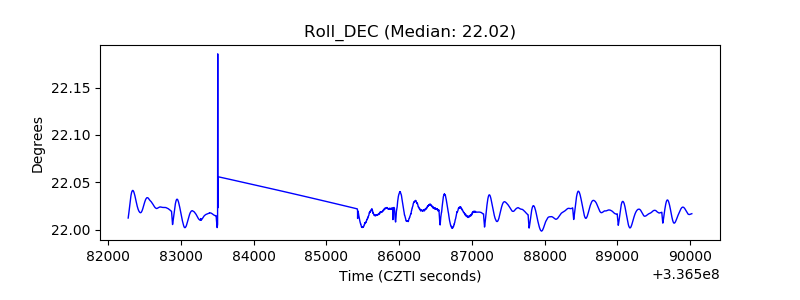 |
| _Roll_RA | 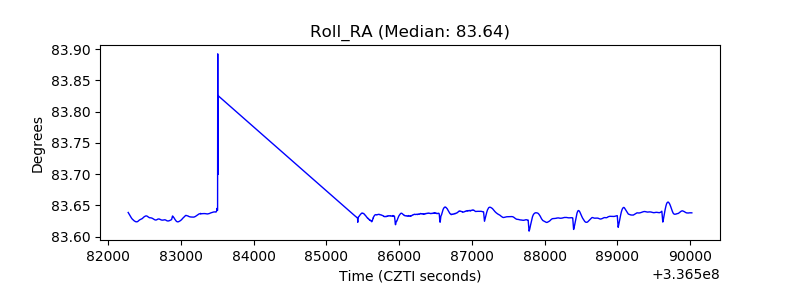 |
| Veto Counter |  |