| Param | Original file | Final file |
|---|---|---|
| Filename | modeM0/AS1A09_145T01_9000003848_26637cztM0_level2.evt | modeM0/AS1A09_145T01_9000003848_26637cztM0_level2_quad_clean.evt |
| Size (bytes) | 613,042,560 | 86,189,760 |
| Size | 584.6 MB | 82.2 MB |
| Events in quadrant A | 4,102,705 | 543,100 |
| Events in quadrant B | 4,421,353 | 548,262 |
| Events in quadrant C | 3,930,941 | 528,660 |
| Events in quadrant D | 5,643,563 | 508,646 |
| Mode M0 | |||
|---|---|---|---|
| Quadrant | BADHDUFLAG | Total packets | Discarded packets |
| A | 0 | 16338 | 0 |
| B | 0 | 17726 | 0 |
| C | 0 | 15709 | 0 |
| D | 0 | 21417 | 0 |
| Mode M9 | |||
|---|---|---|---|
| Quadrant | BADHDUFLAG | Total packets | Discarded packets |
| A | 0 | 7 | 0 |
| B | 0 | 7 | 0 |
| C | 0 | 7 | 0 |
| D | 0 | 7 | 0 |
| Quadrant | Total seconds | Saturated seconds | Saturation percentage |
|---|---|---|---|
| A | 6907 | 228 | 3.300999% |
| B | 6907 | 127 | 1.838714% |
| C | 6906 | 183 | 2.649870% |
| D | 6907 | 482 | 6.978428% |
Noise dominated data is calculated using 1-second bins in cleaned event files. If a bin has >2000 counts, and if more than 50% of those come from <1% of pixels, then it is considered to be noise-dominated and hence unusable.
| Quadrant | # 1 sec bins | Bins with >0 counts | Bins with >2000 counts | High rate bins dominated by noise | Noise dominated (total time) | Noise dominated (detector-on time) | Marked lightcurve |
|---|---|---|---|---|---|---|---|
| A | 7532 | 6908 | 112 | 112 | 1.49% | 1.62% | 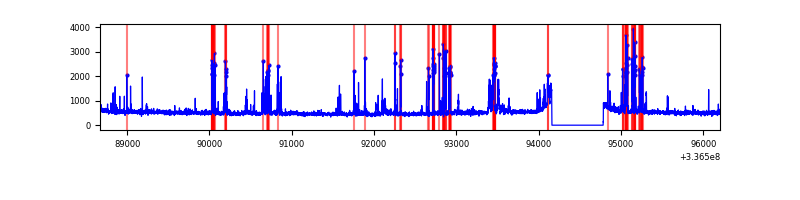 |
| B | 7532 | 6908 | 24 | 24 | 0.32% | 0.35% | 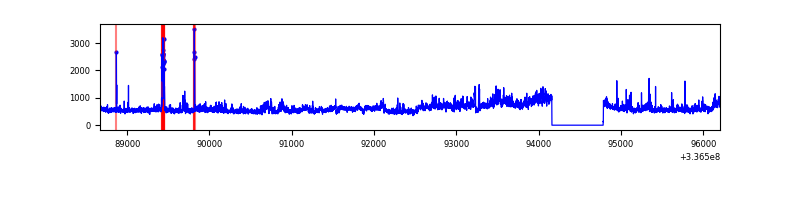 |
| C | 7531 | 6907 | 28 | 28 | 0.37% | 0.41% | 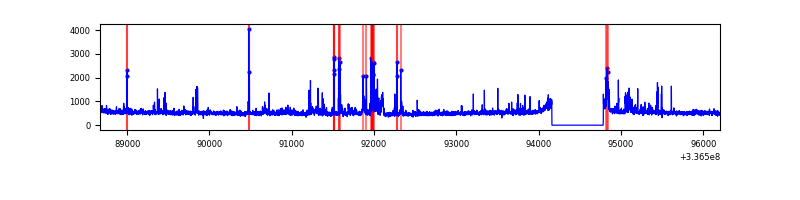 |
| D | 7532 | 6908 | 359 | 359 | 4.77% | 5.20% | 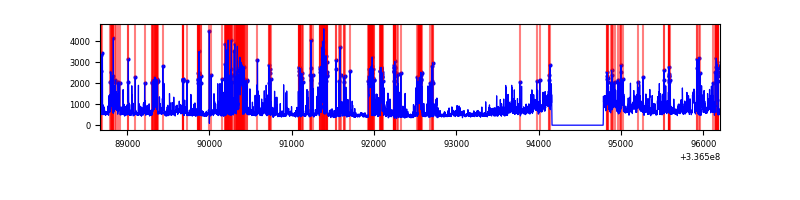 |
Top three noisy pixels from each quadrant. If the there are fewer than three noisy pixels in the level2.evt file, extra rows are filled as -1
| Pixel properties | Quadrant properties | ||||||
|---|---|---|---|---|---|---|---|
| Quadrant | DetID | PixID | Counts | Sigma | Mean | Median | Sigma |
| A | 0 | 13 | 672688 | 3747.2 | 888 | 873 | 179.3 |
| A | 13 | 254 | 11904 | 61.53 | 888 | 873 | 179.3 |
| A | 3 | 137 | 7895 | 39.17 | 888 | 873 | 179.3 |
| B | 0 | 189 | 644546 | 3814.45 | 882 | 861 | 168.7 |
| B | 3 | 112 | 206457 | 1218.35 | 882 | 861 | 168.7 |
| B | 5 | 172 | 67340 | 393.95 | 882 | 861 | 168.7 |
| C | 2 | 16 | 362656 | 1790.12 | 852 | 857 | 202.1 |
| C | 14 | 238 | 137090 | 674.05 | 852 | 857 | 202.1 |
| C | 3 | 233 | 78343 | 383.38 | 852 | 857 | 202.1 |
| D | 1 | 52 | 1456219 | 7098.26 | 847 | 828 | 205.0 |
| D | 7 | 80 | 449933 | 2190.38 | 847 | 828 | 205.0 |
| D | 2 | 250 | 366344 | 1782.7 | 847 | 828 | 205.0 |
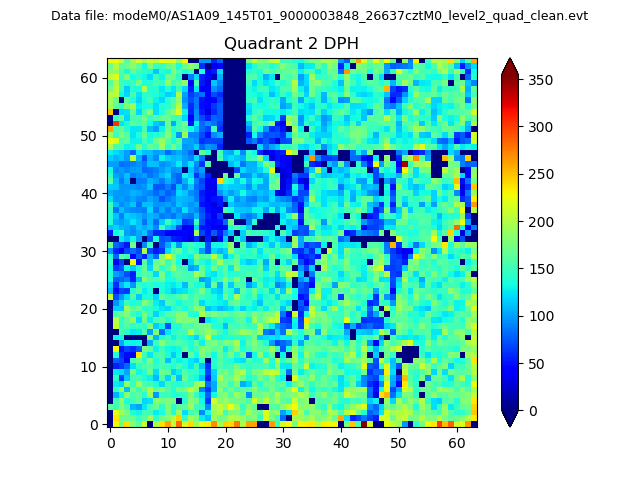
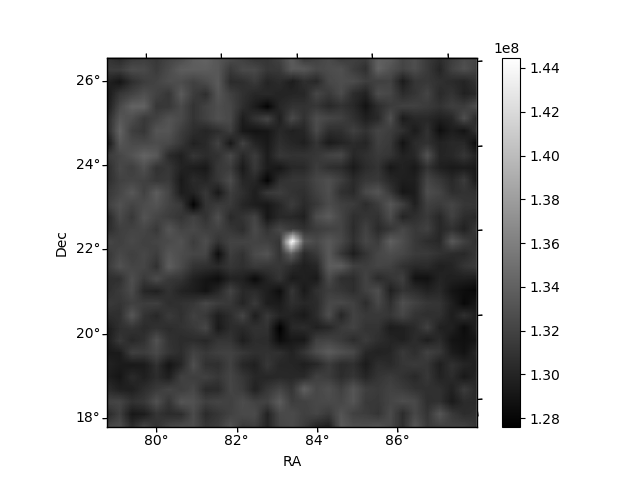
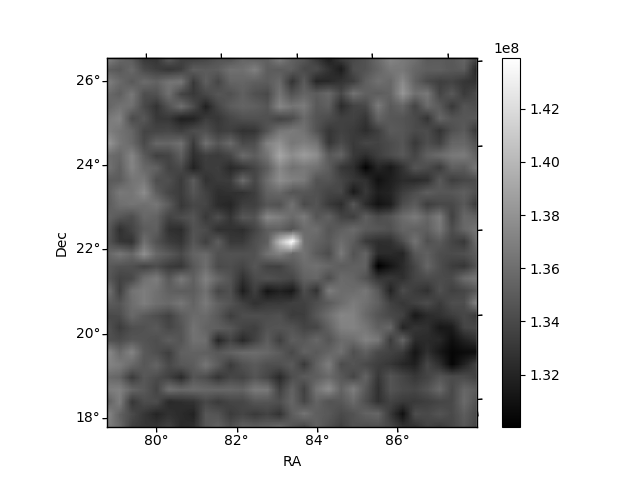
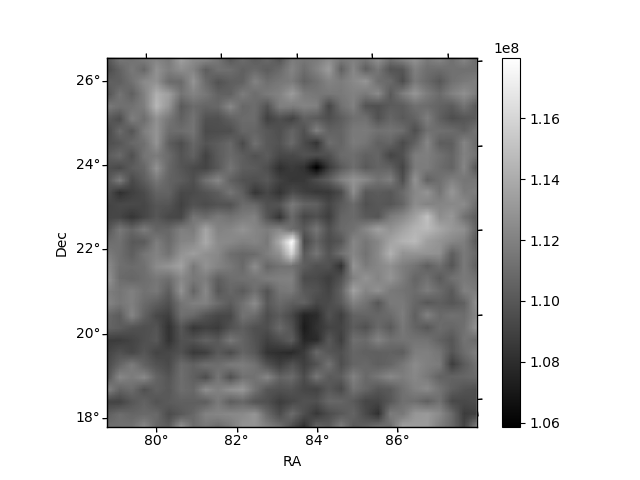
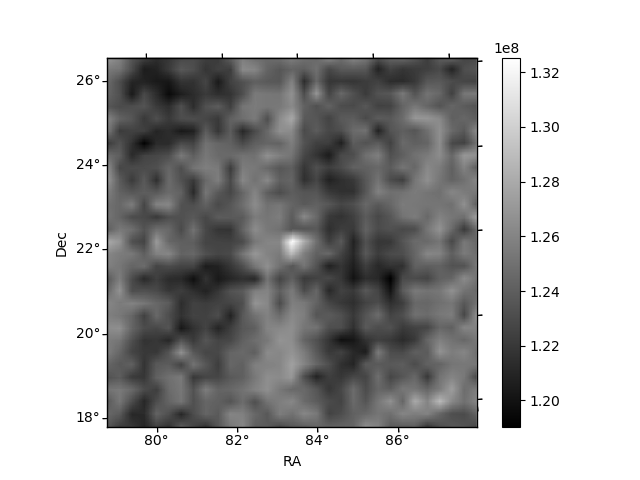
Histogram calculated using DETX and DETY for each event in the final _common_clean file
| Quadrant A | 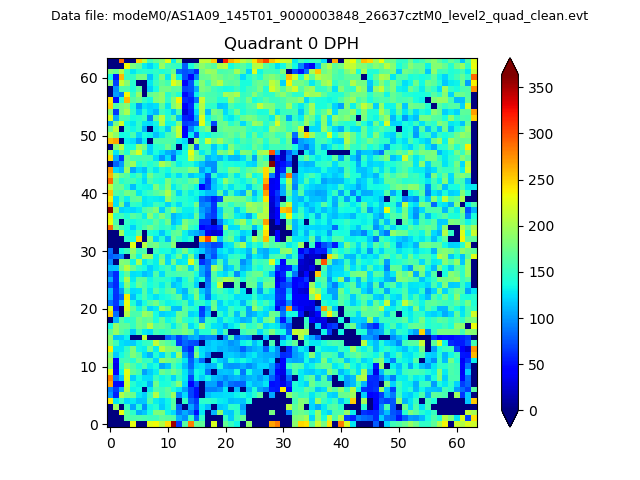 |
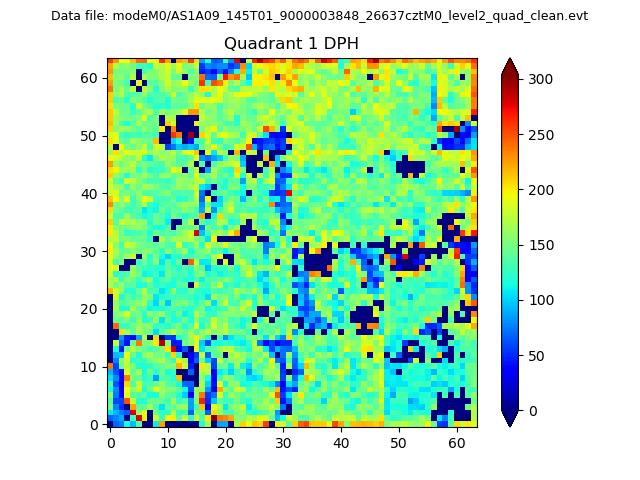 |
Quadrant B |
|---|---|---|---|
| Quadrant D | 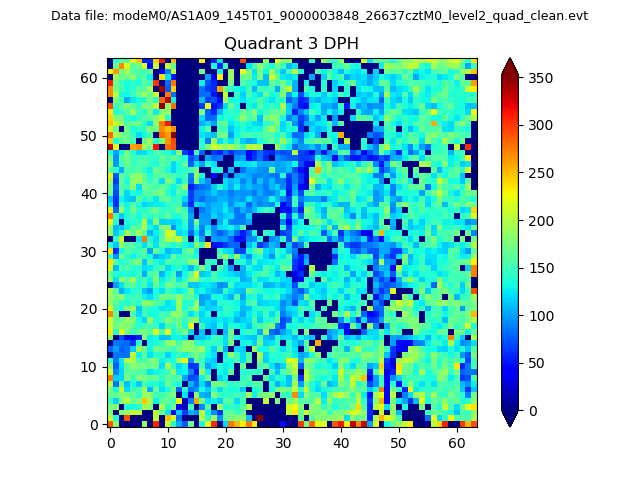 |
 |
Quadrant C |
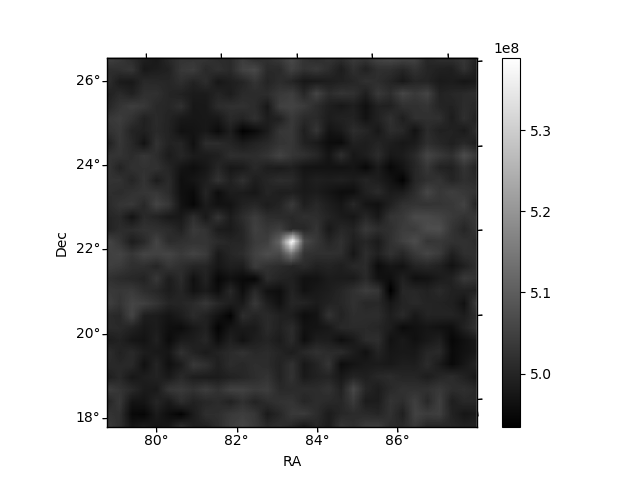
| Plot type | Count rate plots | Images |
|---|---|---|
| Comparison with Poisson distribution Blue bars denote a histogram of data divided into 1 sec bins. Red curve is a Poisson curve with rate = median count rate of data. |
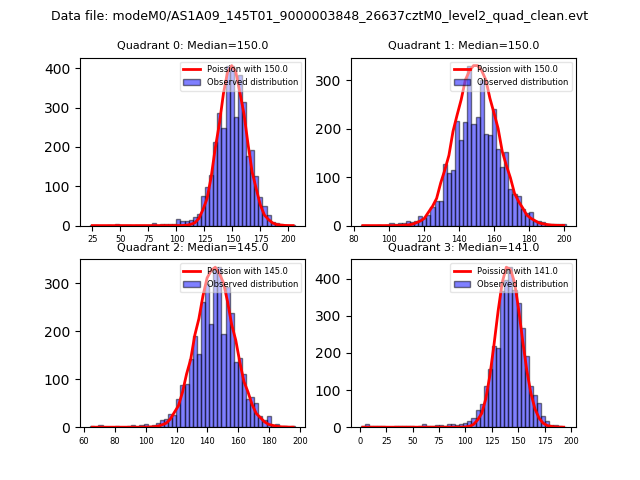 |
 |
| Quadrant-wise count rates Data is divided into 100 sec bins |
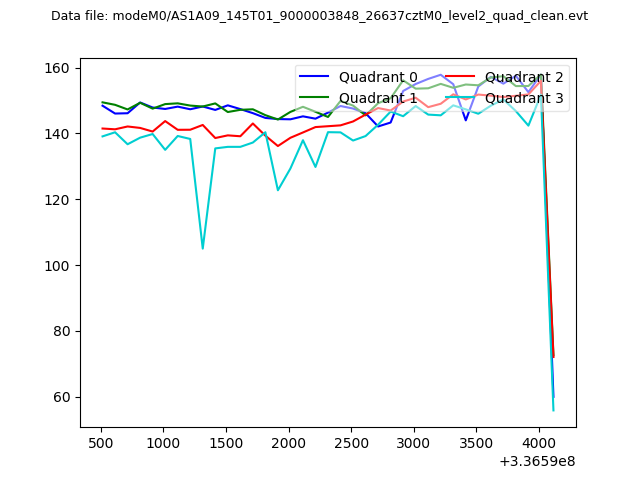 |
|
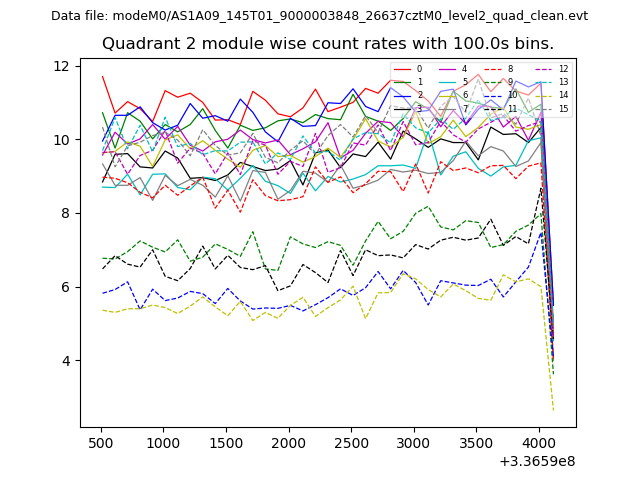
| Module-wise count rates for Quadrant A Data is divided into 100 sec bins |
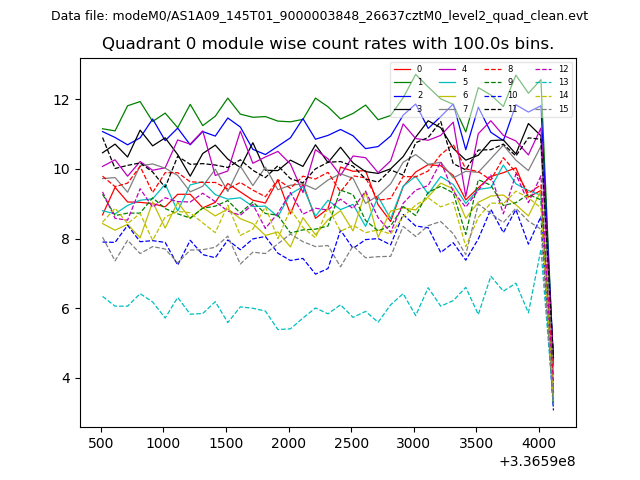 |
 |
| Module-wise count rates for Quadrant B Data is divided into 100 sec bins |
 |
 |
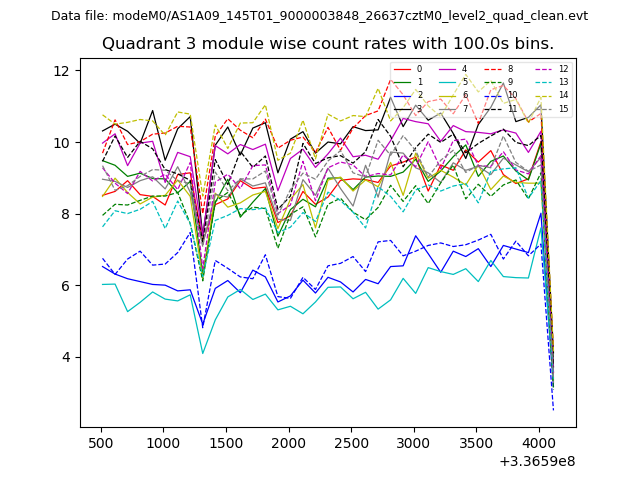
| Module-wise count rates for Quadrant C Data is divided into 100 sec bins |
 |
 |
| Module-wise count rates for Quadrant D Data is divided into 100 sec bins |
 |
 |
| Parameter | Plot |
|---|---|
| CZT HV Monitor |  |
| D_VDD | 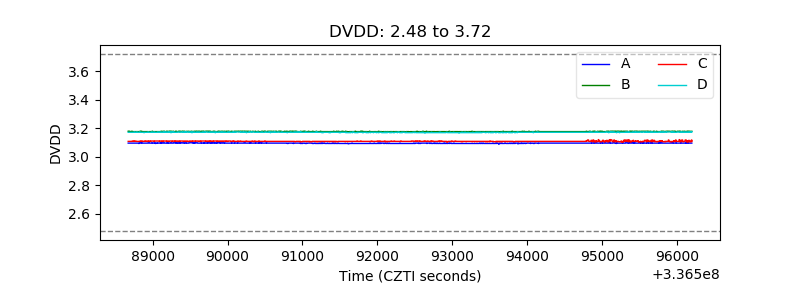 |
| Temperature 1 | 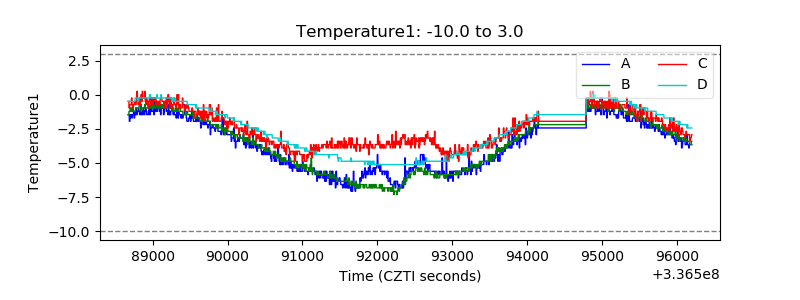 |
| Veto HV Monitor | 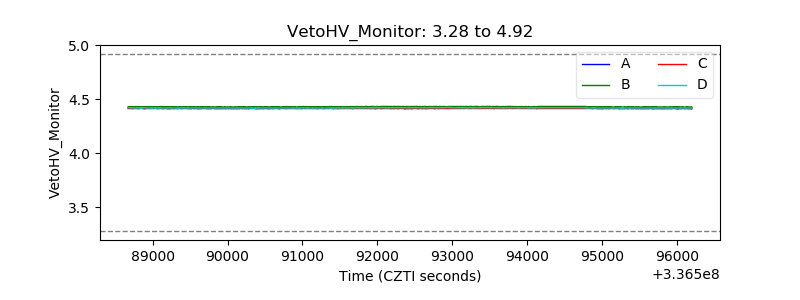 |
| Veto LLD | 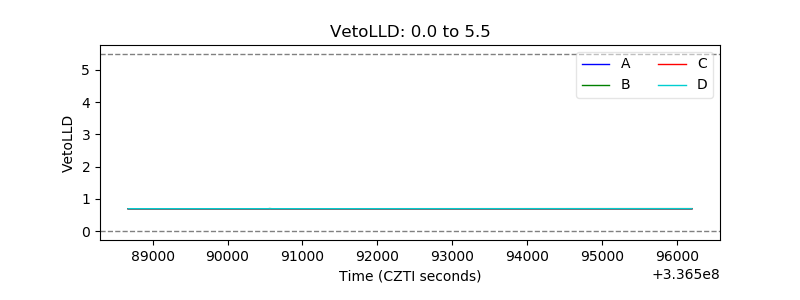 |
| Alpha Counter | 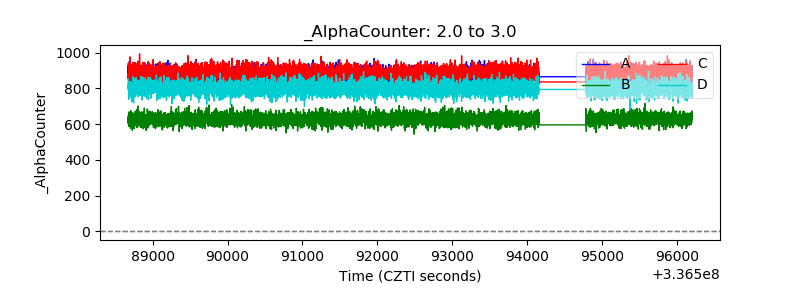 |
| _CPM_Rate | 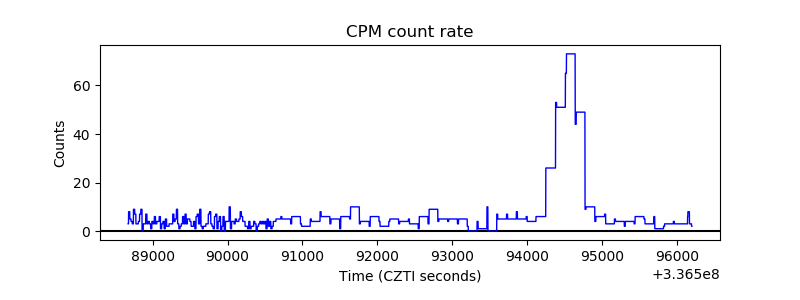 |
| CZT Counter | 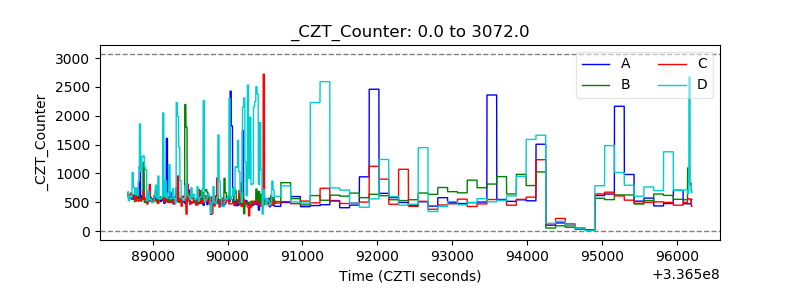 |
| +2.5 Volts monitor | 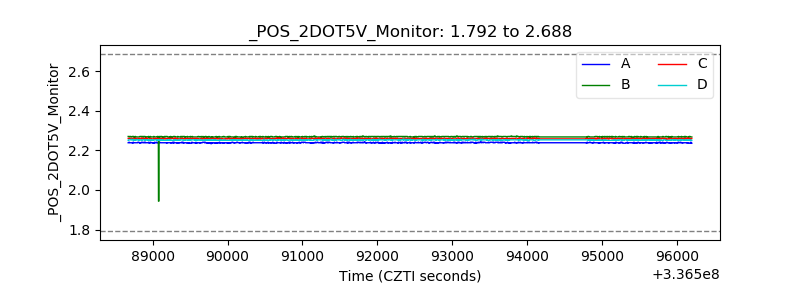 |
| +5 Volts monitor |  |
| _ROLL_ROT | 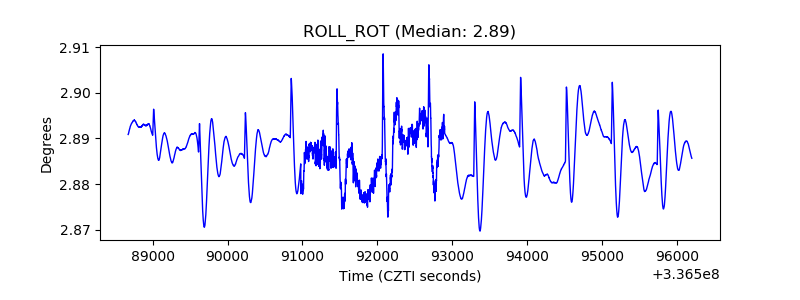 |
| _Roll_DEC | 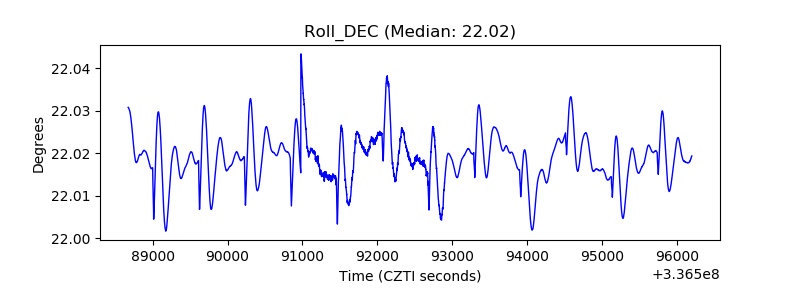 |
| _Roll_RA | 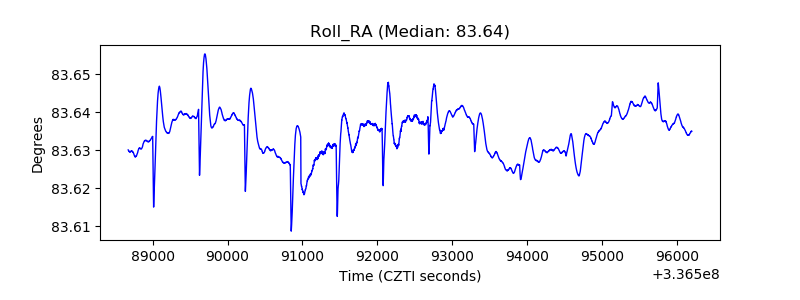 |
| Veto Counter | 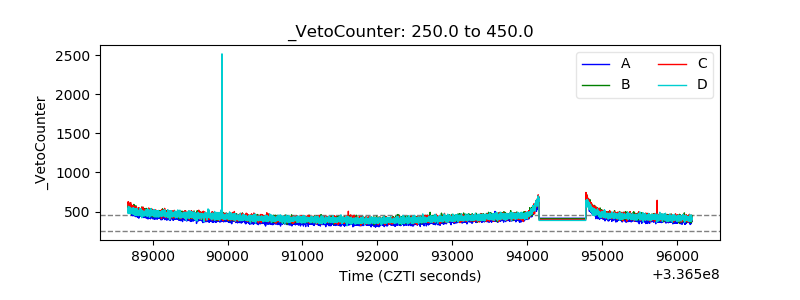 |