| Param | Original file | Final file |
|---|---|---|
| Filename | modeM0/AS1A09_145T01_9000003848_26638cztM0_level2.evt | modeM0/AS1A09_145T01_9000003848_26638cztM0_level2_quad_clean.evt |
| Size (bytes) | 1,515,551,040 | 243,584,640 |
| Size | 1.4 GB | 232.3 MB |
| Events in quadrant A | 9,839,929 | 1,591,163 |
| Events in quadrant B | 10,927,761 | 1,599,658 |
| Events in quadrant C | 9,481,062 | 1,547,508 |
| Events in quadrant D | 14,489,404 | 1,451,666 |
| Mode M0 | |||
|---|---|---|---|
| Quadrant | BADHDUFLAG | Total packets | Discarded packets |
| A | 0 | 39636 | 0 |
| B | 0 | 44329 | 0 |
| C | 0 | 38273 | 0 |
| D | 0 | 54758 | 0 |
| Mode M9 | |||
|---|---|---|---|
| Quadrant | BADHDUFLAG | Total packets | Discarded packets |
| A | 0 | 20 | 0 |
| B | 0 | 20 | 0 |
| C | 0 | 20 | 0 |
| D | 0 | 20 | 0 |
| Quadrant | Total seconds | Saturated seconds | Saturation percentage |
|---|---|---|---|
| A | 17223 | 509 | 2.955350% |
| B | 17224 | 328 | 1.904320% |
| C | 17225 | 417 | 2.420900% |
| D | 17225 | 1410 | 8.185776% |
Noise dominated data is calculated using 1-second bins in cleaned event files. If a bin has >2000 counts, and if more than 50% of those come from <1% of pixels, then it is considered to be noise-dominated and hence unusable.
| Quadrant | # 1 sec bins | Bins with >0 counts | Bins with >2000 counts | High rate bins dominated by noise | Noise dominated (total time) | Noise dominated (detector-on time) | Marked lightcurve |
|---|---|---|---|---|---|---|---|
| A | 19184 | 17227 | 249 | 249 | 1.30% | 1.45% | 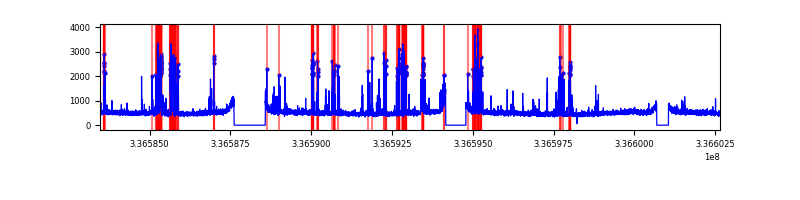 |
| B | 19185 | 17228 | 33 | 33 | 0.17% | 0.19% | 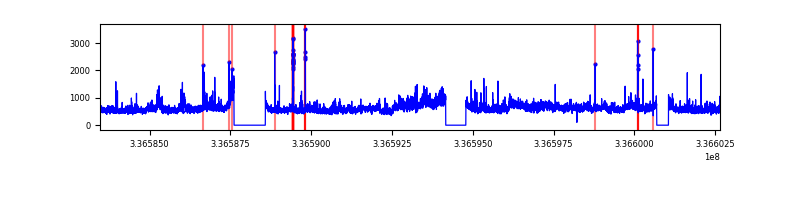 |
| C | 19185 | 17228 | 39 | 39 | 0.20% | 0.23% | 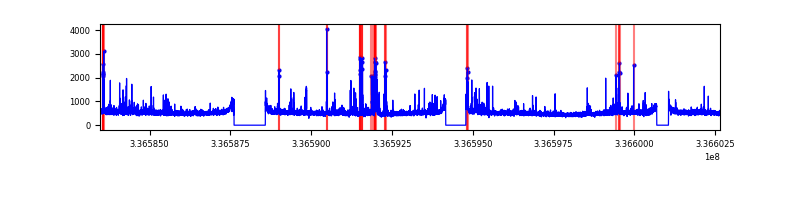 |
| D | 19185 | 17228 | 969 | 969 | 5.05% | 5.62% | 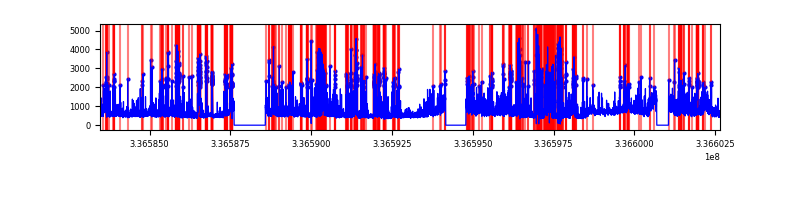 |
Top three noisy pixels from each quadrant. If the there are fewer than three noisy pixels in the level2.evt file, extra rows are filled as -1
| Pixel properties | Quadrant properties | ||||||
|---|---|---|---|---|---|---|---|
| Quadrant | DetID | PixID | Counts | Sigma | Mean | Median | Sigma |
| A | 0 | 13 | 1322987 | 3001.52 | 2206 | 2172 | 440.0 |
| A | 13 | 254 | 29776 | 62.73 | 2206 | 2172 | 440.0 |
| A | 3 | 137 | 19591 | 39.58 | 2206 | 2172 | 440.0 |
| B | 0 | 189 | 1695532 | 4104.86 | 2190 | 2139 | 412.5 |
| B | 3 | 112 | 430732 | 1038.93 | 2190 | 2139 | 412.5 |
| B | 10 | 245 | 106834 | 253.79 | 2190 | 2139 | 412.5 |
| C | 2 | 16 | 499153 | 993.63 | 2122 | 2146 | 500.2 |
| C | 14 | 238 | 340037 | 675.52 | 2122 | 2146 | 500.2 |
| C | 3 | 233 | 275451 | 546.4 | 2122 | 2146 | 500.2 |
| D | 1 | 52 | 3044878 | 5681.27 | 2077 | 2035 | 535.6 |
| D | 7 | 80 | 2444633 | 4560.55 | 2077 | 2035 | 535.6 |
| D | 2 | 250 | 748579 | 1393.87 | 2077 | 2035 | 535.6 |
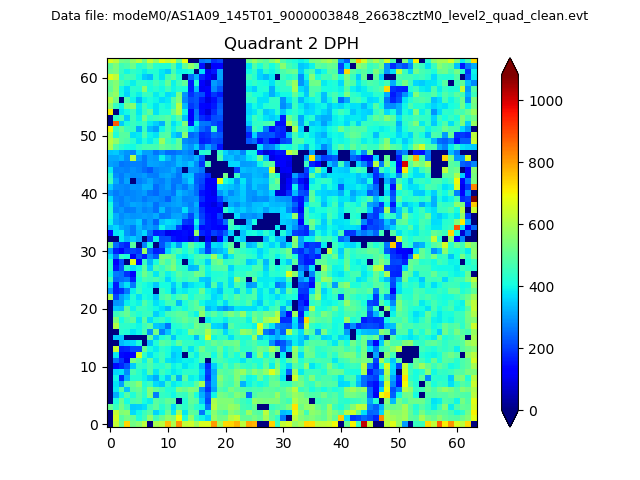
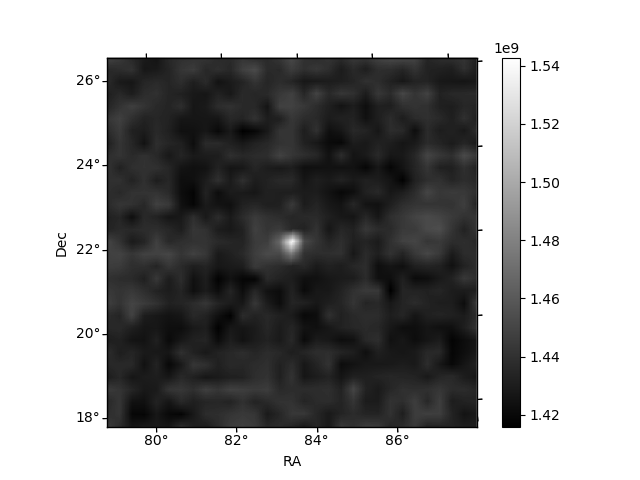
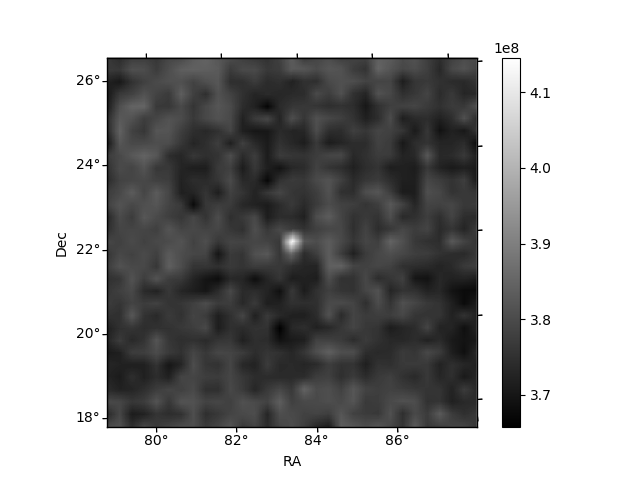
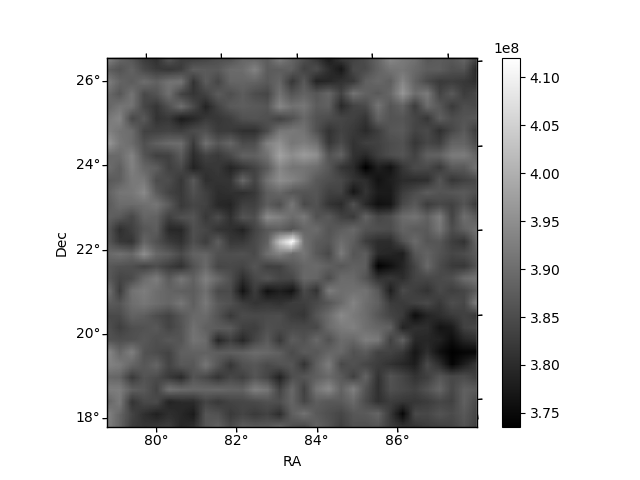
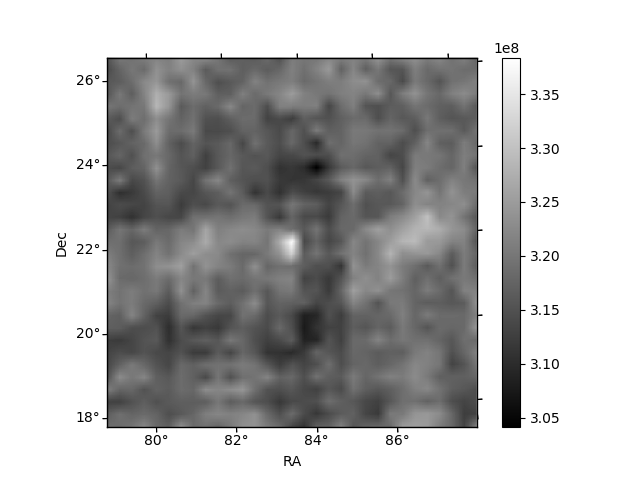
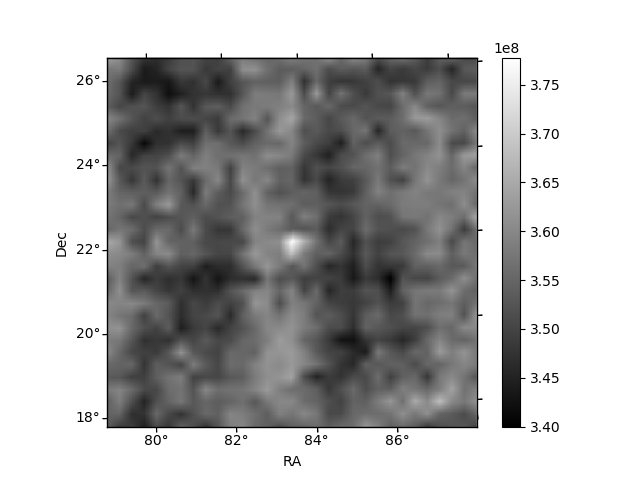
Histogram calculated using DETX and DETY for each event in the final _common_clean file
| Quadrant A | 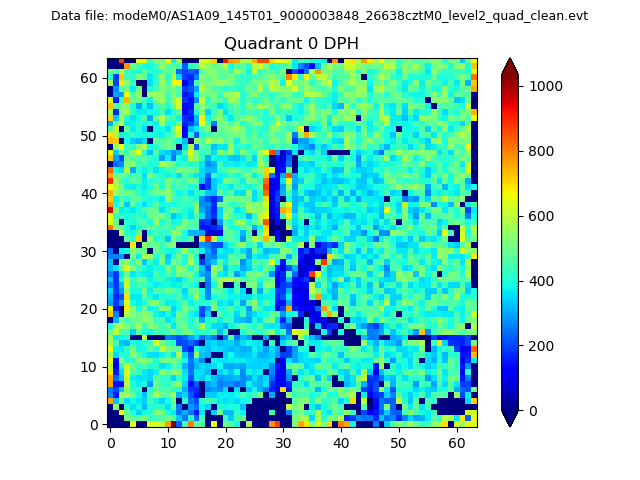 |
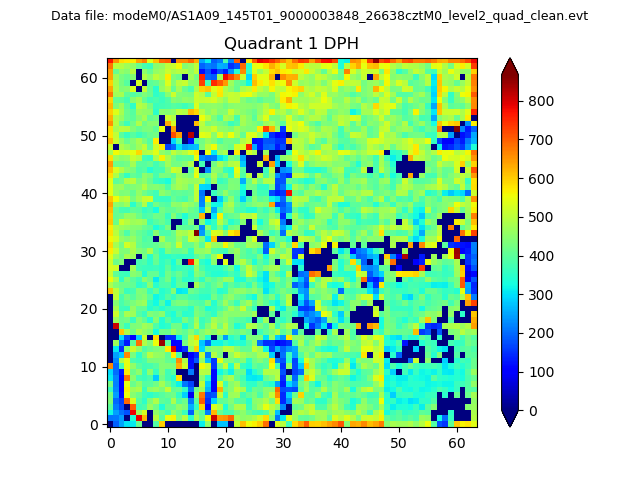 |
Quadrant B |
|---|---|---|---|
| Quadrant D | 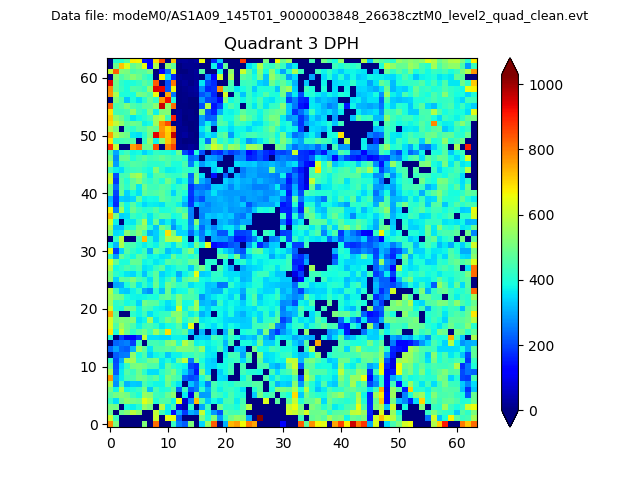 |
 |
Quadrant C |
| Plot type | Count rate plots | Images |
|---|---|---|
| Comparison with Poisson distribution Blue bars denote a histogram of data divided into 1 sec bins. Red curve is a Poisson curve with rate = median count rate of data. |
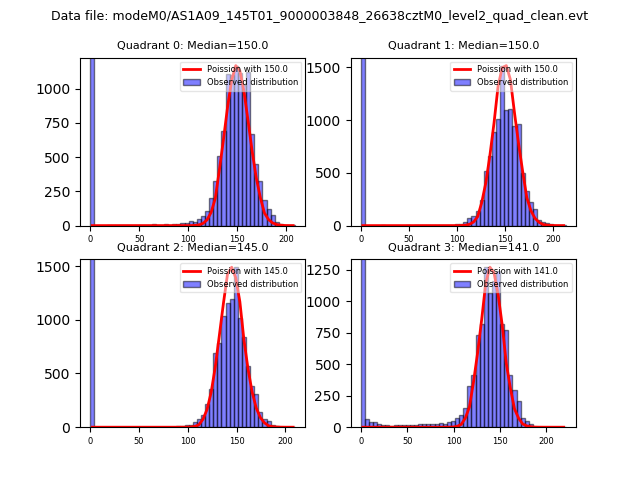 |
 |
| Quadrant-wise count rates Data is divided into 100 sec bins |
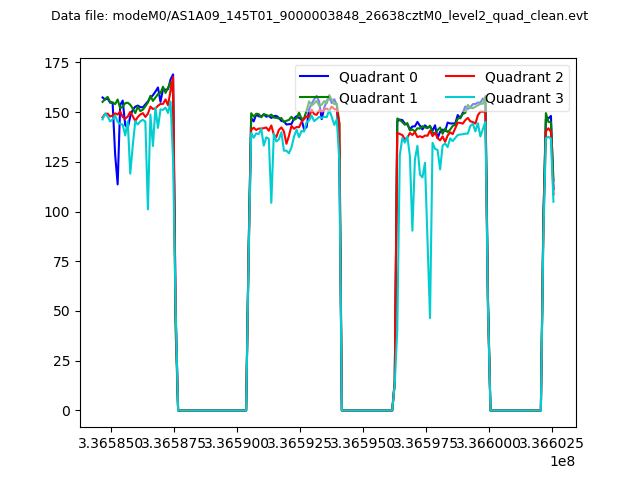 |
|
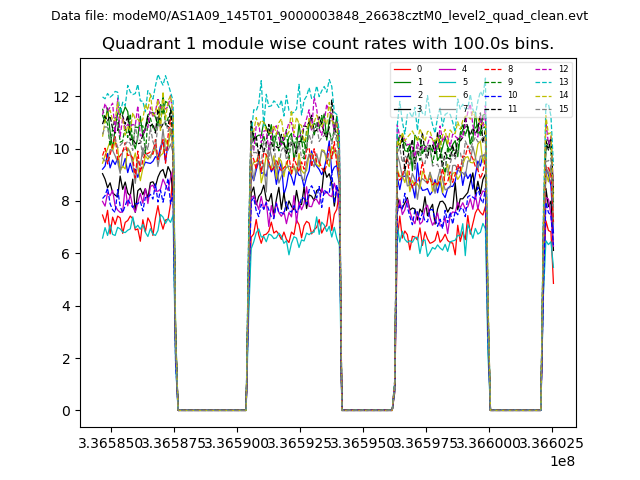
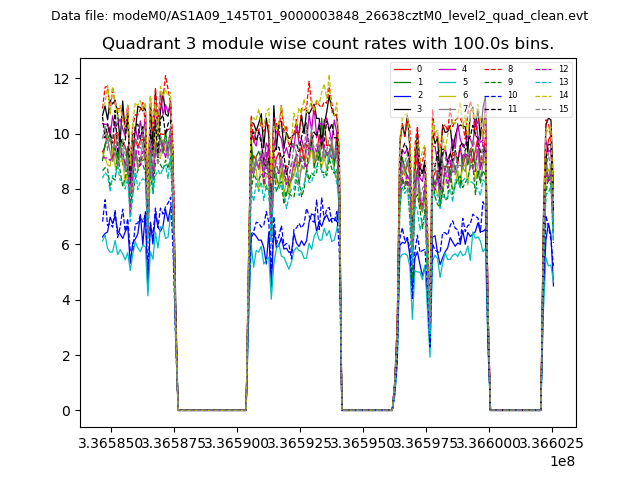
| Module-wise count rates for Quadrant A Data is divided into 100 sec bins |
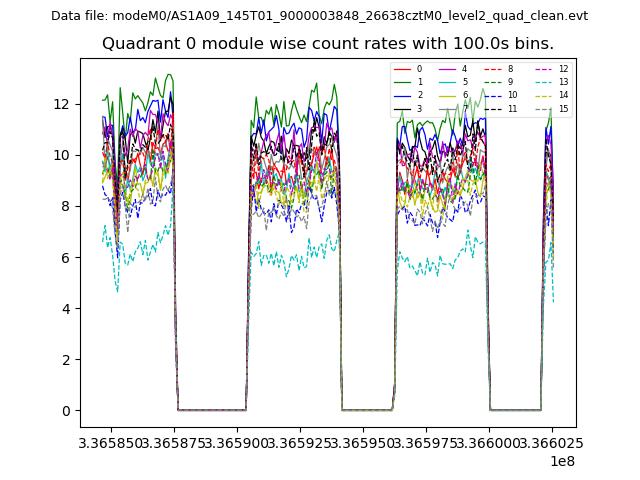 |
 |
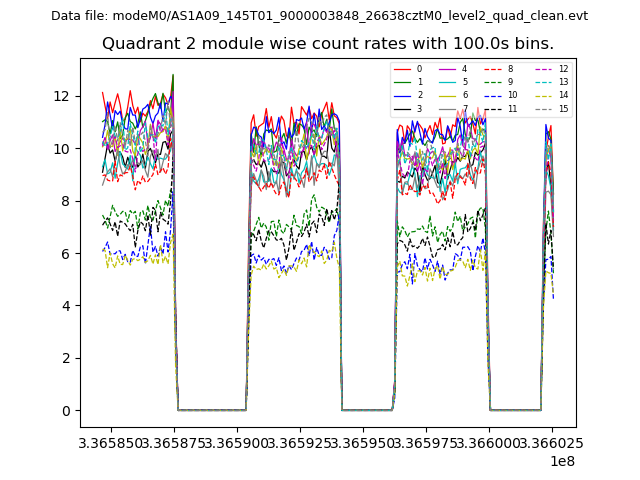
| Module-wise count rates for Quadrant B Data is divided into 100 sec bins |
 |
 |
| Module-wise count rates for Quadrant C Data is divided into 100 sec bins |
 |
 |
| Module-wise count rates for Quadrant D Data is divided into 100 sec bins |
 |
 |
| Parameter | Plot |
|---|---|
| CZT HV Monitor | 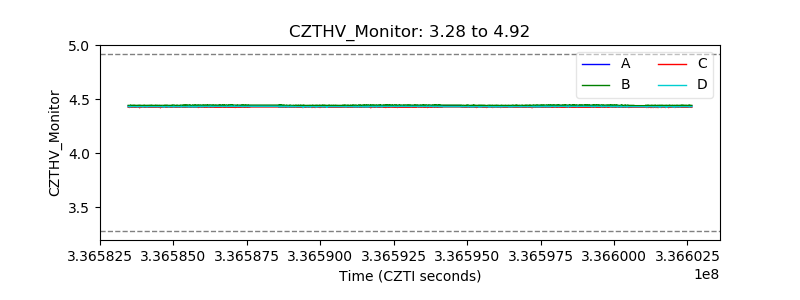 |
| D_VDD | 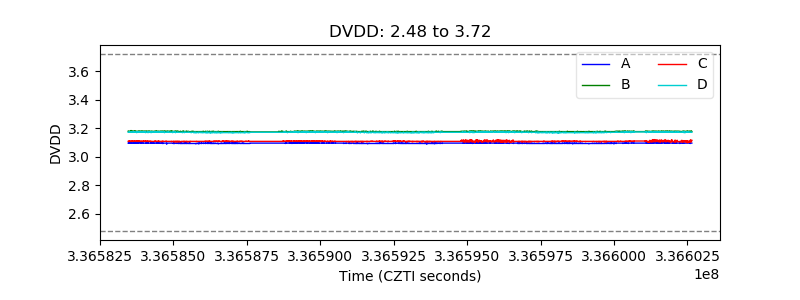 |
| Temperature 1 | 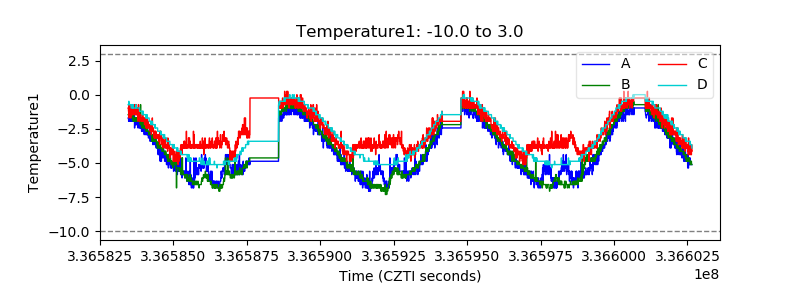 |
| Veto HV Monitor | 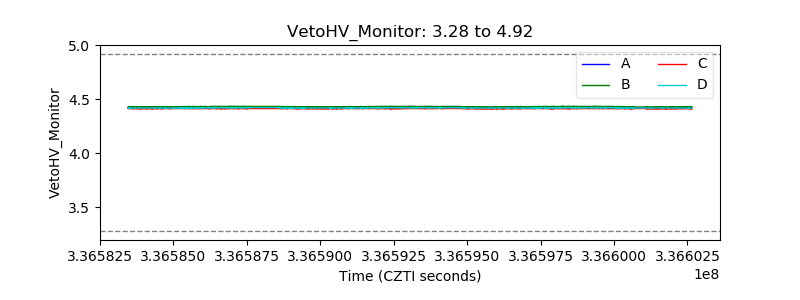 |
| Veto LLD | 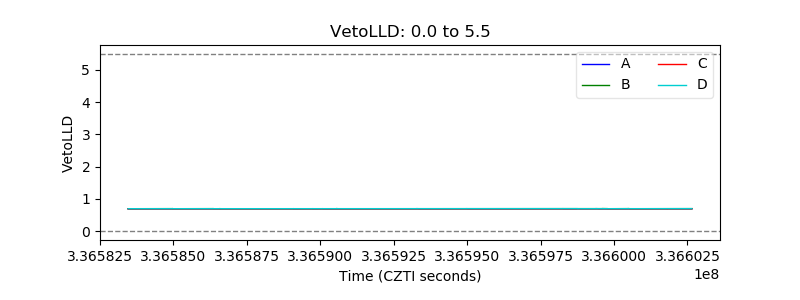 |
| Alpha Counter | 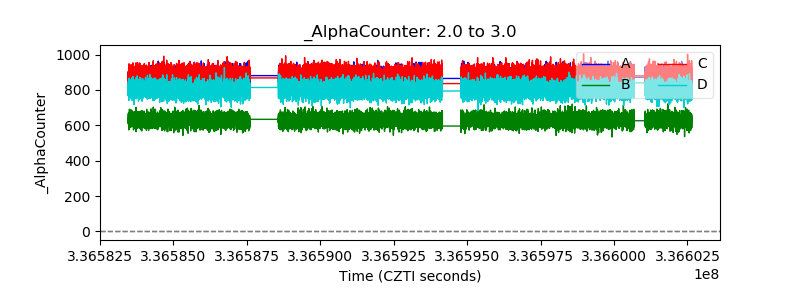 |
| _CPM_Rate | 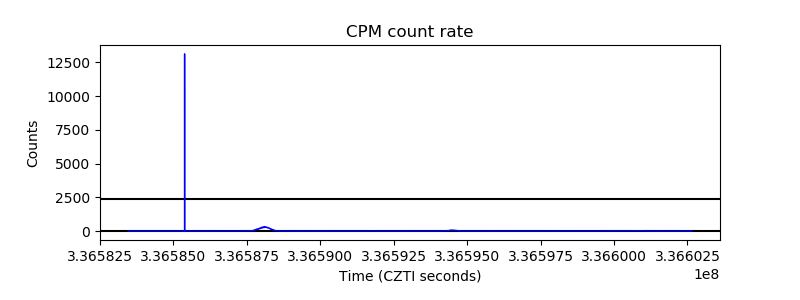 |
| CZT Counter | 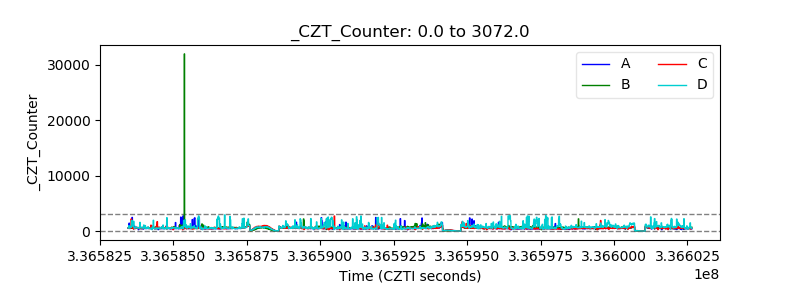 |
| +2.5 Volts monitor |  |
| +5 Volts monitor |  |
| _ROLL_ROT | 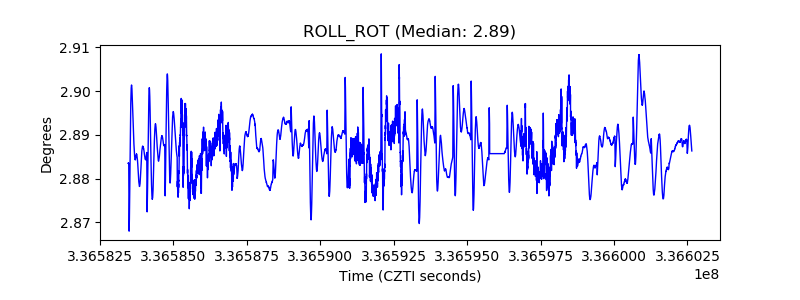 |
| _Roll_DEC | 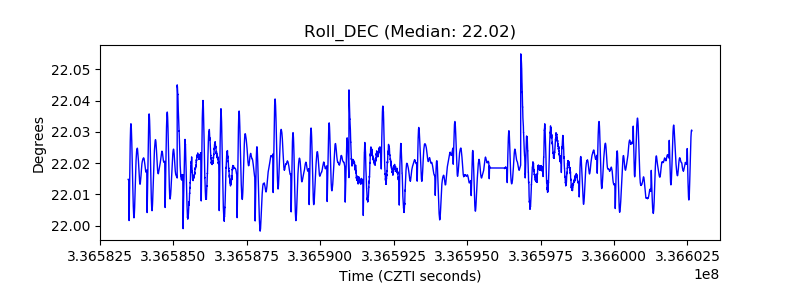 |
| _Roll_RA | 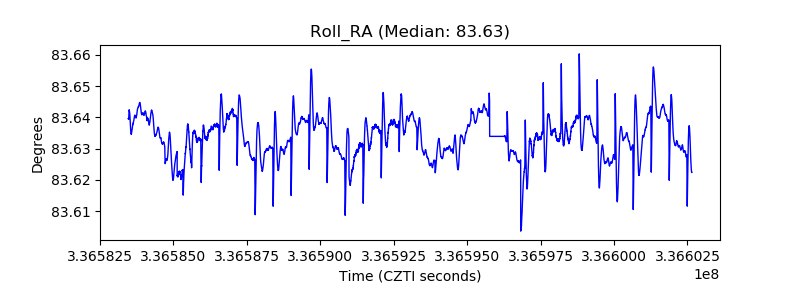 |
| Veto Counter | 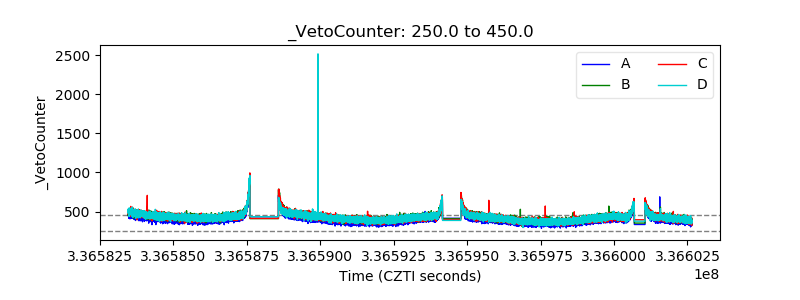 |