| Param | Original file | Final file |
|---|---|---|
| Filename | modeM0/AS1A09_145T01_9000003848_26639cztM0_level2.evt | modeM0/AS1A09_145T01_9000003848_26639cztM0_level2_quad_clean.evt |
| Size (bytes) | 118,100,160 | 17,936,640 |
| Size | 112.6 MB | 17.1 MB |
| Events in quadrant A | 784,029 | 107,953 |
| Events in quadrant B | 849,650 | 95,414 |
| Events in quadrant C | 821,592 | 111,590 |
| Events in quadrant D | 998,093 | 98,200 |
| Mode M0 | |||
|---|---|---|---|
| Quadrant | BADHDUFLAG | Total packets | Discarded packets |
| A | 0 | 3153 | 0 |
| B | 0 | 3536 | 0 |
| C | 0 | 3303 | 0 |
| D | 0 | 3840 | 0 |
| Mode M9 | |||
|---|---|---|---|
| Quadrant | BADHDUFLAG | Total packets | Discarded packets |
| A | 0 | 2 | 2 |
| B | 0 | 5 | 5 |
| C | 0 | 4 | 4 |
| D | 0 | 2 | 2 |
| Quadrant | Total seconds | Saturated seconds | Saturation percentage |
|---|---|---|---|
| A | 1527 | 6 | 0.392927% |
| B | 1397 | 8 | 0.572656% |
| C | 1568 | 14 | 0.892857% |
| D | 1368 | 59 | 4.312865% |
Noise dominated data is calculated using 1-second bins in cleaned event files. If a bin has >2000 counts, and if more than 50% of those come from <1% of pixels, then it is considered to be noise-dominated and hence unusable.
| Quadrant | # 1 sec bins | Bins with >0 counts | Bins with >2000 counts | High rate bins dominated by noise | Noise dominated (total time) | Noise dominated (detector-on time) | Marked lightcurve |
|---|---|---|---|---|---|---|---|
| A | 7781 | 1985 | 0 | 0 | 0.00% | 0.00% | 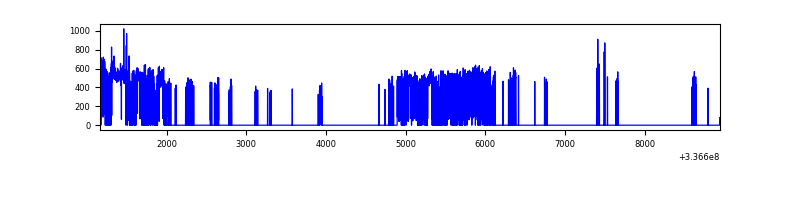 |
| B | 7608 | 1839 | 0 | 0 | 0.00% | 0.00% | 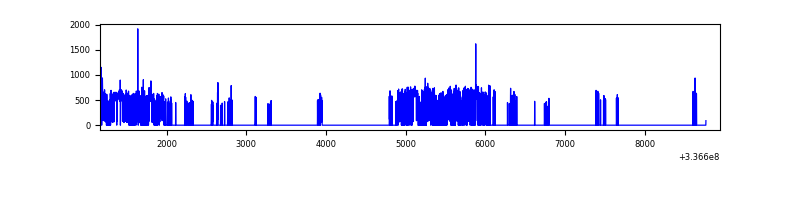 |
| C | 7780 | 2051 | 0 | 0 | 0.00% | 0.00% | 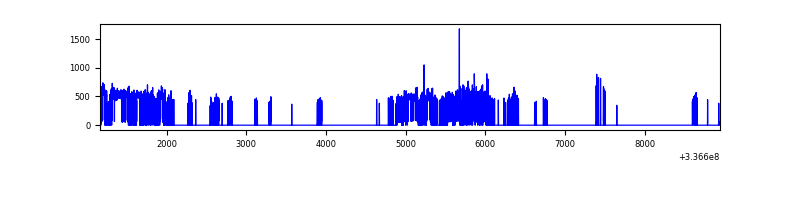 |
| D | 7784 | 1781 | 30 | 30 | 0.39% | 1.68% | 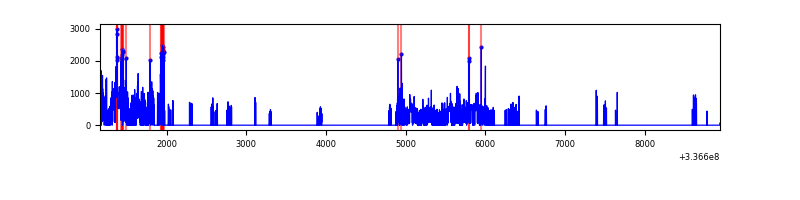 |
Top three noisy pixels from each quadrant. If the there are fewer than three noisy pixels in the level2.evt file, extra rows are filled as -1
| Pixel properties | Quadrant properties | ||||||
|---|---|---|---|---|---|---|---|
| Quadrant | DetID | PixID | Counts | Sigma | Mean | Median | Sigma |
| A | 0 | 13 | 9556 | 218.74 | 200 | 196 | 42.8 |
| A | 13 | 254 | 2549 | 54.99 | 200 | 196 | 42.8 |
| A | 3 | 137 | 1894 | 39.68 | 200 | 196 | 42.8 |
| B | 0 | 189 | 101773 | 2816.76 | 179 | 176 | 36.1 |
| B | 3 | 112 | 36839 | 1016.48 | 179 | 176 | 36.1 |
| B | 10 | 245 | 5271 | 141.26 | 179 | 176 | 36.1 |
| C | 14 | 238 | 30782 | 647.44 | 193 | 194 | 47.2 |
| C | 3 | 233 | 17476 | 365.8 | 193 | 194 | 47.2 |
| C | 2 | 16 | 5574 | 113.88 | 193 | 194 | 47.2 |
| D | 7 | 80 | 245028 | 5668.74 | 171 | 166 | 43.2 |
| D | 1 | 52 | 60018 | 1385.62 | 171 | 166 | 43.2 |
| D | 15 | 0 | 11534 | 263.18 | 171 | 166 | 43.2 |
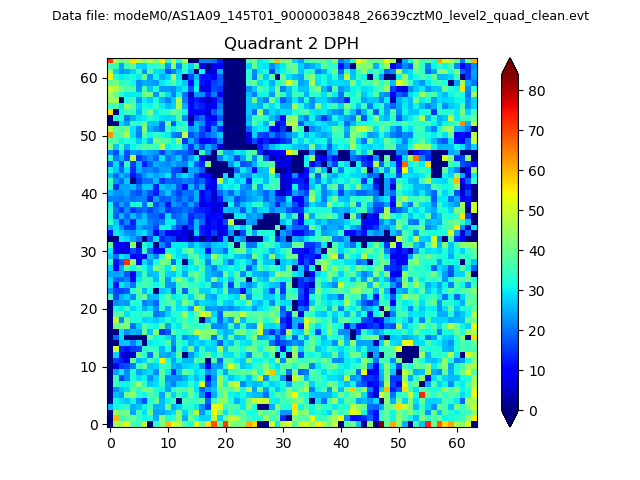
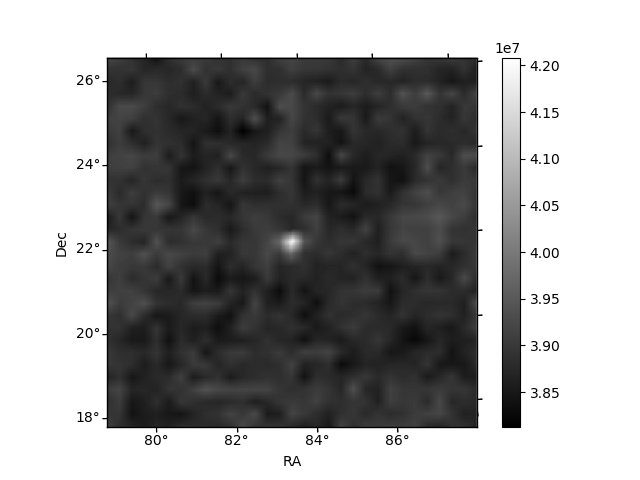
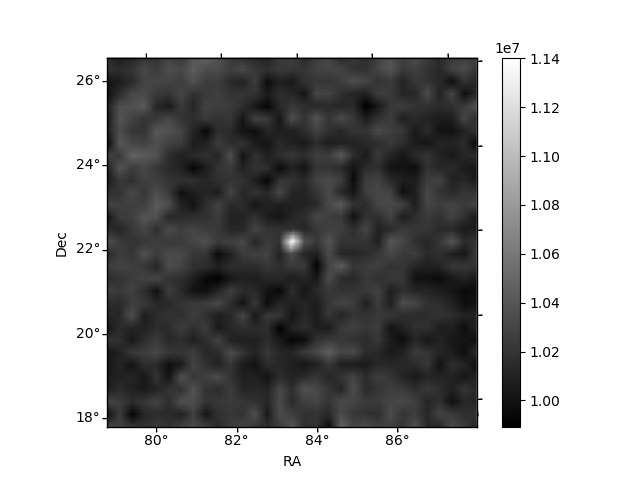
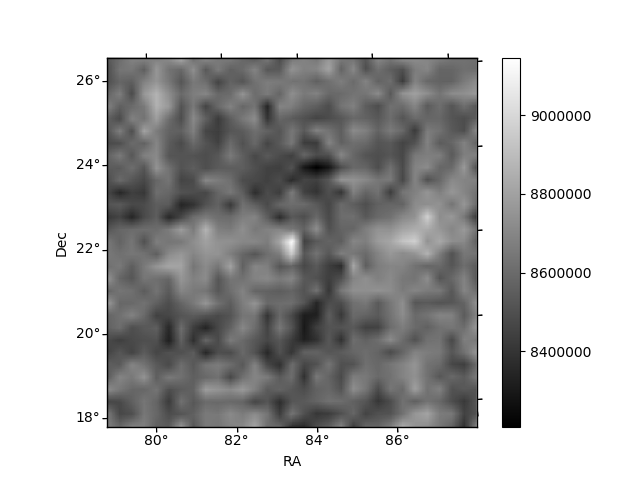
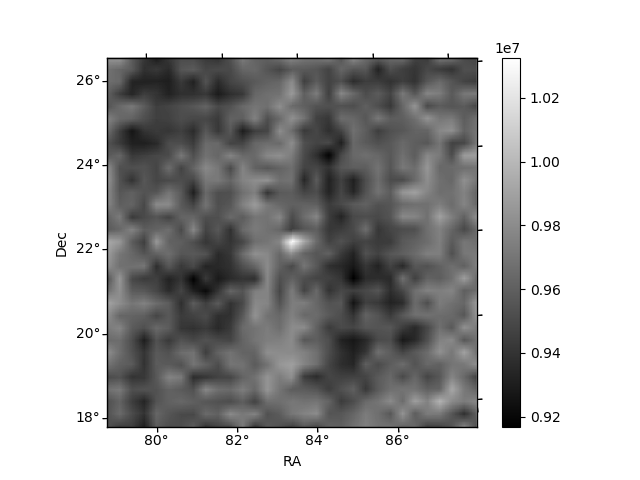
Histogram calculated using DETX and DETY for each event in the final _common_clean file
| Quadrant A | 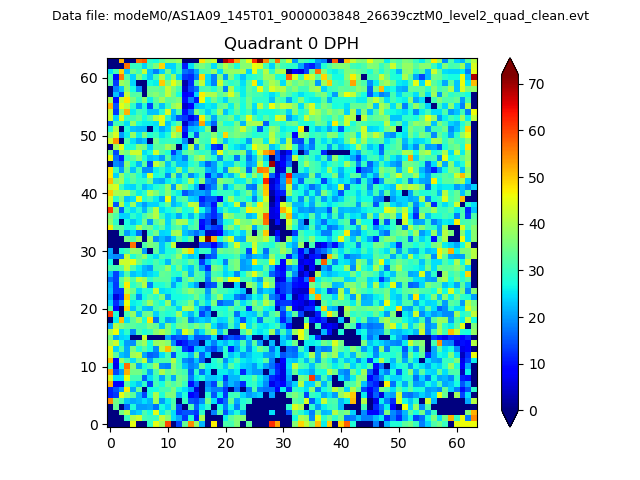 |
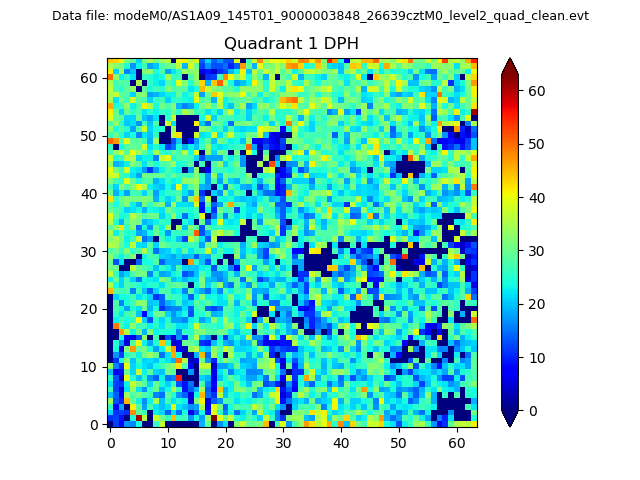 |
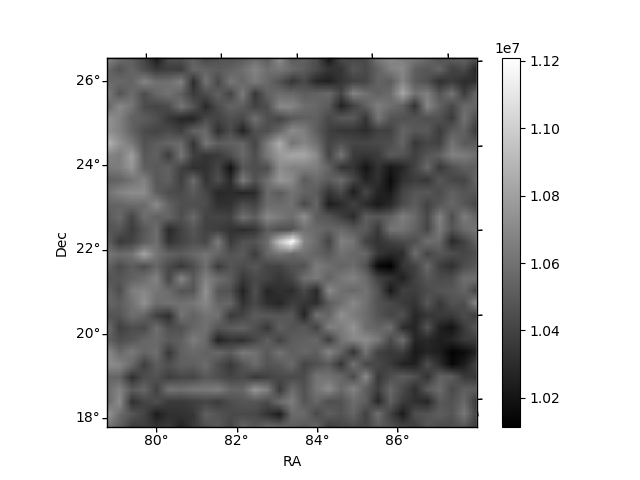
Quadrant B |
|---|---|---|---|
| Quadrant D | 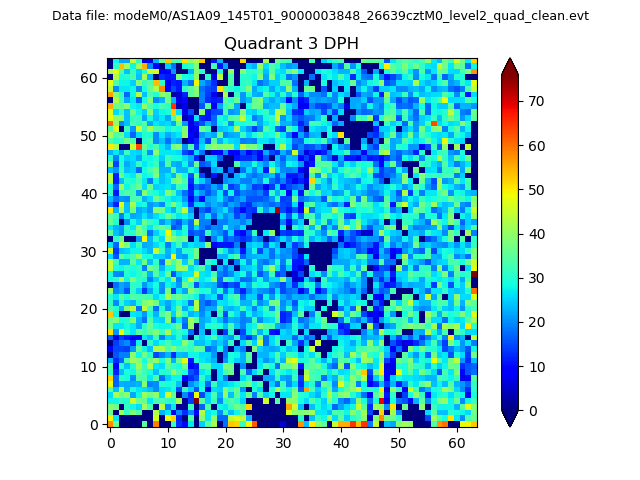 |
 |
Quadrant C |
| Plot type | Count rate plots | Images |
|---|---|---|
| Comparison with Poisson distribution Blue bars denote a histogram of data divided into 1 sec bins. Red curve is a Poisson curve with rate = median count rate of data. |
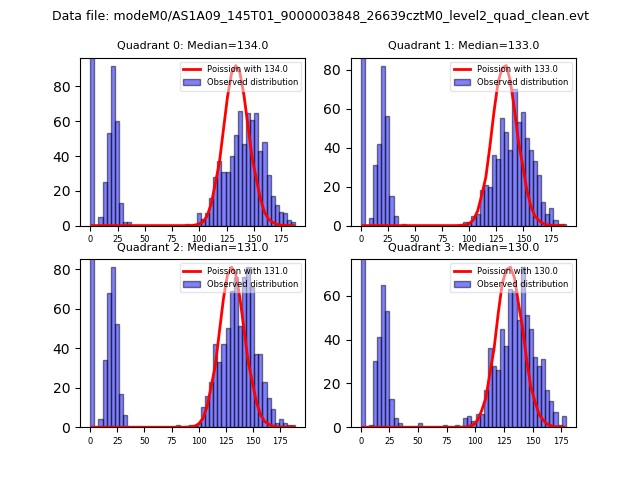 |
 |
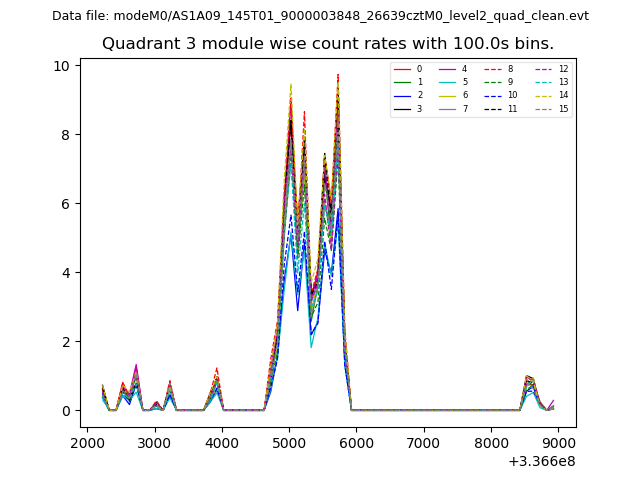
| Quadrant-wise count rates Data is divided into 100 sec bins |
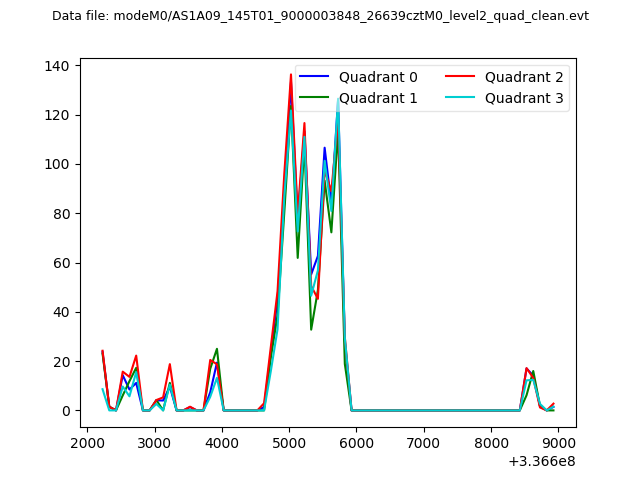 |
|
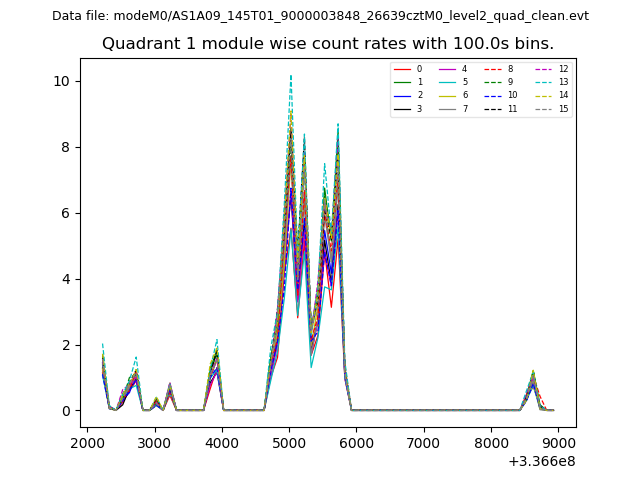
| Module-wise count rates for Quadrant A Data is divided into 100 sec bins |
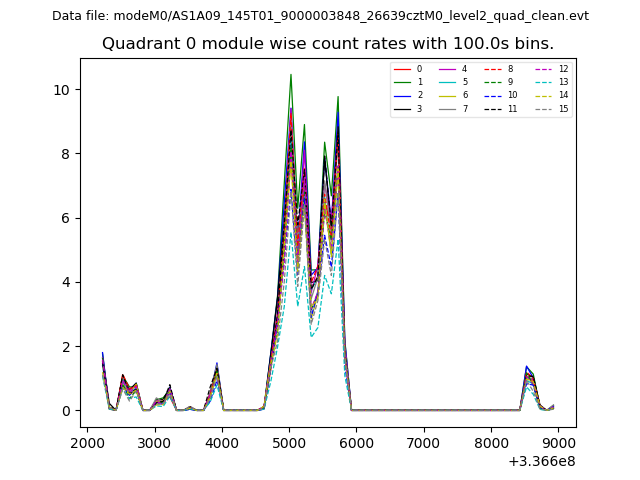 |
 |
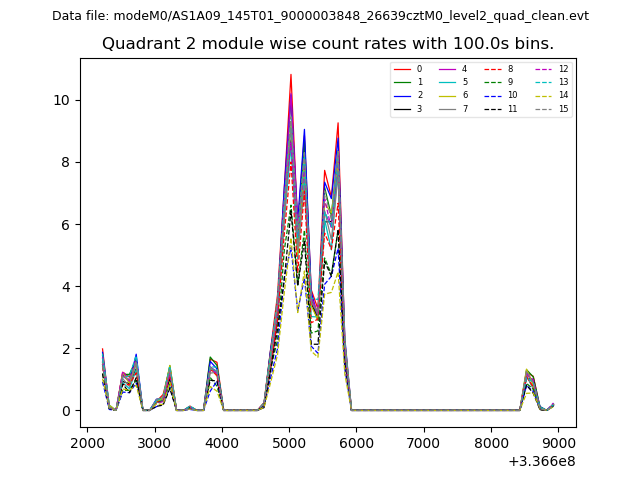
| Module-wise count rates for Quadrant B Data is divided into 100 sec bins |
 |
 |
| Module-wise count rates for Quadrant C Data is divided into 100 sec bins |
 |
 |
| Module-wise count rates for Quadrant D Data is divided into 100 sec bins |
 |
 |
| Parameter | Plot |
|---|---|
| CZT HV Monitor | 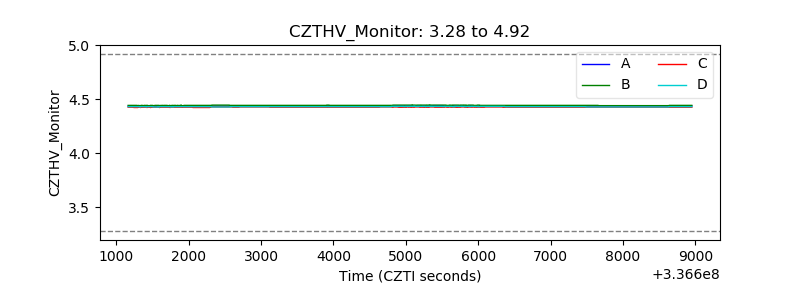 |
| D_VDD | 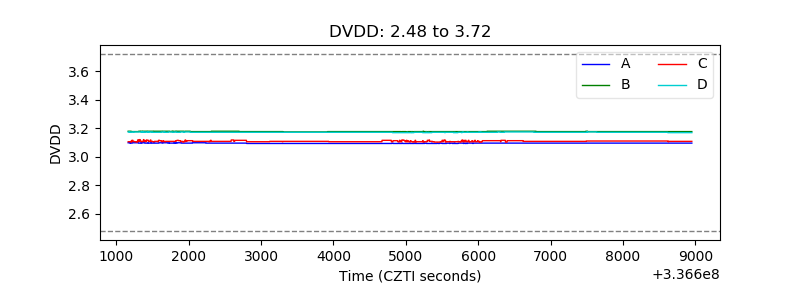 |
| Temperature 1 | 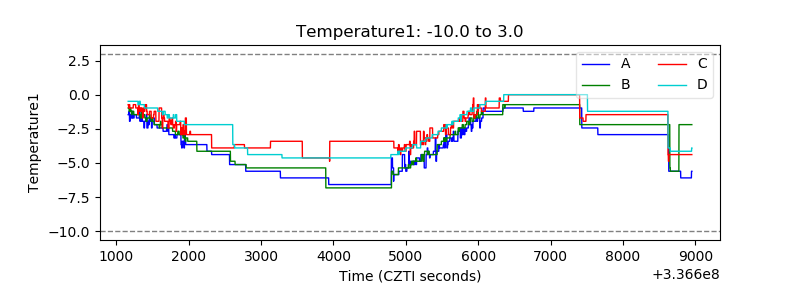 |
| Veto HV Monitor | 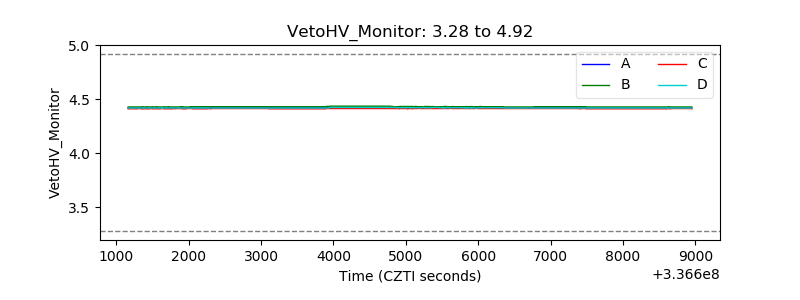 |
| Veto LLD | 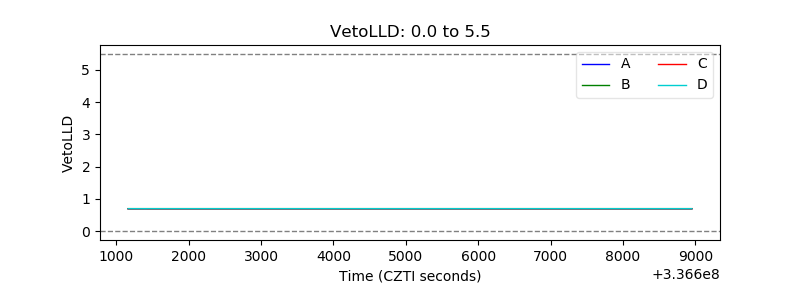 |
| Alpha Counter | 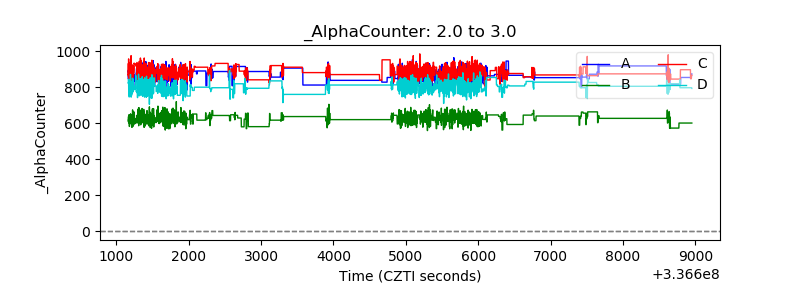 |
| _CPM_Rate |  |
| CZT Counter |  |
| +2.5 Volts monitor | 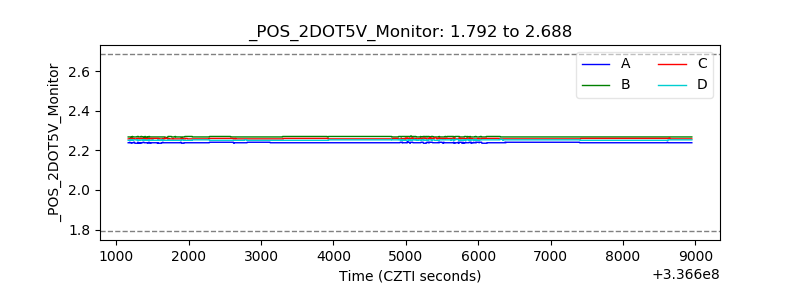 |
| +5 Volts monitor |  |
| _ROLL_ROT | 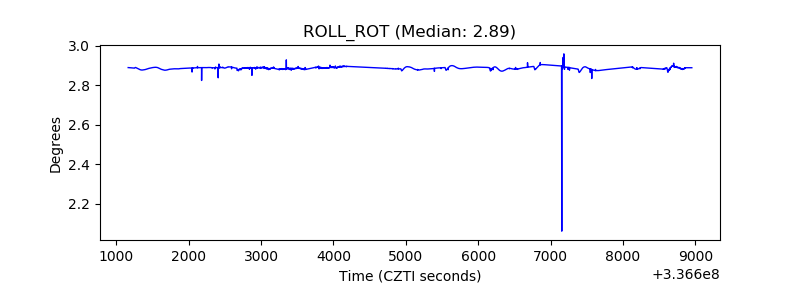 |
| _Roll_DEC | 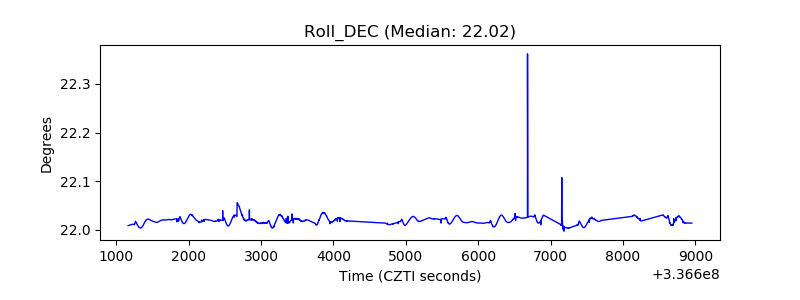 |
| _Roll_RA | 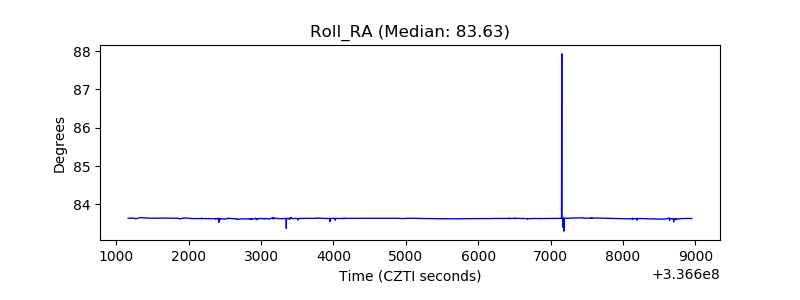 |
| Veto Counter | 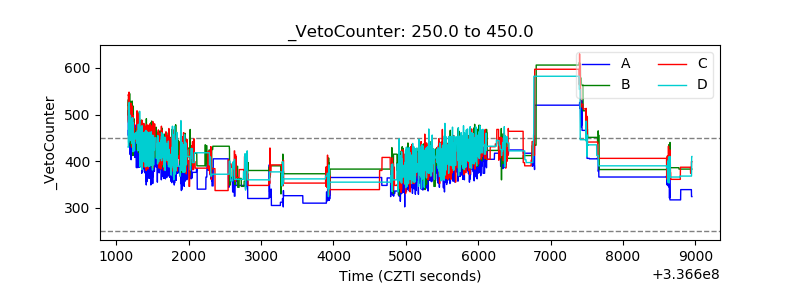 |