| Param | Original file | Final file |
|---|---|---|
| Filename | modeM0/AS1A09_145T01_9000003848_26643cztM0_level2.evt | modeM0/AS1A09_145T01_9000003848_26643cztM0_level2_quad_clean.evt |
| Size (bytes) | 424,160,640 | 86,768,640 |
| Size | 404.5 MB | 82.7 MB |
| Events in quadrant A | 2,896,675 | 560,901 |
| Events in quadrant B | 3,143,332 | 570,542 |
| Events in quadrant C | 2,947,360 | 545,341 |
| Events in quadrant D | 3,448,765 | 530,178 |
| Mode M0 | |||
|---|---|---|---|
| Quadrant | BADHDUFLAG | Total packets | Discarded packets |
| A | 0 | 12374 | 0 |
| B | 0 | 13131 | 0 |
| C | 0 | 12546 | 0 |
| D | 0 | 14334 | 0 |
| Mode M9 | |||
|---|---|---|---|
| Quadrant | BADHDUFLAG | Total packets | Discarded packets |
| A | 0 | 9 | 0 |
| B | 0 | 9 | 0 |
| C | 0 | 9 | 0 |
| D | 0 | 9 | 0 |
| Quadrant | Total seconds | Saturated seconds | Saturation percentage |
|---|---|---|---|
| A | 6025 | 38 | 0.630705% |
| B | 6026 | 48 | 0.796548% |
| C | 6026 | 73 | 1.211417% |
| D | 6026 | 122 | 2.024560% |
Noise dominated data is calculated using 1-second bins in cleaned event files. If a bin has >2000 counts, and if more than 50% of those come from <1% of pixels, then it is considered to be noise-dominated and hence unusable.
| Quadrant | # 1 sec bins | Bins with >0 counts | Bins with >2000 counts | High rate bins dominated by noise | Noise dominated (total time) | Noise dominated (detector-on time) | Marked lightcurve |
|---|---|---|---|---|---|---|---|
| A | 6965 | 6026 | 0 | 0 | 0.00% | 0.00% | 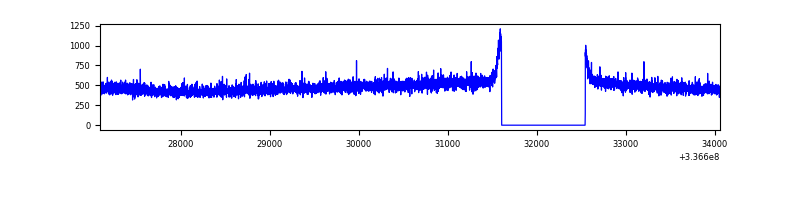 |
| B | 6966 | 6027 | 0 | 0 | 0.00% | 0.00% | 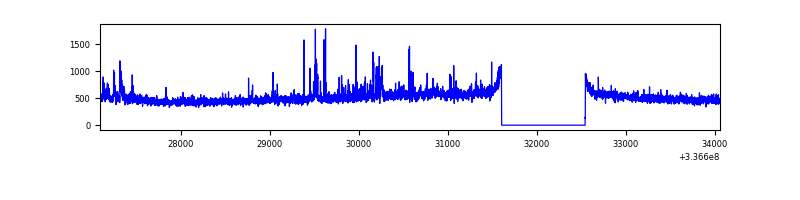 |
| C | 6966 | 6027 | 4 | 4 | 0.06% | 0.07% | 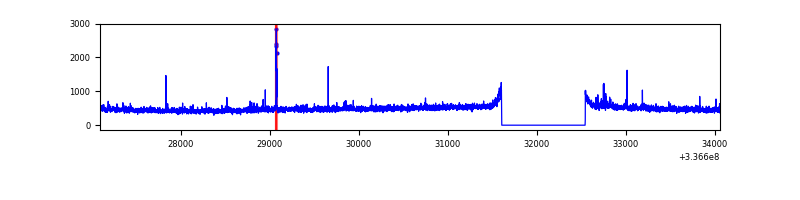 |
| D | 6966 | 6027 | 78 | 78 | 1.12% | 1.29% | 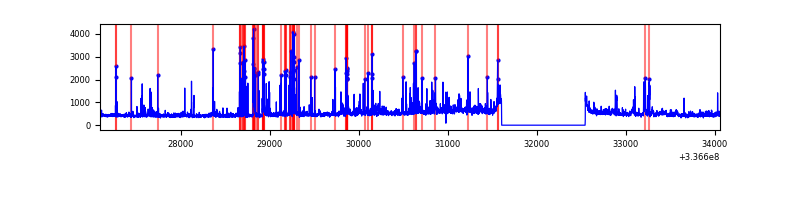 |
Top three noisy pixels from each quadrant. If the there are fewer than three noisy pixels in the level2.evt file, extra rows are filled as -1
| Pixel properties | Quadrant properties | ||||||
|---|---|---|---|---|---|---|---|
| Quadrant | DetID | PixID | Counts | Sigma | Mean | Median | Sigma |
| A | 0 | 13 | 19734 | 126.13 | 745 | 732 | 150.7 |
| A | 13 | 254 | 9911 | 60.93 | 745 | 732 | 150.7 |
| A | 3 | 137 | 6786 | 40.18 | 745 | 732 | 150.7 |
| B | 3 | 112 | 177533 | 1236.57 | 741 | 725 | 143.0 |
| B | 0 | 219 | 28256 | 192.55 | 741 | 725 | 143.0 |
| B | 0 | 190 | 20564 | 138.75 | 741 | 725 | 143.0 |
| C | 14 | 238 | 114102 | 680.17 | 710 | 717 | 166.7 |
| C | 15 | 208 | 34020 | 199.78 | 710 | 717 | 166.7 |
| C | 3 | 233 | 32486 | 190.58 | 710 | 717 | 166.7 |
| D | 1 | 52 | 612534 | 3184.83 | 708 | 694 | 192.1 |
| D | 2 | 250 | 58866 | 302.8 | 708 | 694 | 192.1 |
| D | 7 | 80 | 30725 | 156.32 | 708 | 694 | 192.1 |
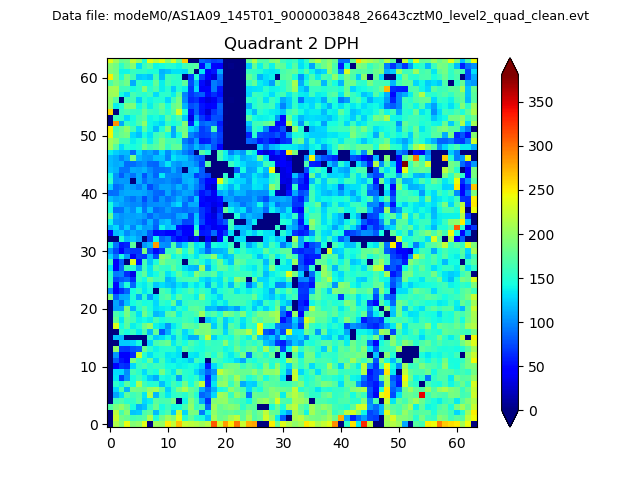
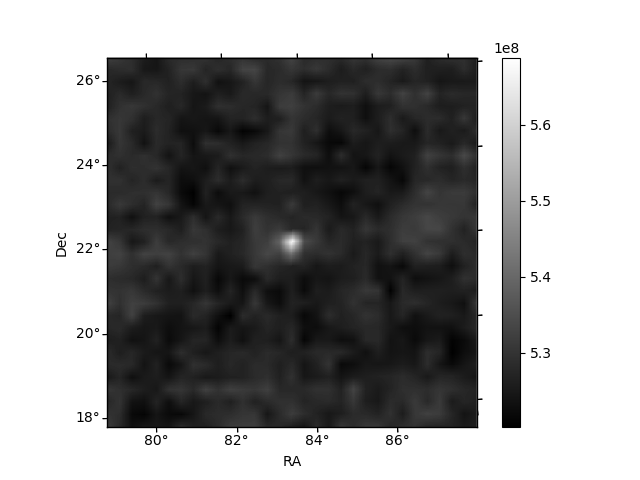
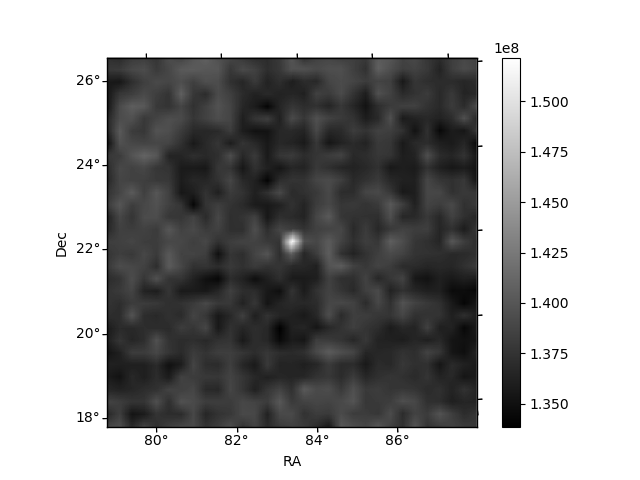
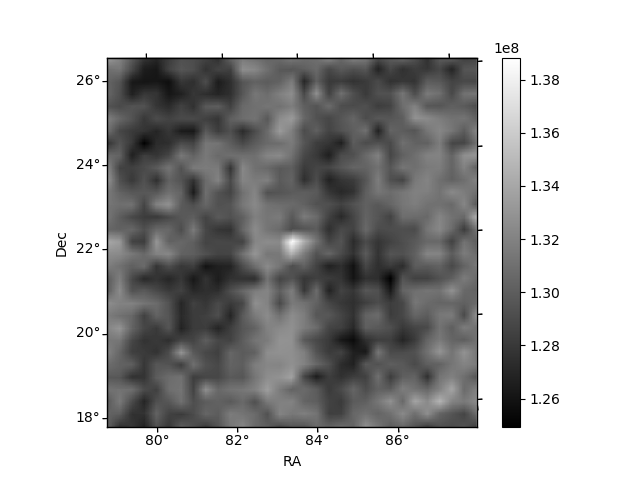
Histogram calculated using DETX and DETY for each event in the final _common_clean file
| Quadrant A | 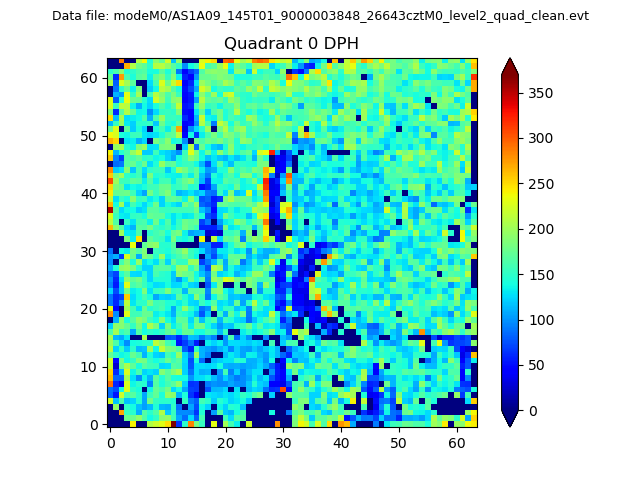 |
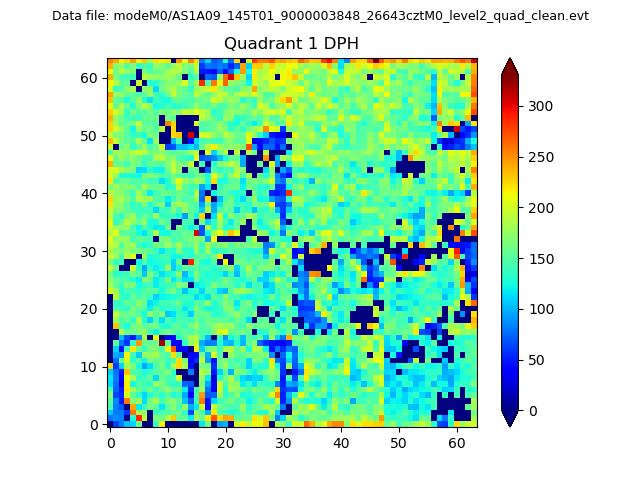 |
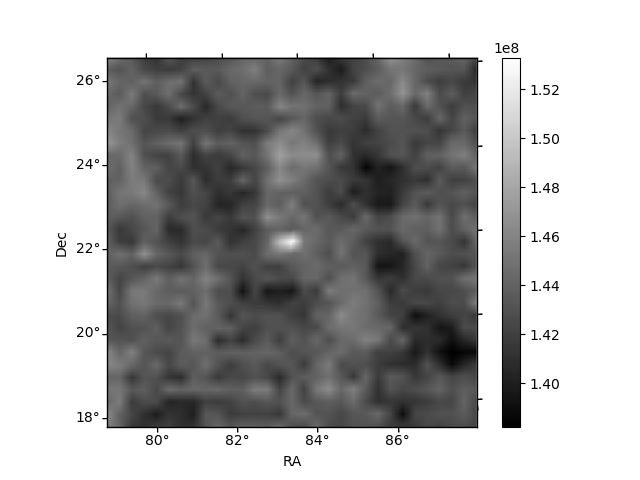
Quadrant B |
|---|---|---|---|
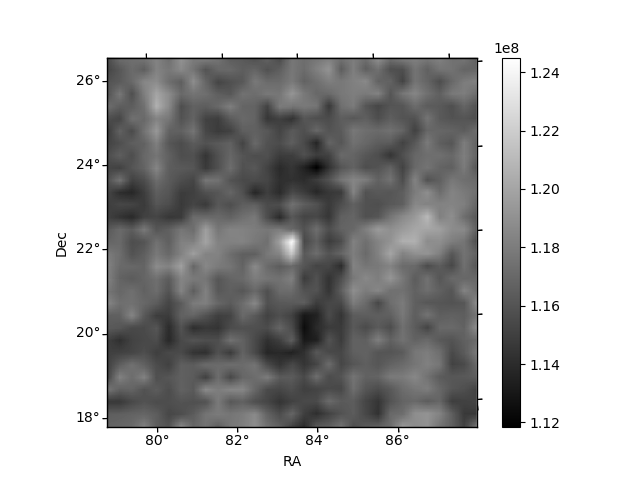
| Quadrant D | 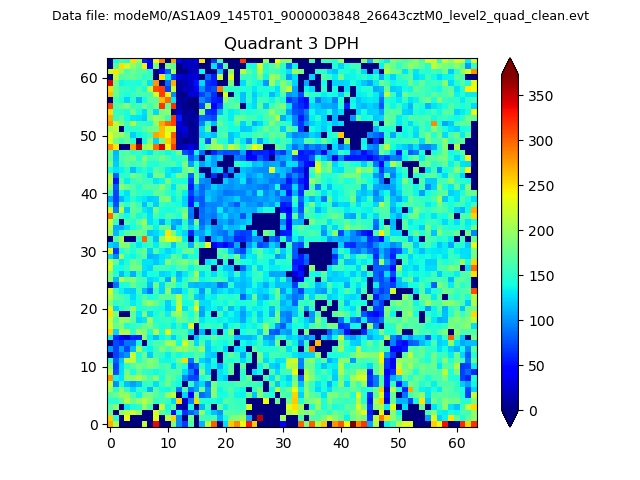 |
 |
Quadrant C |
| Plot type | Count rate plots | Images |
|---|---|---|
| Comparison with Poisson distribution Blue bars denote a histogram of data divided into 1 sec bins. Red curve is a Poisson curve with rate = median count rate of data. |
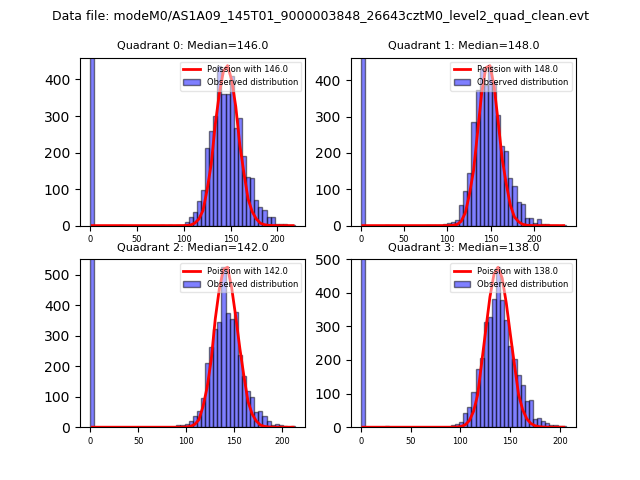 |
 |
| Quadrant-wise count rates Data is divided into 100 sec bins |
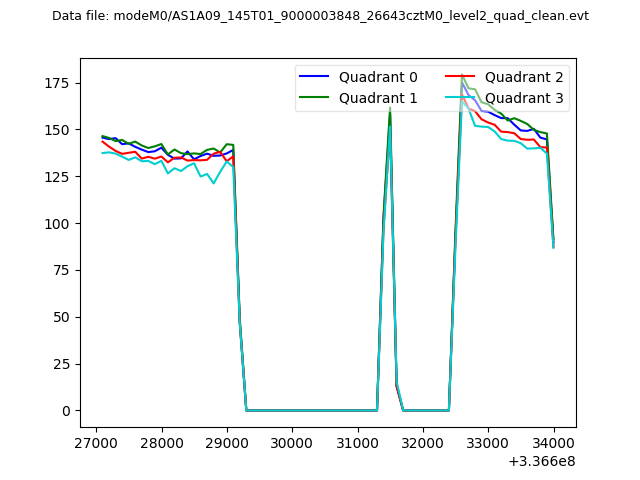 |
|
| Module-wise count rates for Quadrant A Data is divided into 100 sec bins |
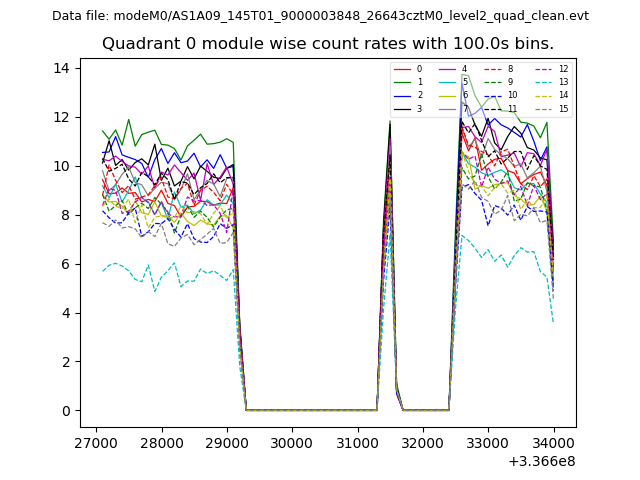 |
 |
| Module-wise count rates for Quadrant B Data is divided into 100 sec bins |
 |
 |
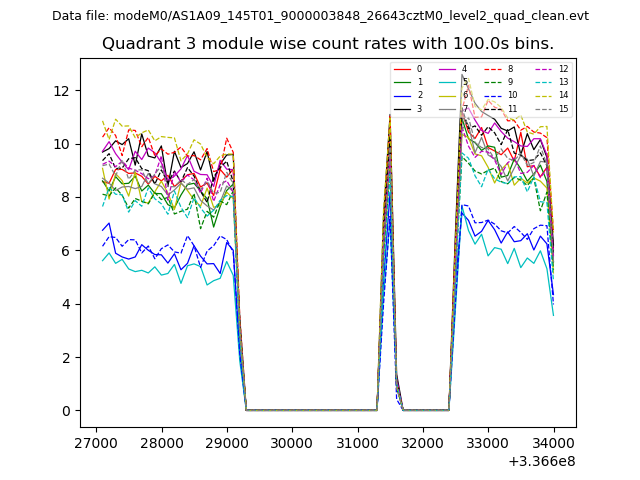
| Module-wise count rates for Quadrant C Data is divided into 100 sec bins |
 |
 |
| Module-wise count rates for Quadrant D Data is divided into 100 sec bins |
 |
 |
| Parameter | Plot |
|---|---|
| CZT HV Monitor |  |
| D_VDD | 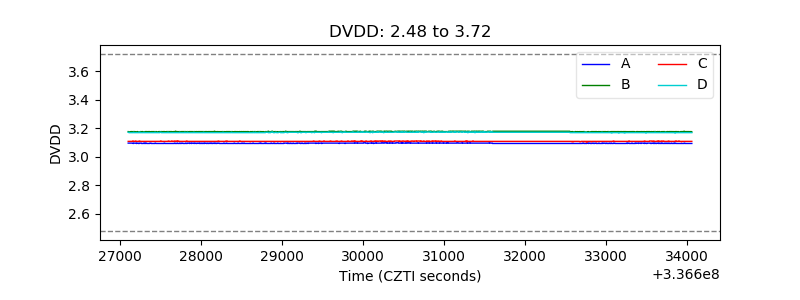 |
| Temperature 1 | 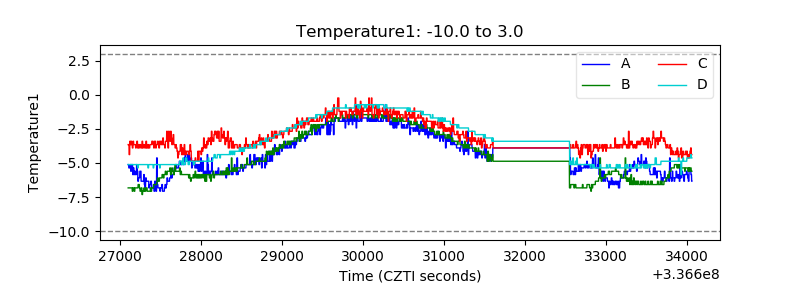 |
| Veto HV Monitor | 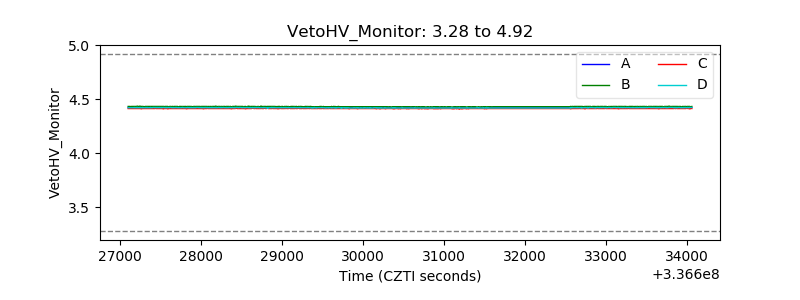 |
| Veto LLD | 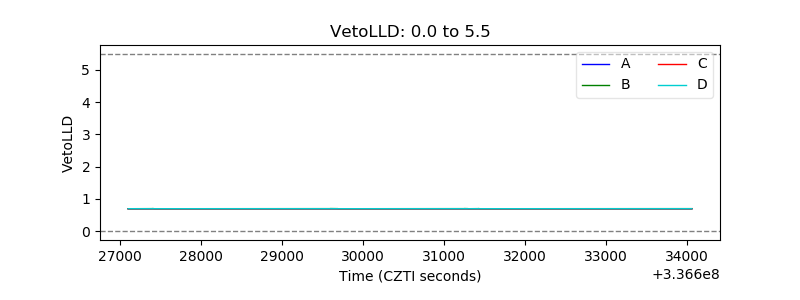 |
| Alpha Counter |  |
| _CPM_Rate | 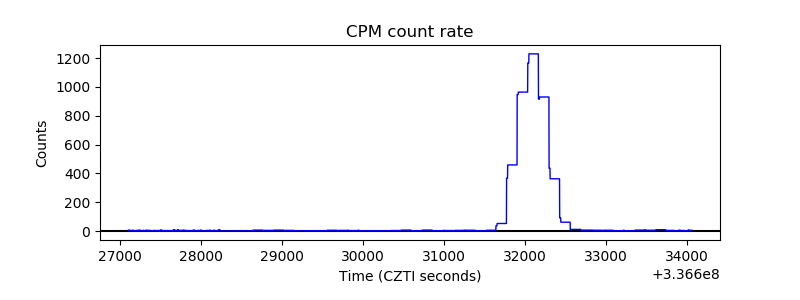 |
| CZT Counter | 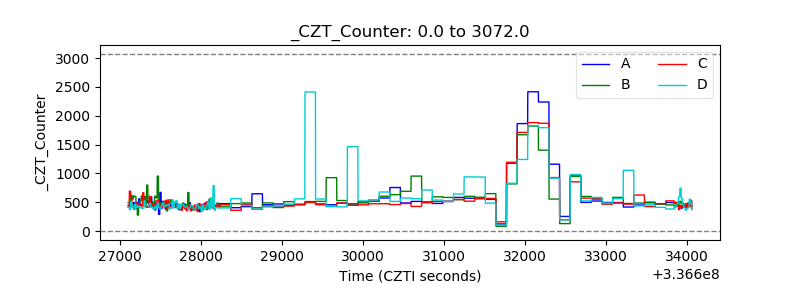 |
| +2.5 Volts monitor |  |
| +5 Volts monitor |  |
| _ROLL_ROT | 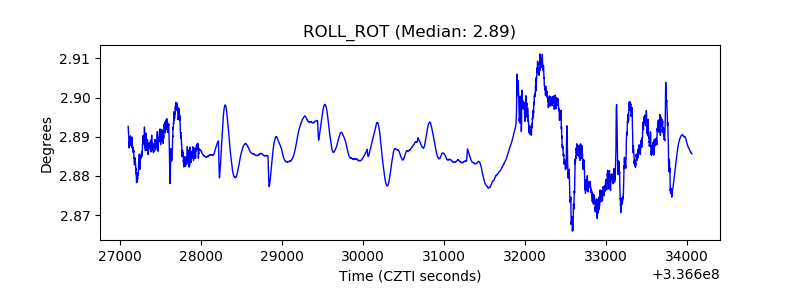 |
| _Roll_DEC | 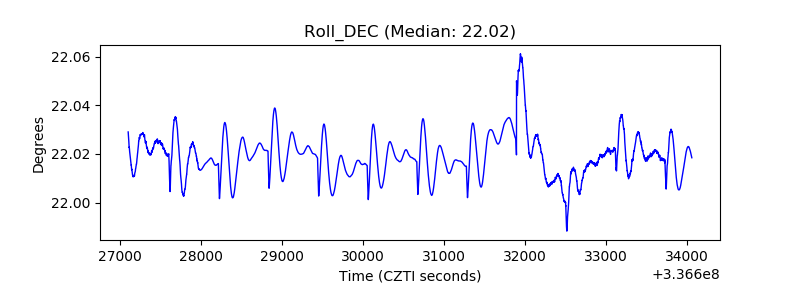 |
| _Roll_RA | 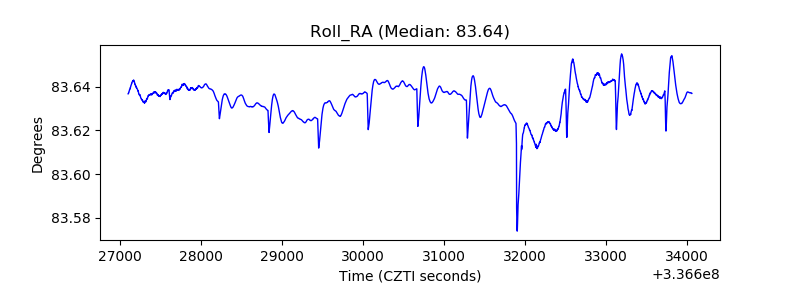 |
| Veto Counter | 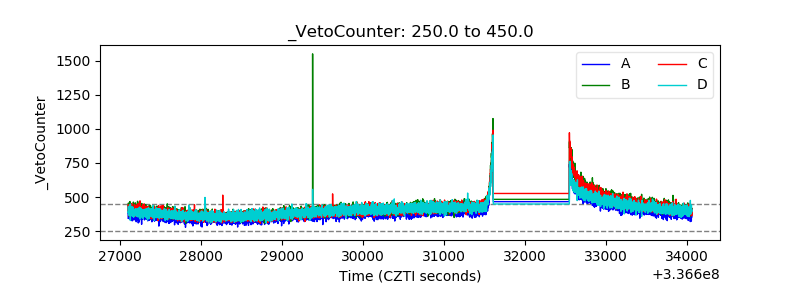 |