| Param | Original file | Final file |
|---|---|---|
| Filename | modeM0/AS1A09_145T01_9000003848_26645cztM0_level2.evt | modeM0/AS1A09_145T01_9000003848_26645cztM0_level2_quad_clean.evt |
| Size (bytes) | 1,821,899,520 | 325,428,480 |
| Size | 1.7 GB | 310.4 MB |
| Events in quadrant A | 11,193,041 | 2,137,838 |
| Events in quadrant B | 12,897,770 | 2,139,711 |
| Events in quadrant C | 11,256,695 | 2,062,433 |
| Events in quadrant D | 18,317,718 | 1,974,221 |
| Mode M0 | |||
|---|---|---|---|
| Quadrant | BADHDUFLAG | Total packets | Discarded packets |
| A | 0 | 47354 | 0 |
| B | 0 | 53186 | 0 |
| C | 0 | 47273 | 0 |
| D | 0 | 69806 | 0 |
| Mode M9 | |||
|---|---|---|---|
| Quadrant | BADHDUFLAG | Total packets | Discarded packets |
| A | 0 | 26 | 0 |
| B | 0 | 26 | 0 |
| C | 0 | 26 | 0 |
| D | 0 | 26 | 0 |
| Quadrant | Total seconds | Saturated seconds | Saturation percentage |
|---|---|---|---|
| A | 22421 | 184 | 0.820659% |
| B | 22421 | 205 | 0.914321% |
| C | 22420 | 319 | 1.422837% |
| D | 22420 | 2117 | 9.442462% |
Noise dominated data is calculated using 1-second bins in cleaned event files. If a bin has >2000 counts, and if more than 50% of those come from <1% of pixels, then it is considered to be noise-dominated and hence unusable.
| Quadrant | # 1 sec bins | Bins with >0 counts | Bins with >2000 counts | High rate bins dominated by noise | Noise dominated (total time) | Noise dominated (detector-on time) | Marked lightcurve |
|---|---|---|---|---|---|---|---|
| A | 32180 | 22425 | 48 | 48 | 0.15% | 0.21% | 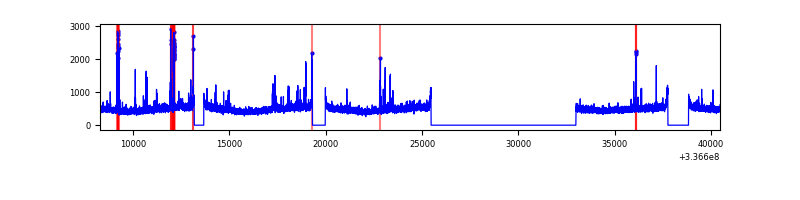 |
| B | 32180 | 22425 | 24 | 24 | 0.07% | 0.11% | 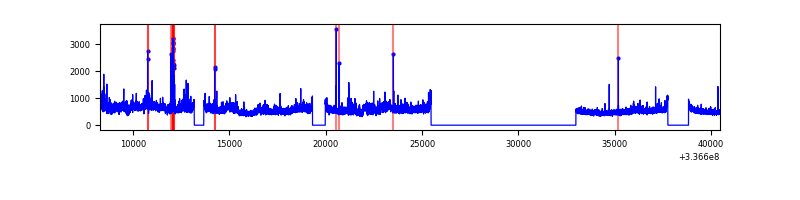 |
| C | 32179 | 22424 | 22 | 22 | 0.07% | 0.10% | 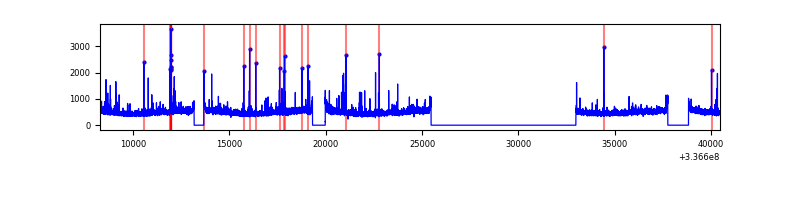 |
| D | 32179 | 22424 | 1549 | 1549 | 4.81% | 6.91% | 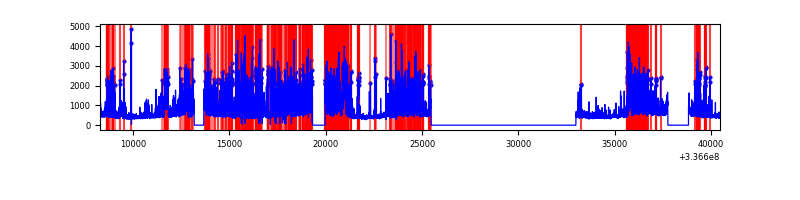 |
Top three noisy pixels from each quadrant. If the there are fewer than three noisy pixels in the level2.evt file, extra rows are filled as -1
| Pixel properties | Quadrant properties | ||||||
|---|---|---|---|---|---|---|---|
| Quadrant | DetID | PixID | Counts | Sigma | Mean | Median | Sigma |
| A | 0 | 13 | 442869 | 791.34 | 2785 | 2740 | 556.2 |
| A | 13 | 254 | 36373 | 60.47 | 2785 | 2740 | 556.2 |
| A | 3 | 137 | 24991 | 40.01 | 2785 | 2740 | 556.2 |
| B | 0 | 189 | 1400260 | 2672.7 | 2763 | 2702 | 522.9 |
| B | 3 | 112 | 475722 | 904.61 | 2763 | 2702 | 522.9 |
| B | 10 | 245 | 84396 | 156.23 | 2763 | 2702 | 522.9 |
| C | 14 | 238 | 429714 | 685.44 | 2658 | 2685 | 623.0 |
| C | 3 | 233 | 185461 | 293.38 | 2658 | 2685 | 623.0 |
| C | 2 | 16 | 141722 | 223.17 | 2658 | 2685 | 623.0 |
| D | 1 | 52 | 4812407 | 7483.58 | 2587 | 2533 | 642.7 |
| D | 7 | 80 | 1759049 | 2732.93 | 2587 | 2533 | 642.7 |
| D | 12 | 233 | 1411643 | 2192.41 | 2587 | 2533 | 642.7 |
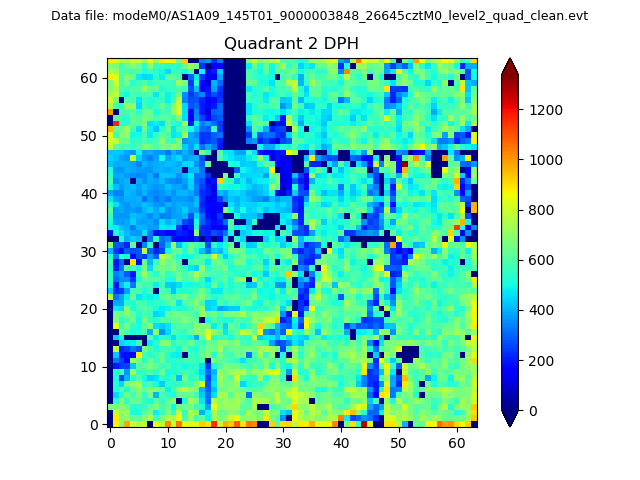
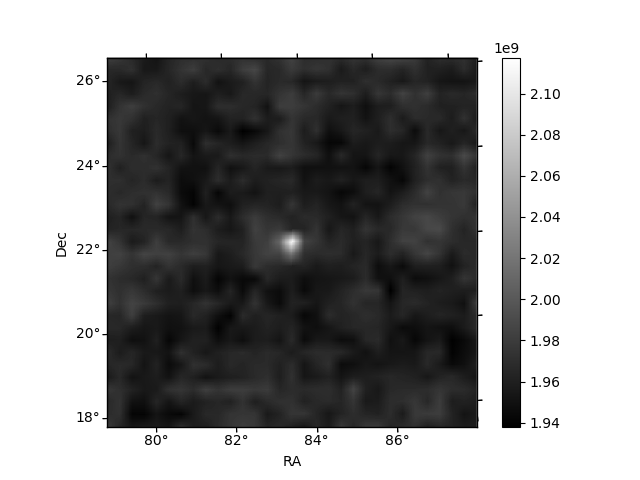
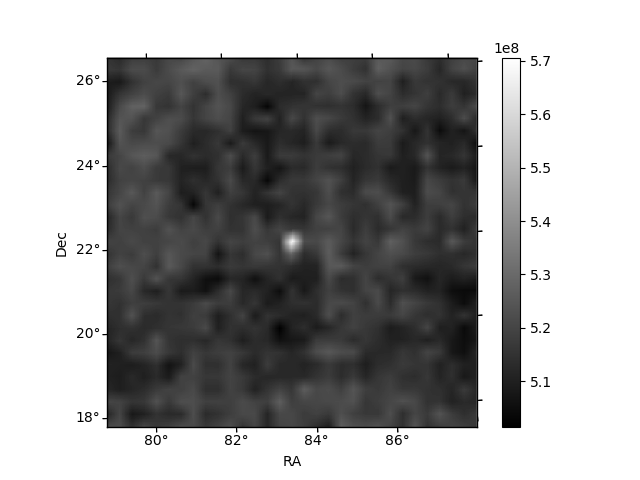
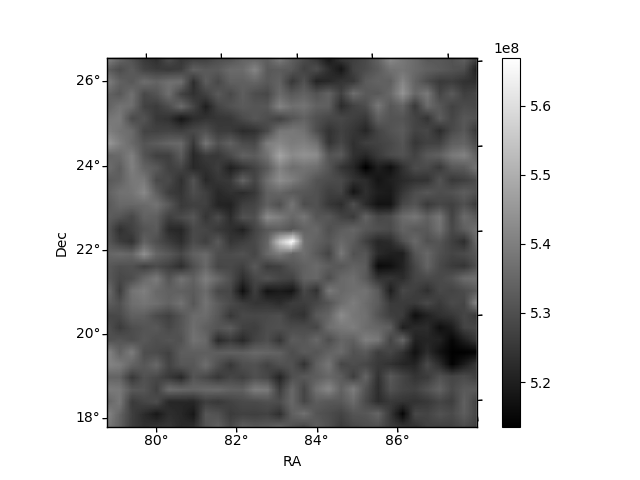
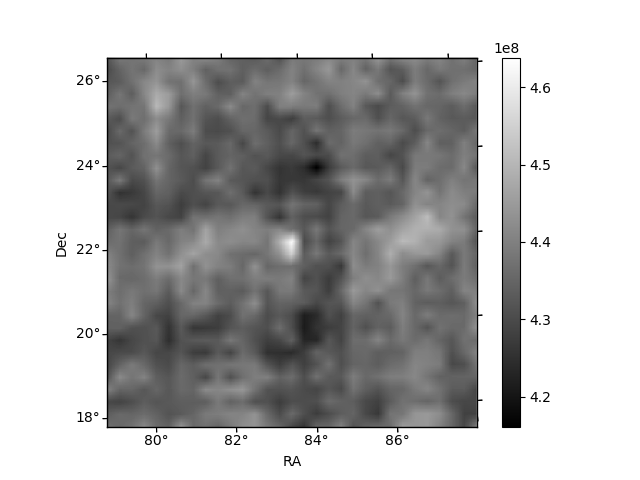
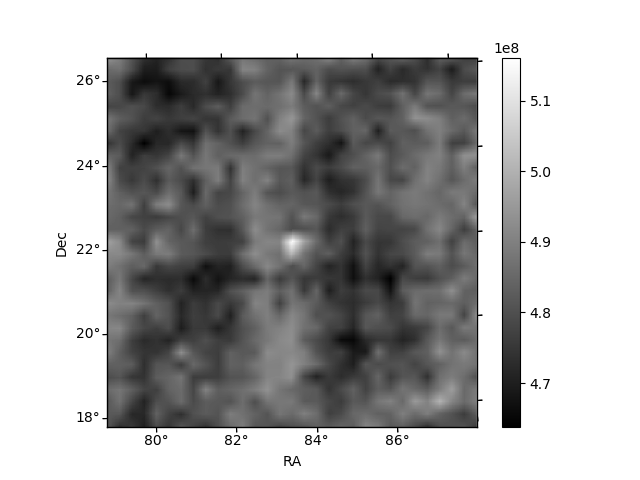
Histogram calculated using DETX and DETY for each event in the final _common_clean file
| Quadrant A | 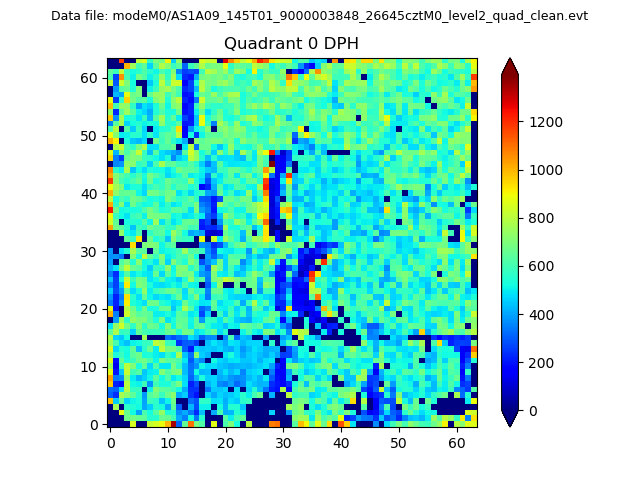 |
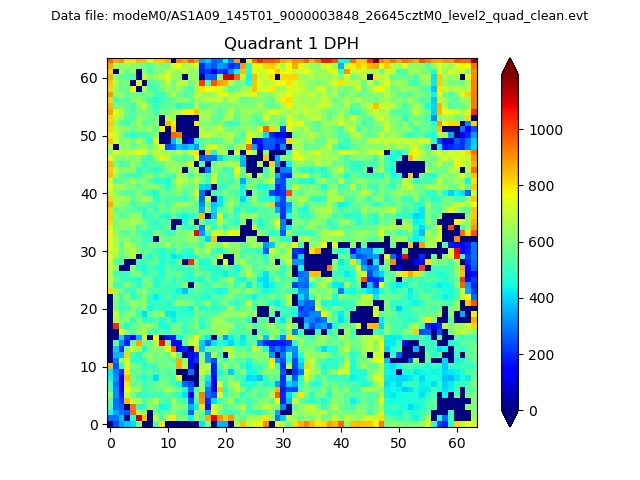 |
Quadrant B |
|---|---|---|---|
| Quadrant D | 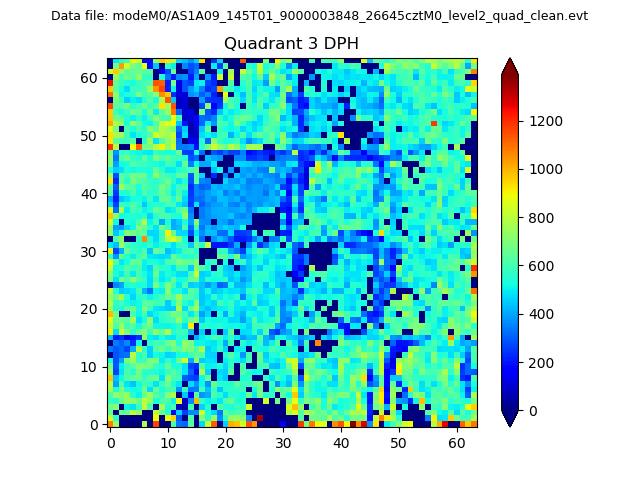 |
 |
Quadrant C |
| Plot type | Count rate plots | Images |
|---|---|---|
| Comparison with Poisson distribution Blue bars denote a histogram of data divided into 1 sec bins. Red curve is a Poisson curve with rate = median count rate of data. |
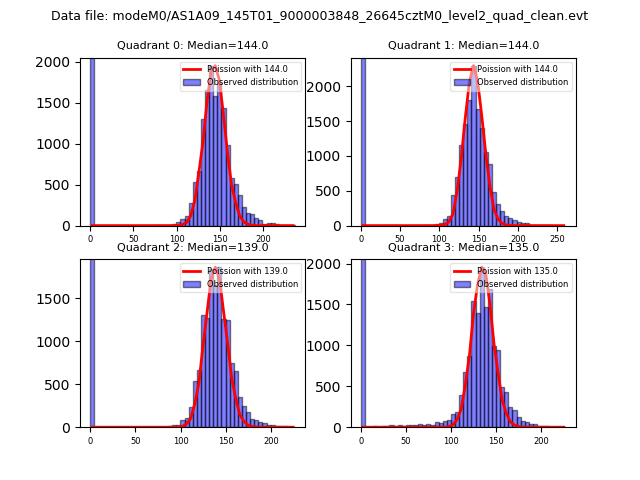 |
 |
| Quadrant-wise count rates Data is divided into 100 sec bins |
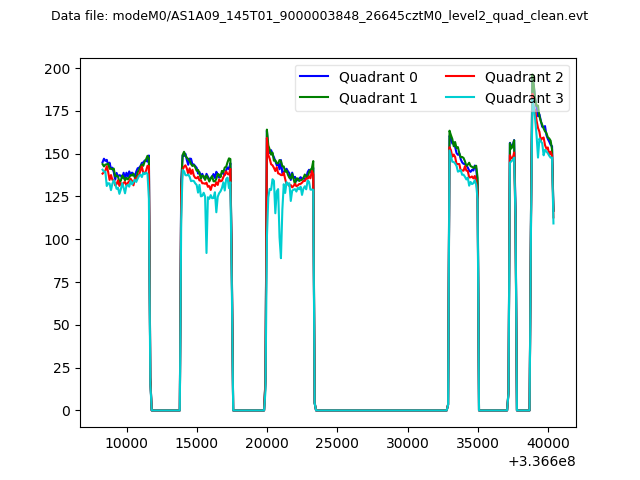 |
|
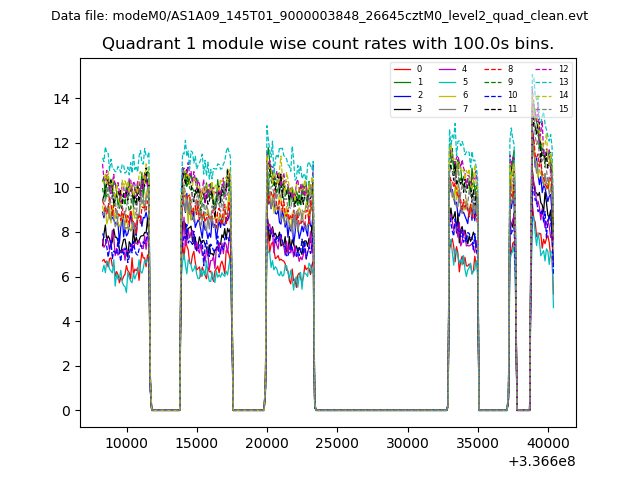
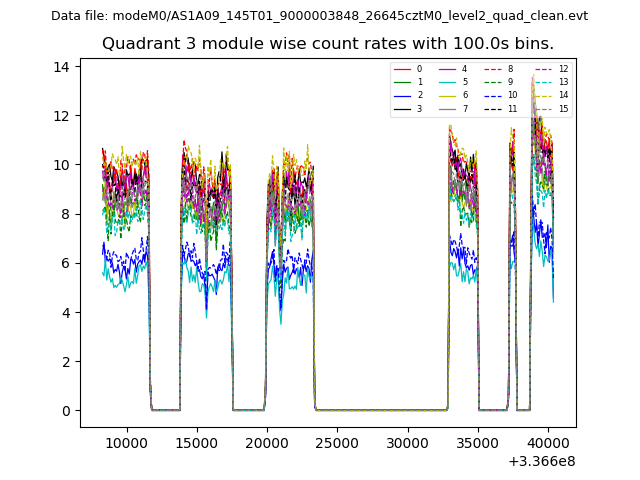
| Module-wise count rates for Quadrant A Data is divided into 100 sec bins |
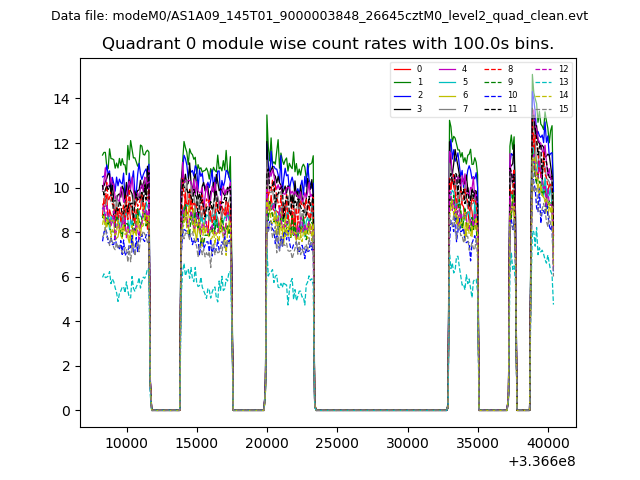 |
 |
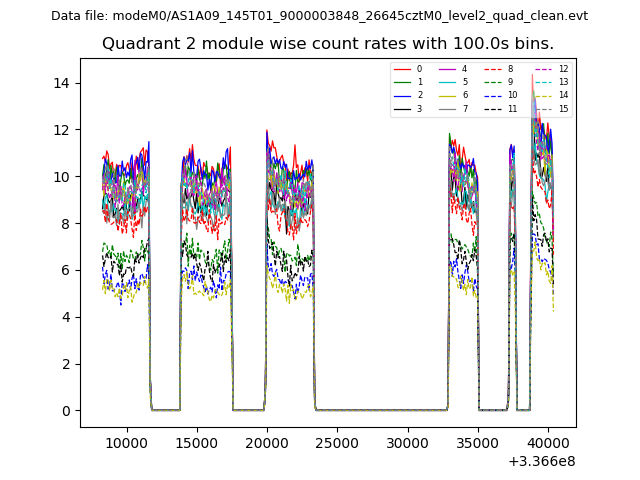
| Module-wise count rates for Quadrant B Data is divided into 100 sec bins |
 |
 |
| Module-wise count rates for Quadrant C Data is divided into 100 sec bins |
 |
 |
| Module-wise count rates for Quadrant D Data is divided into 100 sec bins |
 |
 |
| Parameter | Plot |
|---|---|
| CZT HV Monitor |  |
| D_VDD | 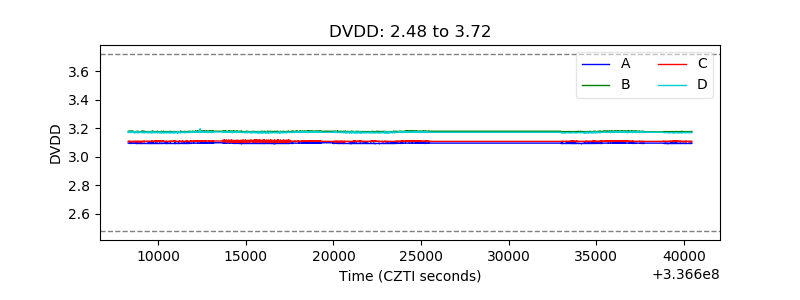 |
| Temperature 1 | 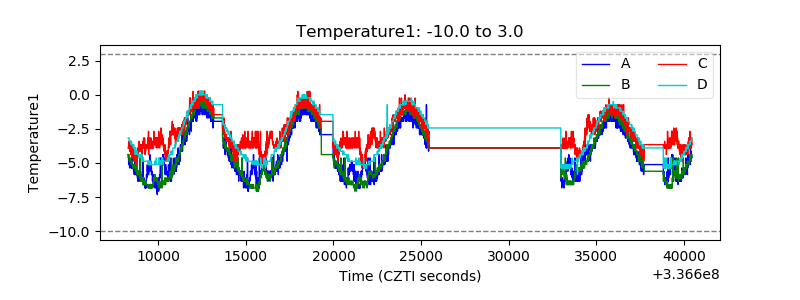 |
| Veto HV Monitor | 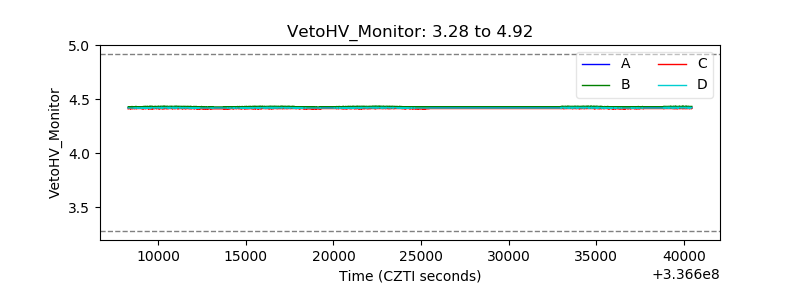 |
| Veto LLD | 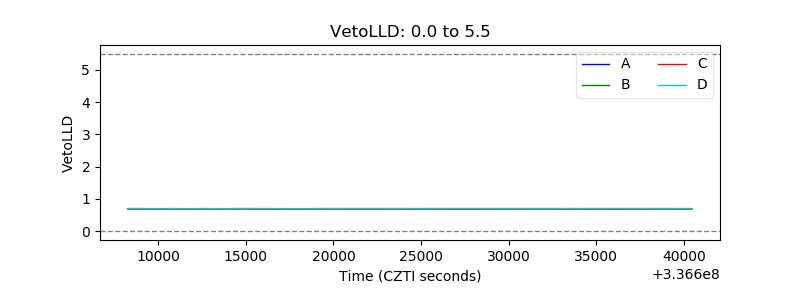 |
| Alpha Counter | 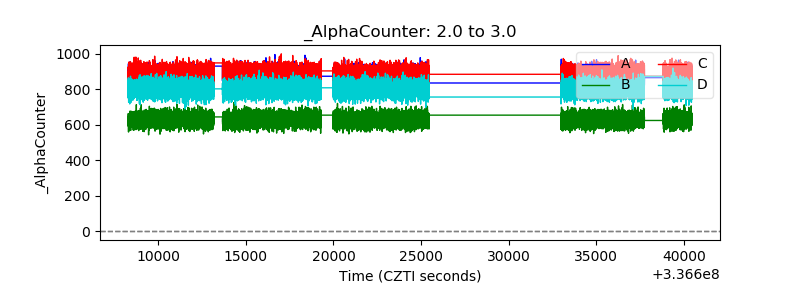 |
| _CPM_Rate | 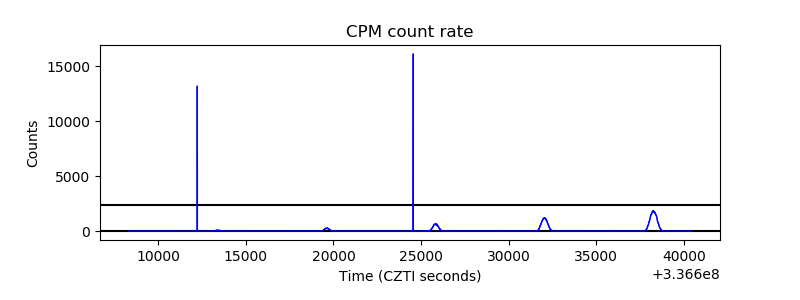 |
| CZT Counter | 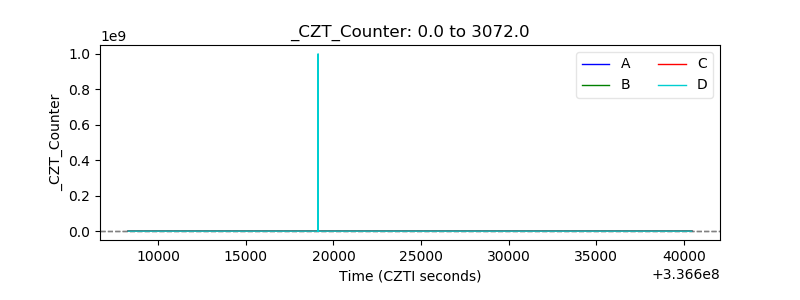 |
| +2.5 Volts monitor | 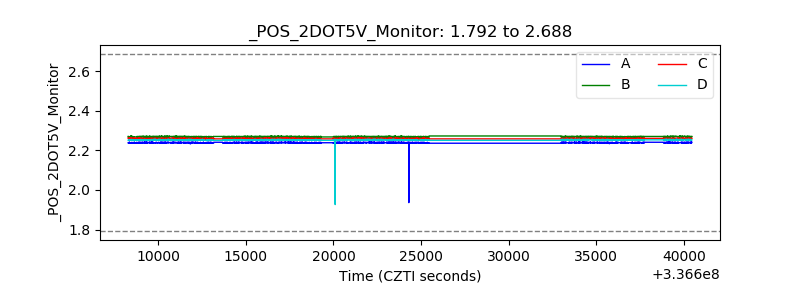 |
| +5 Volts monitor | 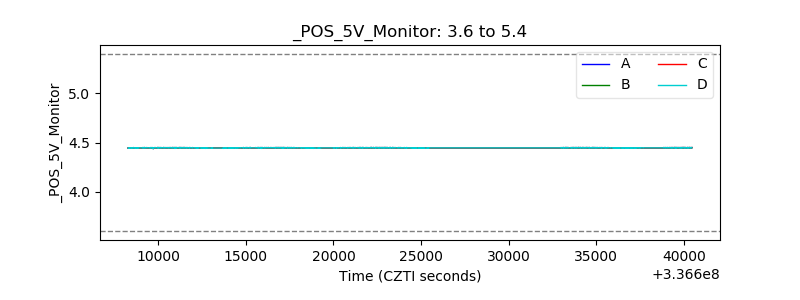 |
| _ROLL_ROT | 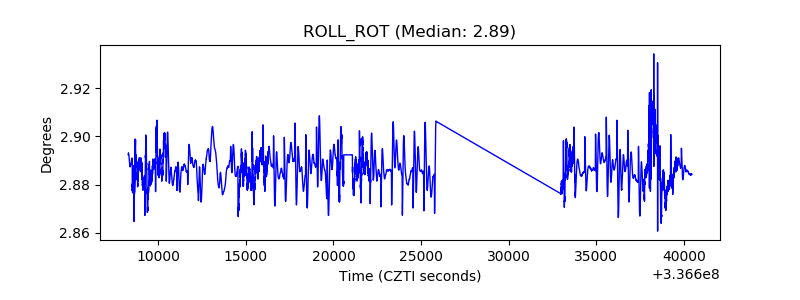 |
| _Roll_DEC | 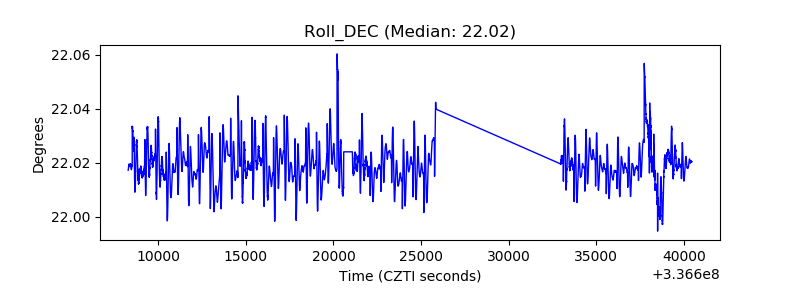 |
| _Roll_RA | 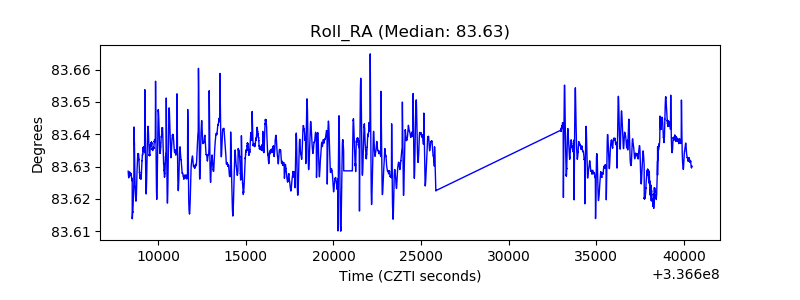 |
| Veto Counter | 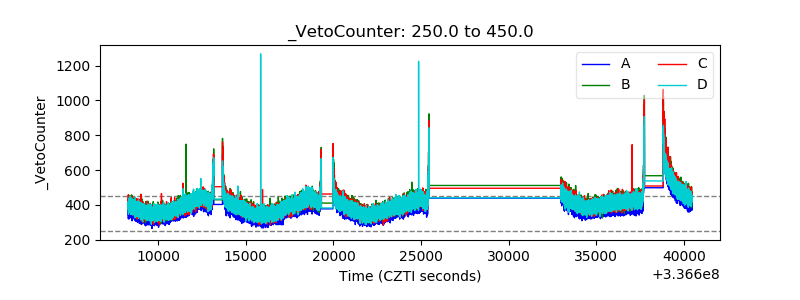 |