| Param | Original file | Final file |
|---|---|---|
| Filename | modeM0/AS1A09_145T01_9000003848_26646cztM0_level2.evt | modeM0/AS1A09_145T01_9000003848_26646cztM0_level2_quad_clean.evt |
| Size (bytes) | 1,350,311,040 | 254,675,520 |
| Size | 1.3 GB | 242.9 MB |
| Events in quadrant A | 8,954,852 | 1,661,467 |
| Events in quadrant B | 9,437,092 | 1,677,628 |
| Events in quadrant C | 9,048,722 | 1,600,969 |
| Events in quadrant D | 12,258,128 | 1,553,534 |
| Mode M0 | |||
|---|---|---|---|
| Quadrant | BADHDUFLAG | Total packets | Discarded packets |
| A | 0 | 37194 | 0 |
| B | 0 | 38724 | 0 |
| C | 0 | 37516 | 0 |
| D | 0 | 48195 | 0 |
| Mode M9 | |||
|---|---|---|---|
| Quadrant | BADHDUFLAG | Total packets | Discarded packets |
| A | 0 | 40 | 0 |
| B | 0 | 40 | 0 |
| C | 0 | 40 | 0 |
| D | 0 | 40 | 0 |
| Quadrant | Total seconds | Saturated seconds | Saturation percentage |
|---|---|---|---|
| A | 17704 | 136 | 0.768188% |
| B | 17705 | 193 | 1.090088% |
| C | 17705 | 261 | 1.474160% |
| D | 17705 | 968 | 5.467382% |
Noise dominated data is calculated using 1-second bins in cleaned event files. If a bin has >2000 counts, and if more than 50% of those come from <1% of pixels, then it is considered to be noise-dominated and hence unusable.
| Quadrant | # 1 sec bins | Bins with >0 counts | Bins with >2000 counts | High rate bins dominated by noise | Noise dominated (total time) | Noise dominated (detector-on time) | Marked lightcurve |
|---|---|---|---|---|---|---|---|
| A | 21709 | 17708 | 4 | 4 | 0.02% | 0.02% |  |
| B | 21710 | 17709 | 5 | 5 | 0.02% | 0.03% |  |
| C | 21710 | 17709 | 13 | 13 | 0.06% | 0.07% |  |
| D | 21710 | 17709 | 676 | 676 | 3.11% | 3.82% | 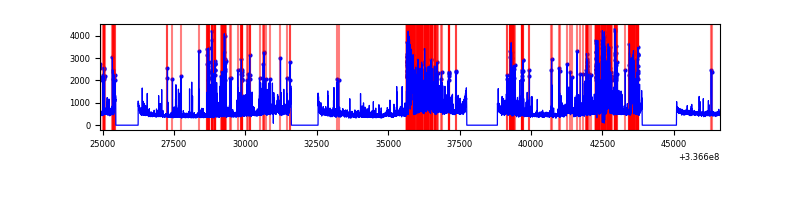 |
Top three noisy pixels from each quadrant. If the there are fewer than three noisy pixels in the level2.evt file, extra rows are filled as -1
| Pixel properties | Quadrant properties | ||||||
|---|---|---|---|---|---|---|---|
| Quadrant | DetID | PixID | Counts | Sigma | Mean | Median | Sigma |
| A | 0 | 13 | 120698 | 259.89 | 2291 | 2252 | 455.8 |
| A | 13 | 254 | 27089 | 54.5 | 2291 | 2252 | 455.8 |
| A | 3 | 137 | 20297 | 39.59 | 2291 | 2252 | 455.8 |
| B | 3 | 112 | 372564 | 870.63 | 2265 | 2219 | 425.4 |
| B | 0 | 190 | 78882 | 180.22 | 2265 | 2219 | 425.4 |
| B | 0 | 219 | 64289 | 145.92 | 2265 | 2219 | 425.4 |
| C | 14 | 238 | 353293 | 694.12 | 2176 | 2199 | 505.8 |
| C | 15 | 208 | 127211 | 247.15 | 2176 | 2199 | 505.8 |
| C | 3 | 233 | 79141 | 152.12 | 2176 | 2199 | 505.8 |
| D | 1 | 52 | 1546982 | 2707.36 | 2141 | 2107 | 570.6 |
| D | 7 | 80 | 1128825 | 1974.55 | 2141 | 2107 | 570.6 |
| D | 12 | 233 | 1116790 | 1953.46 | 2141 | 2107 | 570.6 |
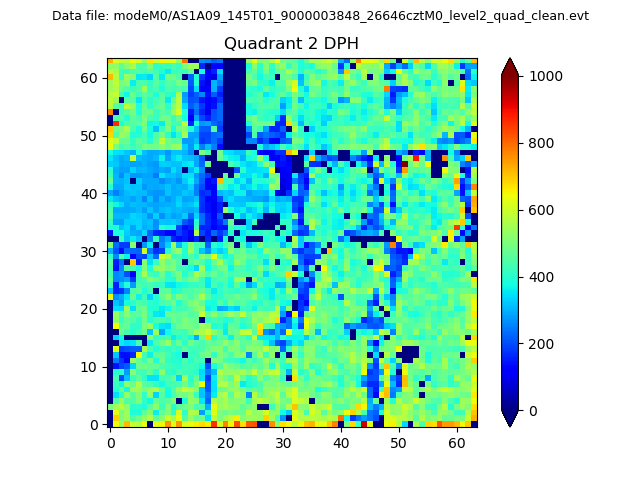
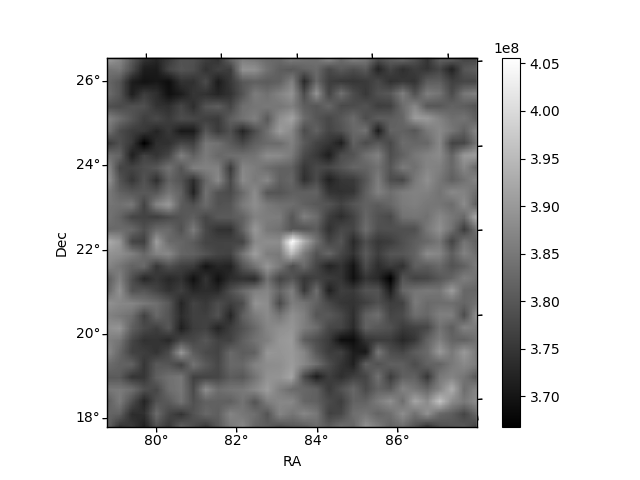
Histogram calculated using DETX and DETY for each event in the final _common_clean file
| Quadrant A | 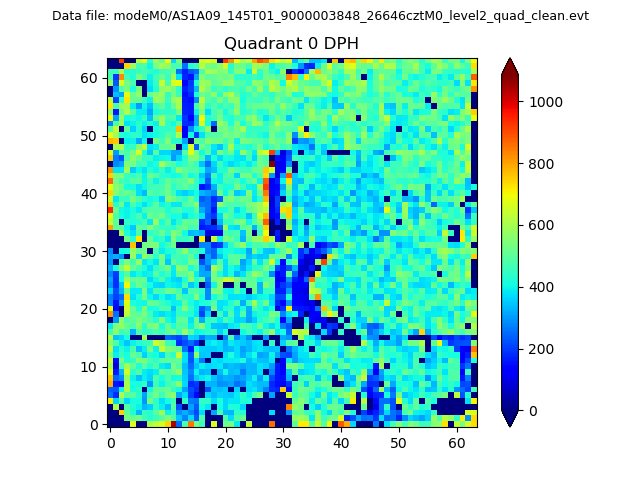 |
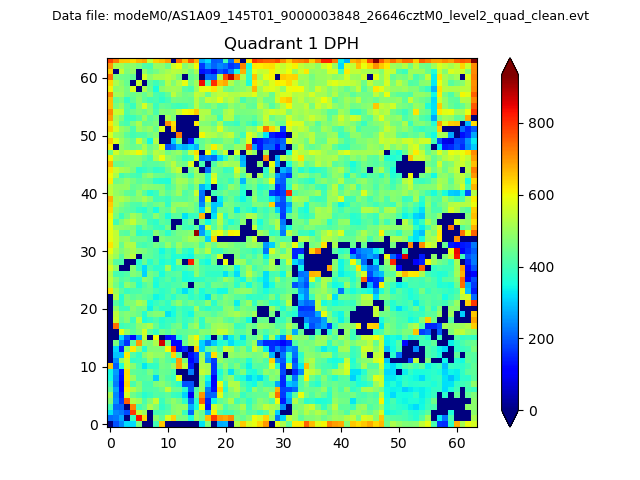 |
Quadrant B |
|---|---|---|---|
| Quadrant D | 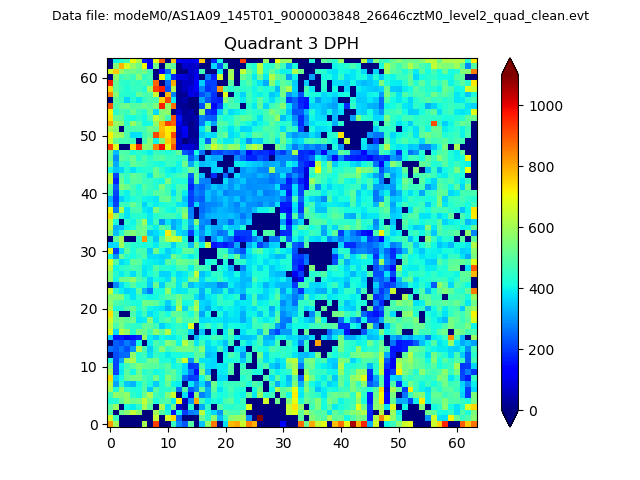 |
 |
Quadrant C |
| Plot type | Count rate plots | Images |
|---|---|---|
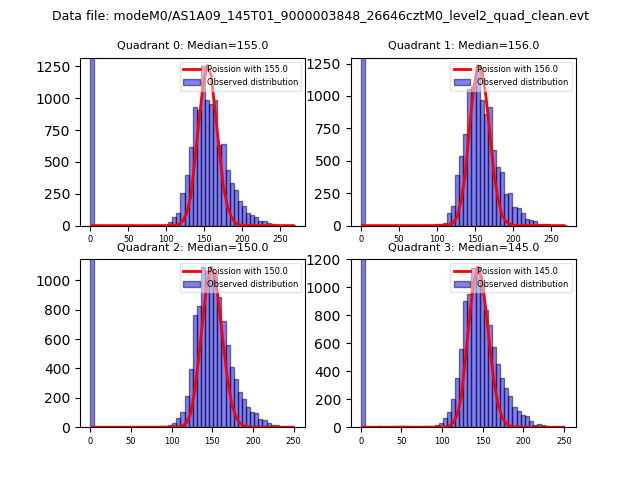
| Comparison with Poisson distribution Blue bars denote a histogram of data divided into 1 sec bins. Red curve is a Poisson curve with rate = median count rate of data. |
 |
 |
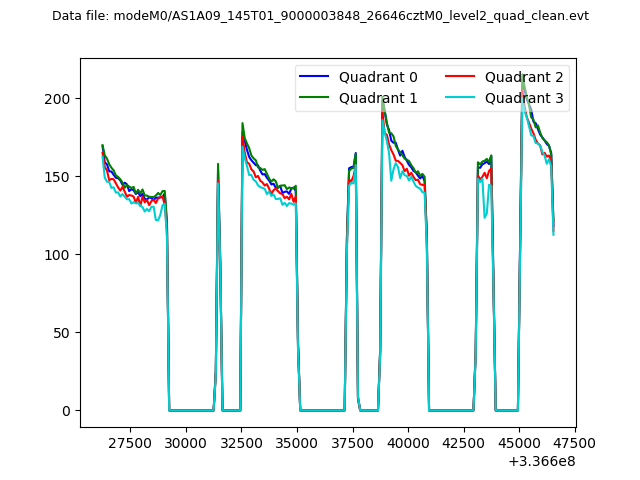
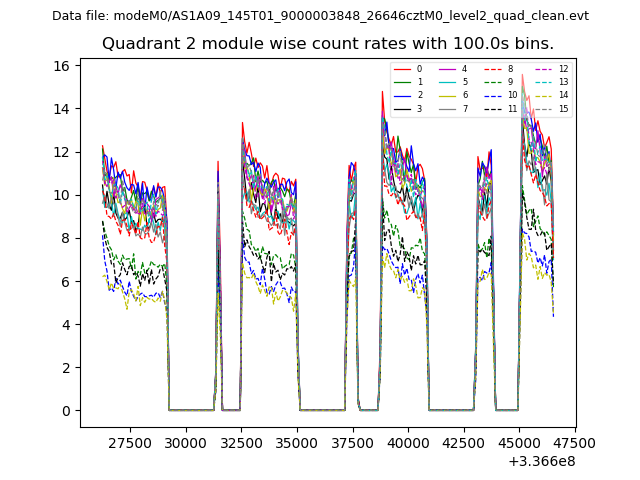
| Quadrant-wise count rates Data is divided into 100 sec bins |
 |
|
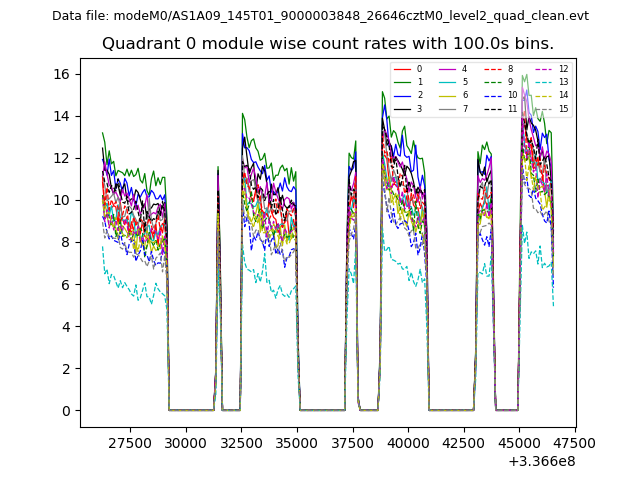
| Module-wise count rates for Quadrant A Data is divided into 100 sec bins |
 |
 |
| Module-wise count rates for Quadrant B Data is divided into 100 sec bins |
 |
 |
| Module-wise count rates for Quadrant C Data is divided into 100 sec bins |
 |
 |
| Module-wise count rates for Quadrant D Data is divided into 100 sec bins |
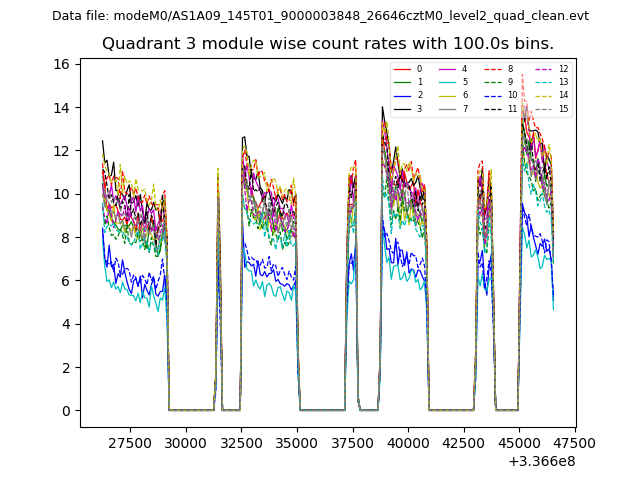 |
 |
| Parameter | Plot |
|---|---|
| CZT HV Monitor | 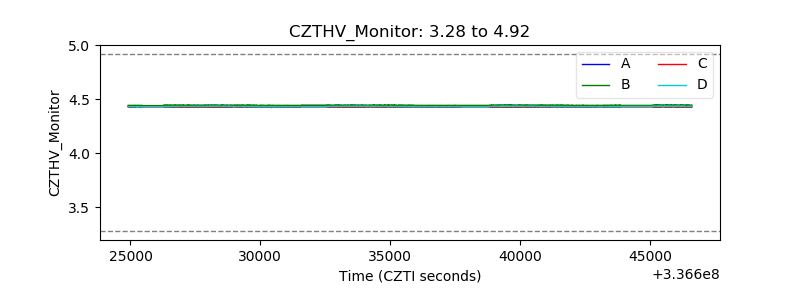 |
| D_VDD | 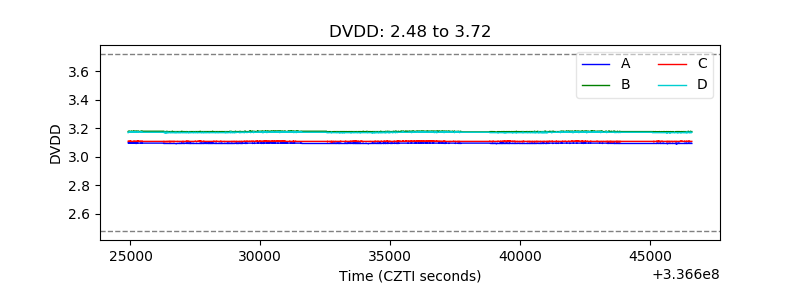 |
| Temperature 1 | 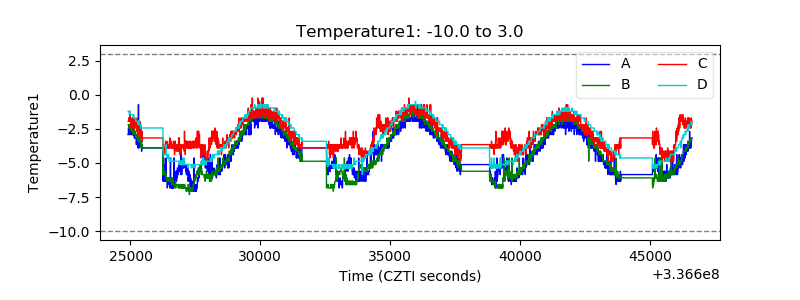 |
| Veto HV Monitor | 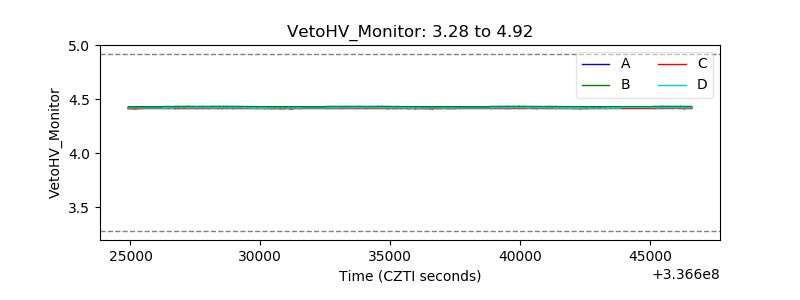 |
| Veto LLD | 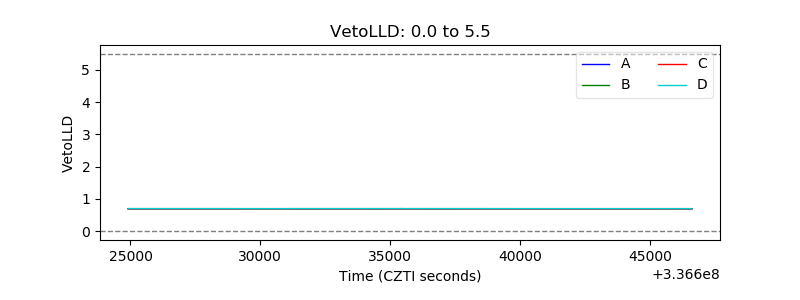 |
| Alpha Counter | 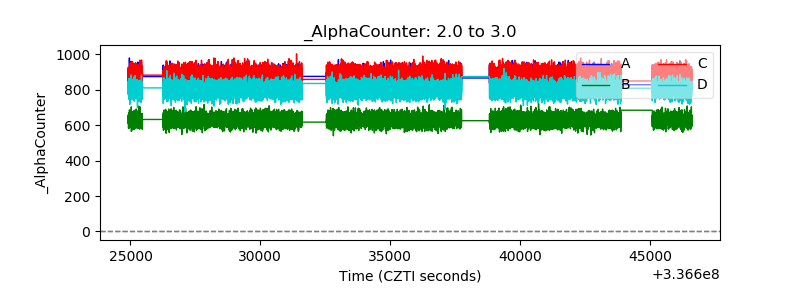 |
| _CPM_Rate | 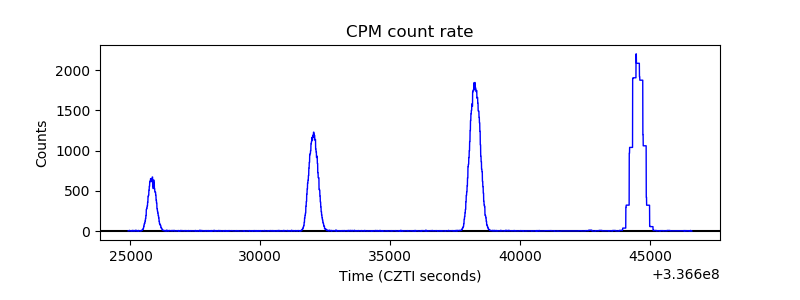 |
| CZT Counter | 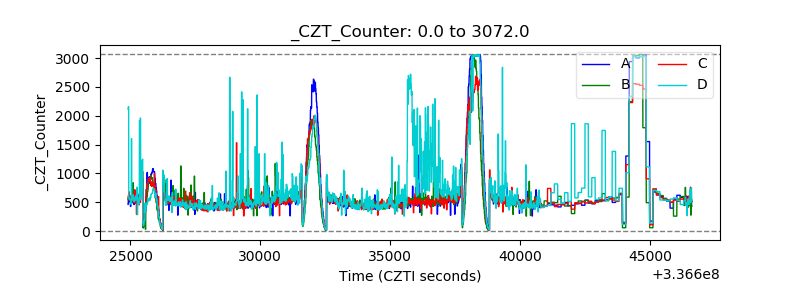 |
| +2.5 Volts monitor | 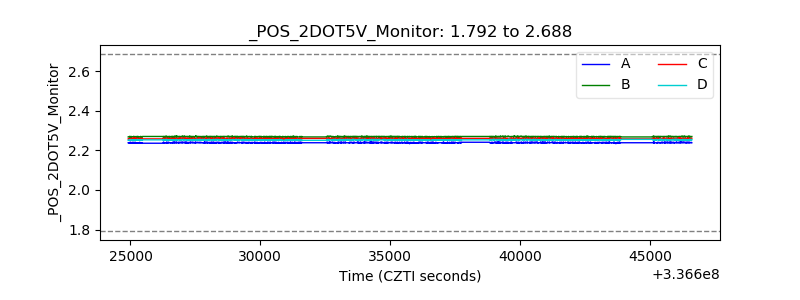 |
| +5 Volts monitor |  |
| _ROLL_ROT |  |
| _Roll_DEC | 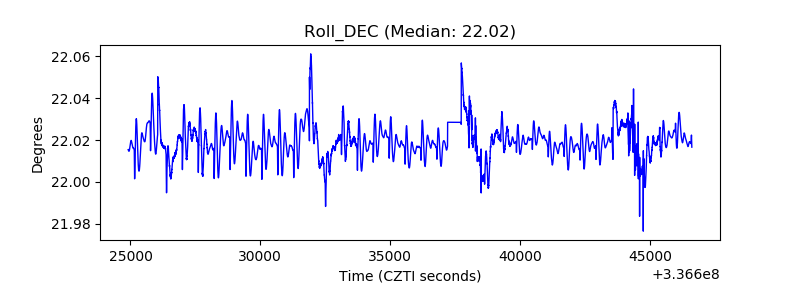 |
| _Roll_RA | 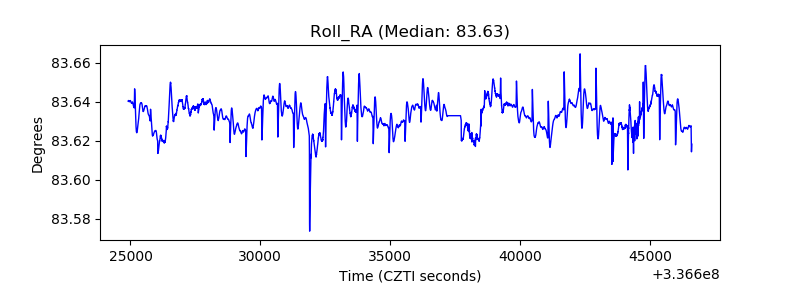 |
| Veto Counter | 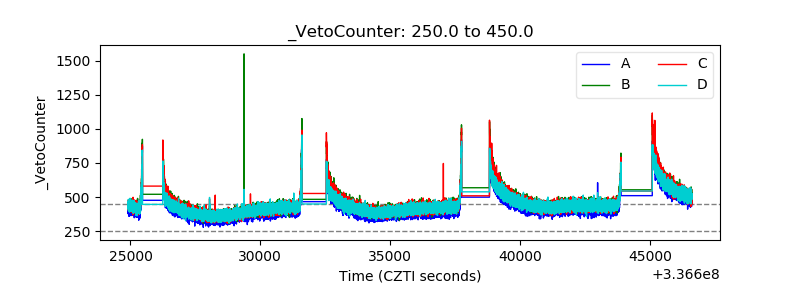 |