| Param | Original file | Final file |
|---|---|---|
| Filename | modeM0/AS1A09_145T01_9000003848_26647cztM0_level2.evt | modeM0/AS1A09_145T01_9000003848_26647cztM0_level2_quad_clean.evt |
| Size (bytes) | 480,784,320 | 81,449,280 |
| Size | 458.5 MB | 77.7 MB |
| Events in quadrant A | 3,009,914 | 563,429 |
| Events in quadrant B | 3,047,498 | 567,323 |
| Events in quadrant C | 2,929,898 | 535,784 |
| Events in quadrant D | 5,205,063 | 419,982 |
| Mode M0 | |||
|---|---|---|---|
| Quadrant | BADHDUFLAG | Total packets | Discarded packets |
| A | 0 | 12079 | 0 |
| B | 0 | 12223 | 0 |
| C | 0 | 11815 | 0 |
| D | 0 | 18756 | 0 |
| Mode M9 | |||
|---|---|---|---|
| Quadrant | BADHDUFLAG | Total packets | Discarded packets |
| A | 0 | 13 | 0 |
| B | 0 | 13 | 0 |
| C | 0 | 13 | 0 |
| D | 0 | 13 | 0 |
| Quadrant | Total seconds | Saturated seconds | Saturation percentage |
|---|---|---|---|
| A | 5424 | 51 | 0.940265% |
| B | 5424 | 55 | 1.014012% |
| C | 5424 | 69 | 1.272124% |
| D | 5424 | 976 | 17.994100% |
Noise dominated data is calculated using 1-second bins in cleaned event files. If a bin has >2000 counts, and if more than 50% of those come from <1% of pixels, then it is considered to be noise-dominated and hence unusable.
| Quadrant | # 1 sec bins | Bins with >0 counts | Bins with >2000 counts | High rate bins dominated by noise | Noise dominated (total time) | Noise dominated (detector-on time) | Marked lightcurve |
|---|---|---|---|---|---|---|---|
| A | 6699 | 5425 | 5 | 5 | 0.07% | 0.09% | 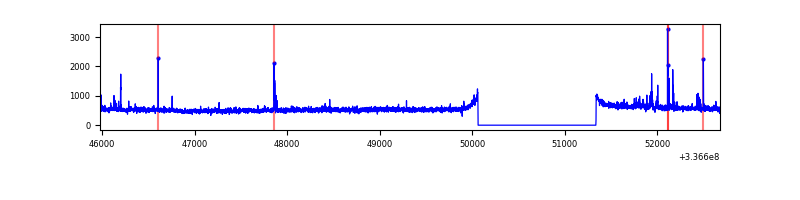 |
| B | 6699 | 5425 | 0 | 0 | 0.00% | 0.00% | 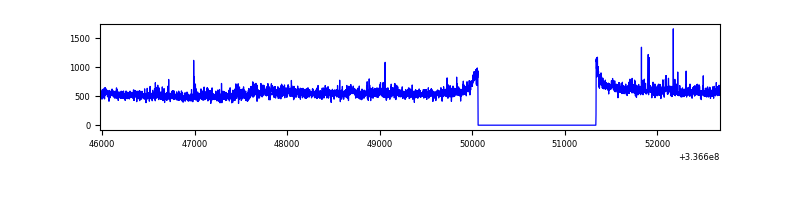 |
| C | 6699 | 5425 | 5 | 5 | 0.07% | 0.09% | 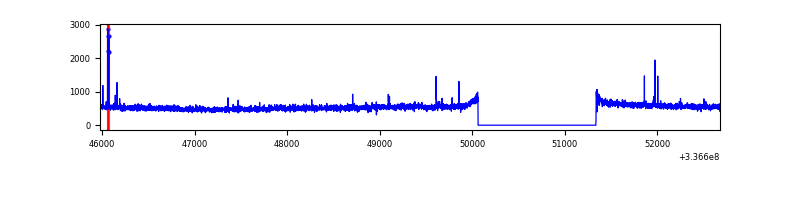 |
| D | 6699 | 5424 | 877 | 877 | 13.09% | 16.17% | 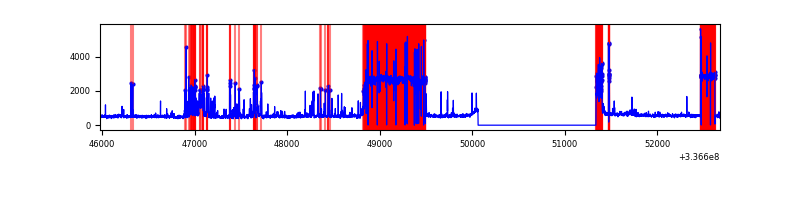 |
Top three noisy pixels from each quadrant. If the there are fewer than three noisy pixels in the level2.evt file, extra rows are filled as -1
| Pixel properties | Quadrant properties | ||||||
|---|---|---|---|---|---|---|---|
| Quadrant | DetID | PixID | Counts | Sigma | Mean | Median | Sigma |
| A | 0 | 13 | 88976 | 585.53 | 756 | 745 | 150.7 |
| A | 13 | 254 | 8293 | 50.09 | 756 | 745 | 150.7 |
| A | 0 | 226 | 6593 | 38.81 | 756 | 745 | 150.7 |
| B | 3 | 112 | 64030 | 452.42 | 740 | 725 | 139.9 |
| B | 0 | 219 | 42729 | 300.19 | 740 | 725 | 139.9 |
| B | 0 | 189 | 31440 | 219.51 | 740 | 725 | 139.9 |
| C | 14 | 238 | 117824 | 708.13 | 709 | 717 | 165.4 |
| C | 15 | 208 | 35256 | 208.85 | 709 | 717 | 165.4 |
| C | 1 | 0 | 6688 | 36.11 | 709 | 717 | 165.4 |
| D | 7 | 80 | 2339361 | 14174.98 | 615 | 604 | 165.0 |
| D | 12 | 233 | 241300 | 1458.83 | 615 | 604 | 165.0 |
| D | 1 | 52 | 227506 | 1375.23 | 615 | 604 | 165.0 |
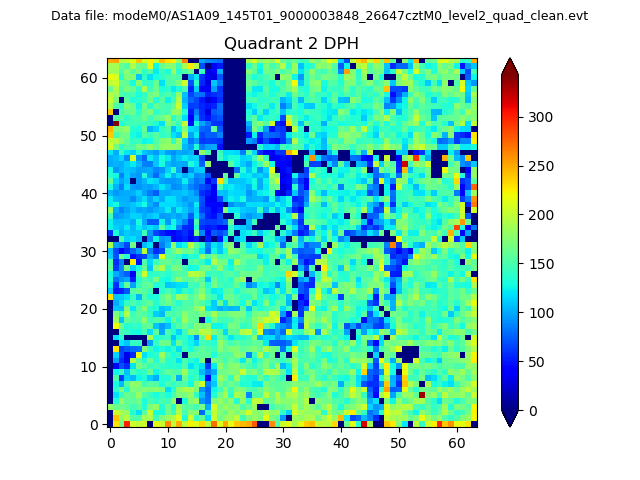
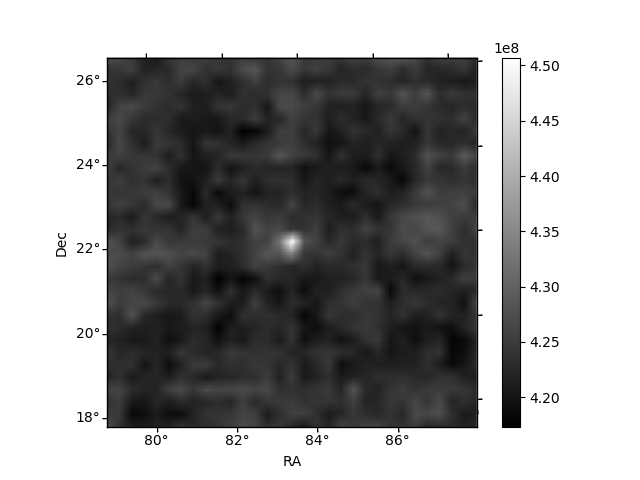
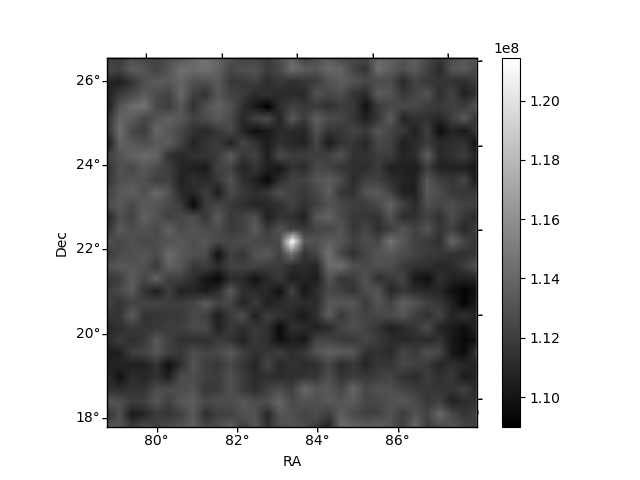
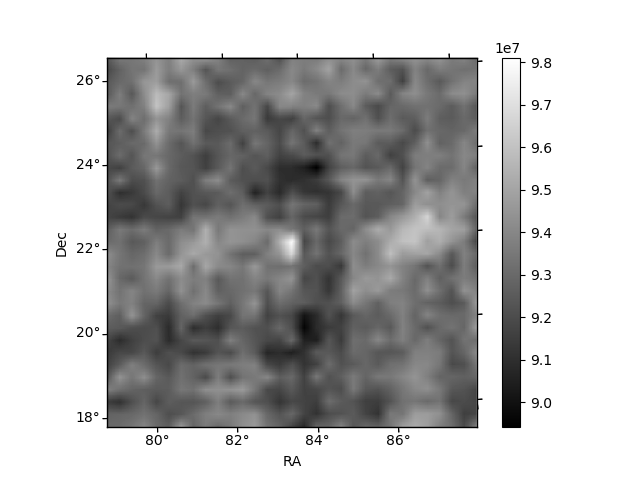
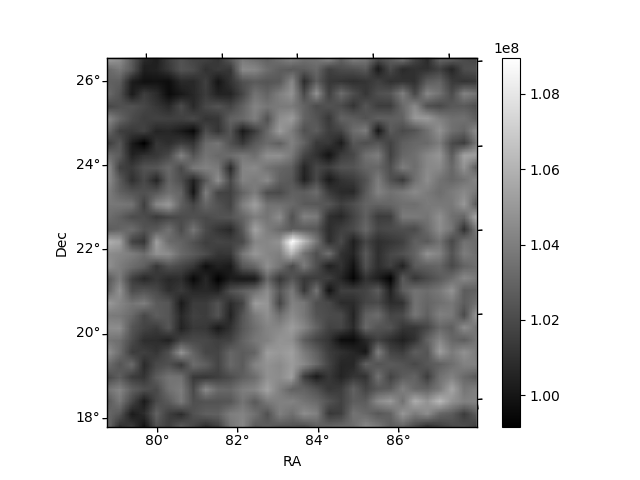
Histogram calculated using DETX and DETY for each event in the final _common_clean file
| Quadrant A | 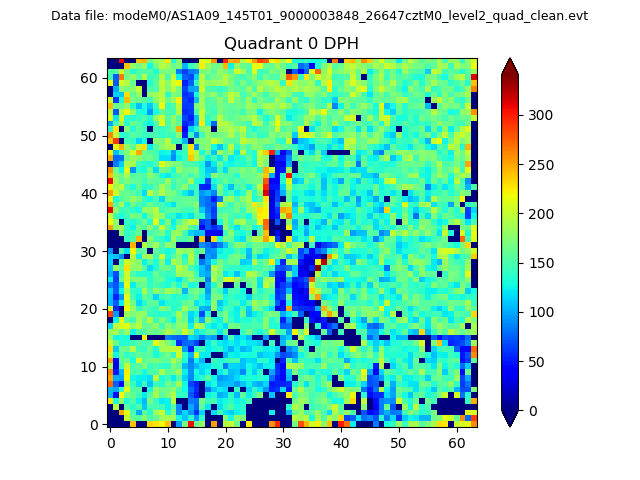 |
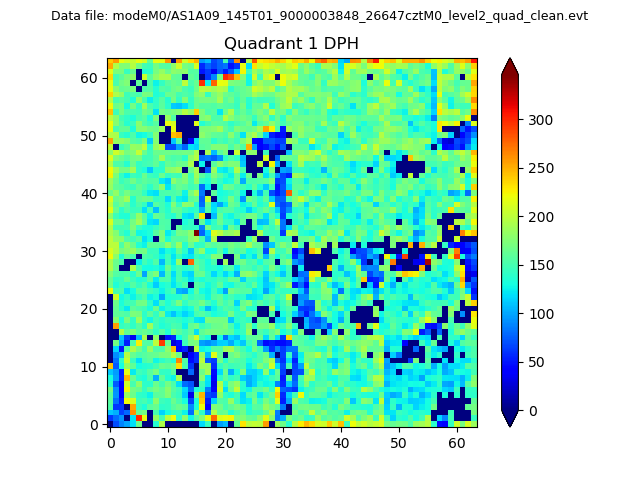 |
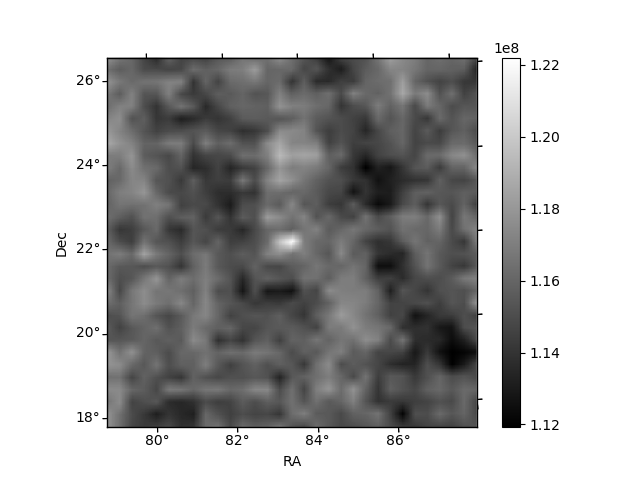
Quadrant B |
|---|---|---|---|
| Quadrant D | 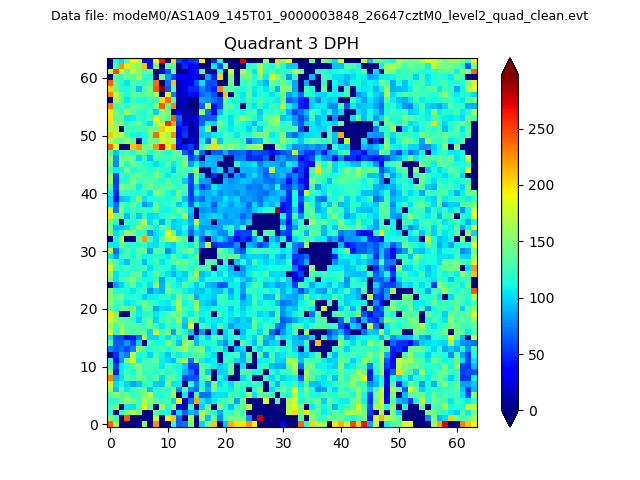 |
 |
Quadrant C |
| Plot type | Count rate plots | Images |
|---|---|---|
| Comparison with Poisson distribution Blue bars denote a histogram of data divided into 1 sec bins. Red curve is a Poisson curve with rate = median count rate of data. |
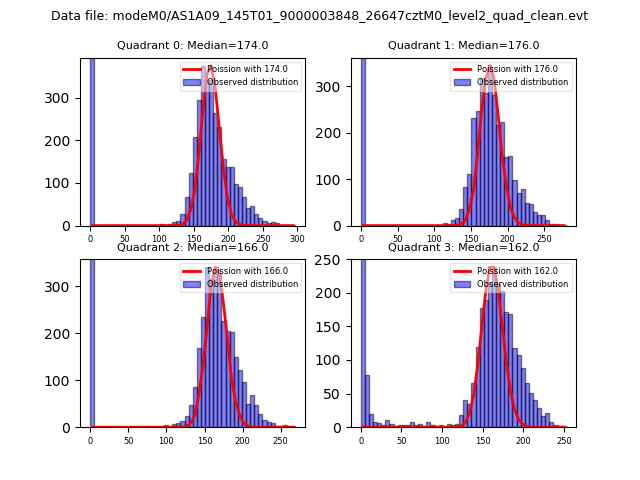 |
 |
| Quadrant-wise count rates Data is divided into 100 sec bins |
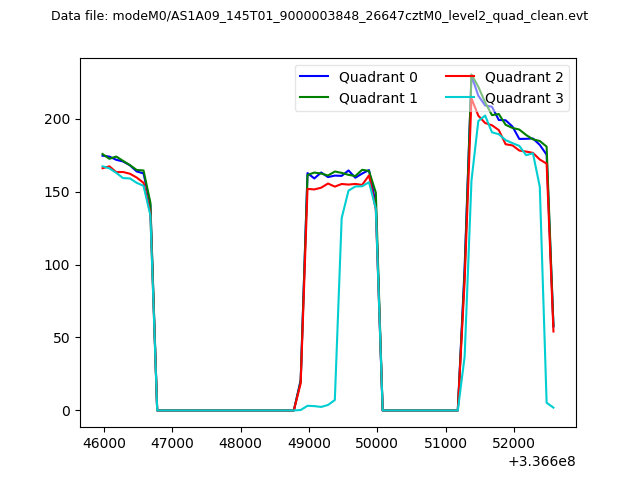 |
|
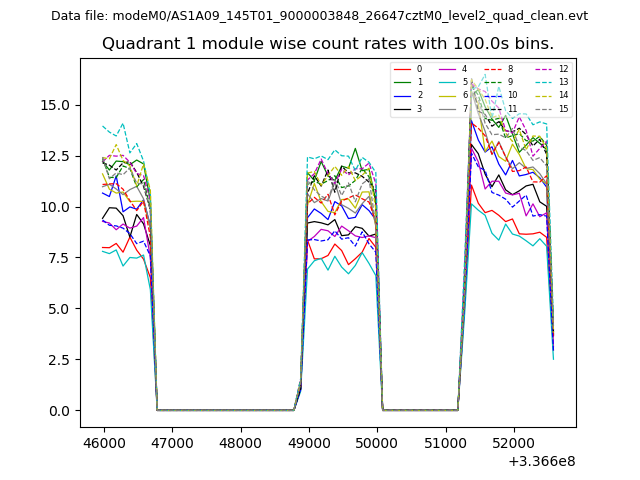
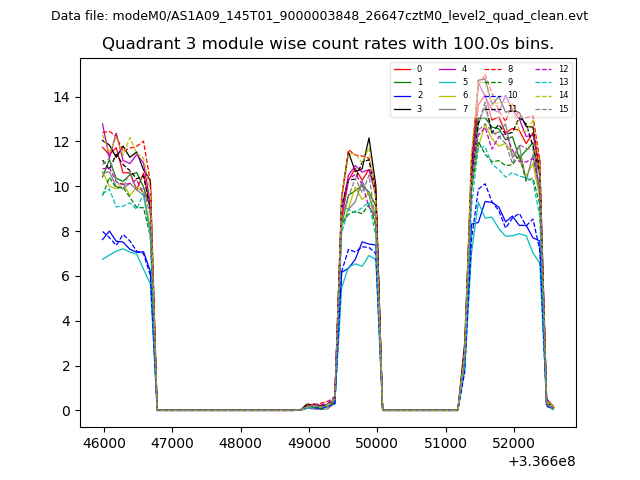
| Module-wise count rates for Quadrant A Data is divided into 100 sec bins |
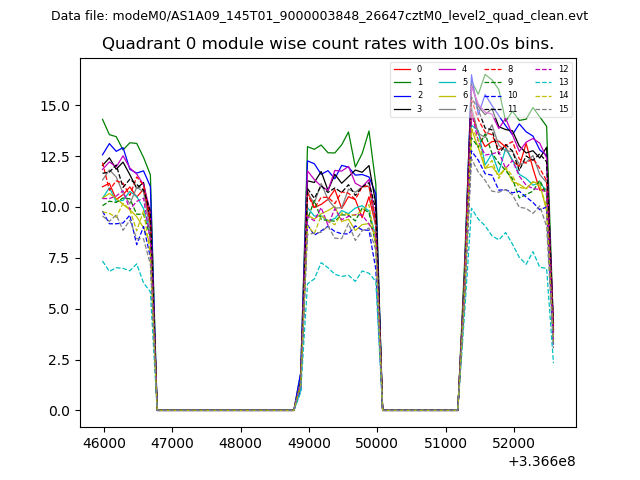 |
 |
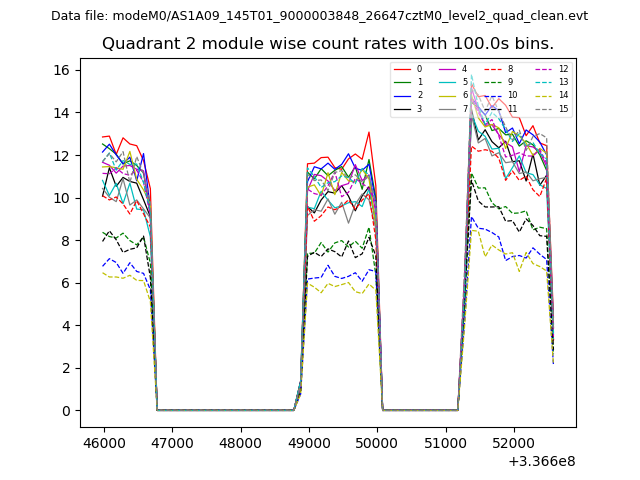
| Module-wise count rates for Quadrant B Data is divided into 100 sec bins |
 |
 |
| Module-wise count rates for Quadrant C Data is divided into 100 sec bins |
 |
 |
| Module-wise count rates for Quadrant D Data is divided into 100 sec bins |
 |
 |
| Parameter | Plot |
|---|---|
| CZT HV Monitor | 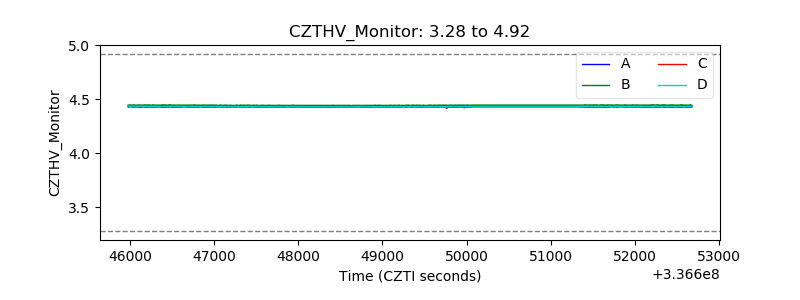 |
| D_VDD | 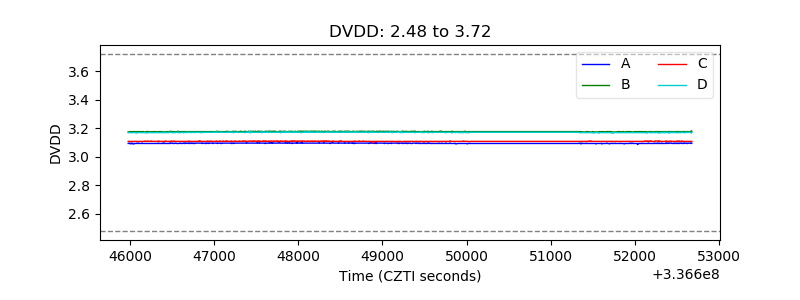 |
| Temperature 1 | 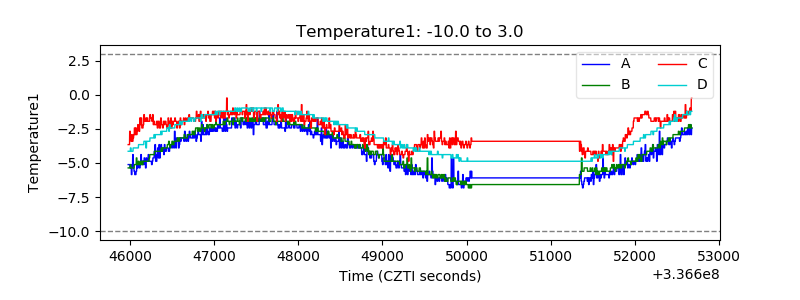 |
| Veto HV Monitor | 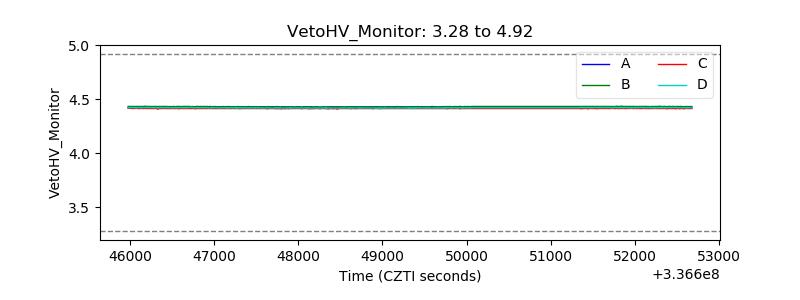 |
| Veto LLD | 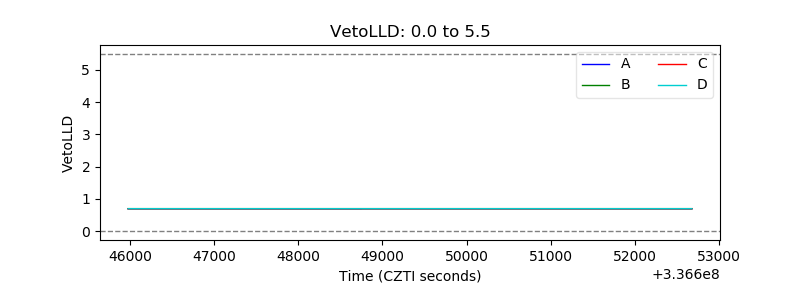 |
| Alpha Counter | 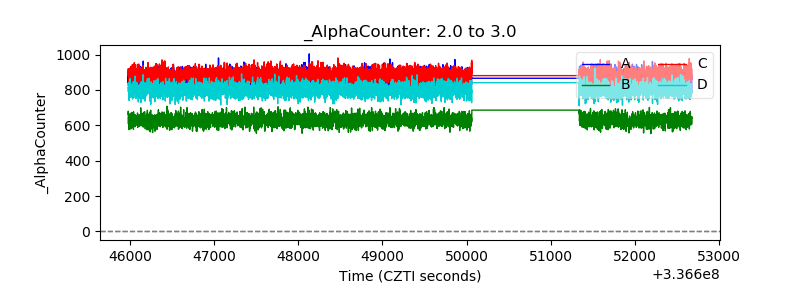 |
| _CPM_Rate | 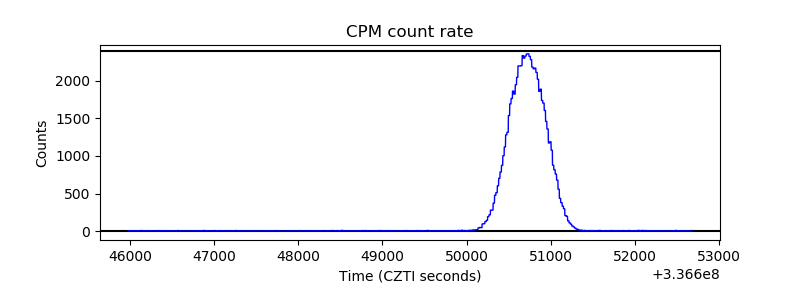 |
| CZT Counter | 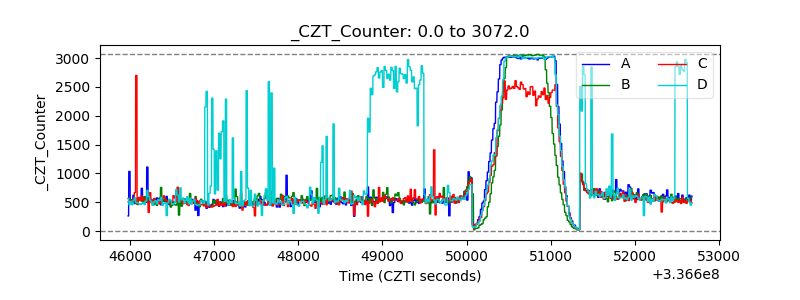 |
| +2.5 Volts monitor |  |
| +5 Volts monitor |  |
| _ROLL_ROT | 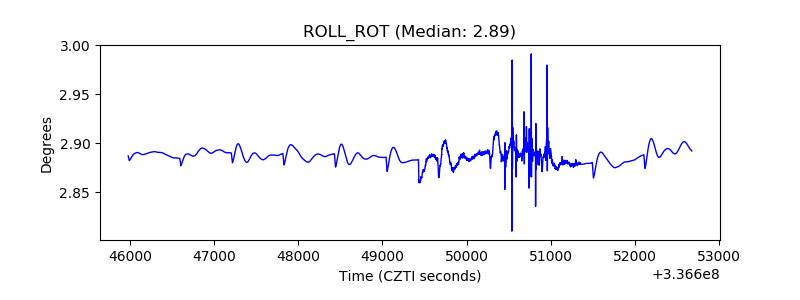 |
| _Roll_DEC | 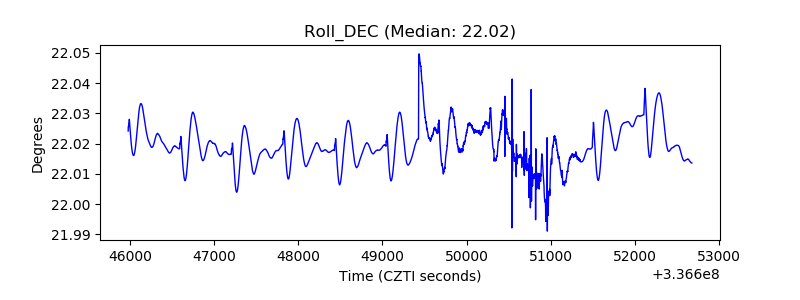 |
| _Roll_RA | 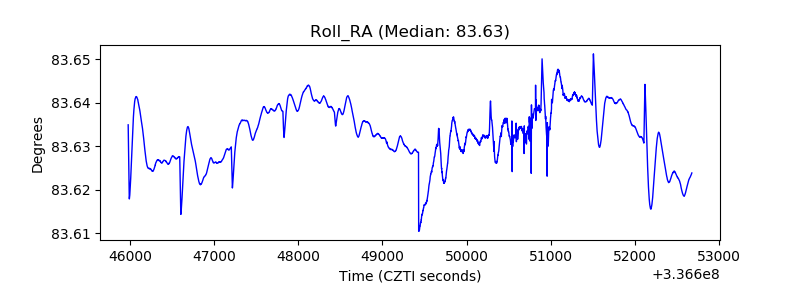 |
| Veto Counter |  |