| Param | Original file | Final file |
|---|---|---|
| Filename | modeM0/AS1A09_145T01_9000003848_26648cztM0_level2.evt | modeM0/AS1A09_145T01_9000003848_26648cztM0_level2_quad_clean.evt |
| Size (bytes) | 483,598,080 | 76,129,920 |
| Size | 461.2 MB | 72.6 MB |
| Events in quadrant A | 3,169,740 | 510,711 |
| Events in quadrant B | 3,187,490 | 511,924 |
| Events in quadrant C | 3,092,809 | 486,219 |
| Events in quadrant D | 4,821,342 | 410,144 |
| Mode M0 | |||
|---|---|---|---|
| Quadrant | BADHDUFLAG | Total packets | Discarded packets |
| A | 0 | 12722 | 0 |
| B | 0 | 12728 | 0 |
| C | 0 | 12357 | 0 |
| D | 0 | 17673 | 0 |
| Mode M9 | |||
|---|---|---|---|
| Quadrant | BADHDUFLAG | Total packets | Discarded packets |
| A | 0 | 13 | 0 |
| B | 0 | 13 | 0 |
| C | 0 | 13 | 0 |
| D | 0 | 13 | 0 |
| Quadrant | Total seconds | Saturated seconds | Saturation percentage |
|---|---|---|---|
| A | 5519 | 91 | 1.648849% |
| B | 5520 | 103 | 1.865942% |
| C | 5519 | 98 | 1.775684% |
| D | 5519 | 727 | 13.172676% |
Noise dominated data is calculated using 1-second bins in cleaned event files. If a bin has >2000 counts, and if more than 50% of those come from <1% of pixels, then it is considered to be noise-dominated and hence unusable.
| Quadrant | # 1 sec bins | Bins with >0 counts | Bins with >2000 counts | High rate bins dominated by noise | Noise dominated (total time) | Noise dominated (detector-on time) | Marked lightcurve |
|---|---|---|---|---|---|---|---|
| A | 6815 | 5521 | 4 | 4 | 0.06% | 0.07% | 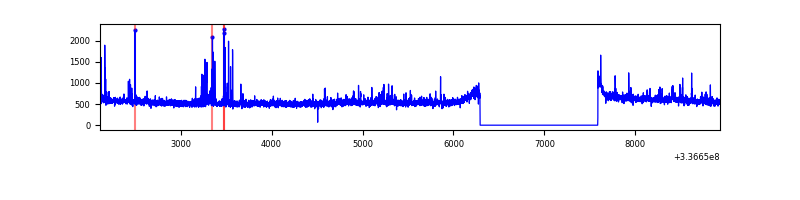 |
| B | 6816 | 5522 | 13 | 13 | 0.19% | 0.24% | 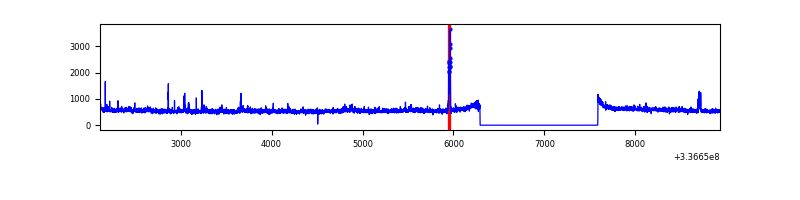 |
| C | 6815 | 5521 | 5 | 5 | 0.07% | 0.09% | 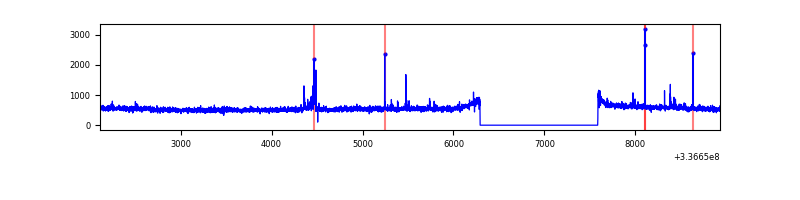 |
| D | 6815 | 5521 | 626 | 626 | 9.19% | 11.34% | 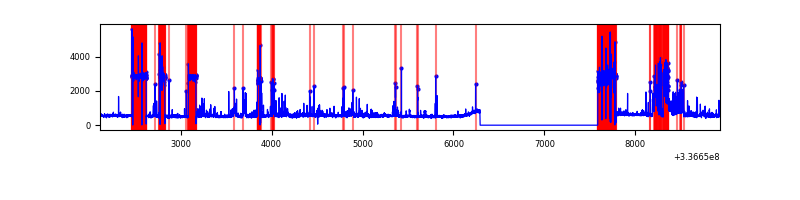 |
Top three noisy pixels from each quadrant. If the there are fewer than three noisy pixels in the level2.evt file, extra rows are filled as -1
| Pixel properties | Quadrant properties | ||||||
|---|---|---|---|---|---|---|---|
| Quadrant | DetID | PixID | Counts | Sigma | Mean | Median | Sigma |
| A | 0 | 13 | 142572 | 911.73 | 785 | 774 | 155.5 |
| A | 13 | 254 | 8588 | 50.24 | 785 | 774 | 155.5 |
| A | 0 | 226 | 6851 | 39.07 | 785 | 774 | 155.5 |
| B | 3 | 112 | 72271 | 498.29 | 767 | 752 | 143.5 |
| B | 10 | 245 | 53663 | 368.64 | 767 | 752 | 143.5 |
| B | 0 | 219 | 35243 | 240.31 | 767 | 752 | 143.5 |
| C | 14 | 238 | 120829 | 703.09 | 738 | 748 | 170.8 |
| C | 15 | 208 | 39692 | 228.02 | 738 | 748 | 170.8 |
| C | 2 | 16 | 38455 | 220.78 | 738 | 748 | 170.8 |
| D | 7 | 80 | 1794799 | 9970.4 | 674 | 663 | 179.9 |
| D | 1 | 52 | 206142 | 1141.89 | 674 | 663 | 179.9 |
| D | 2 | 250 | 179691 | 994.9 | 674 | 663 | 179.9 |
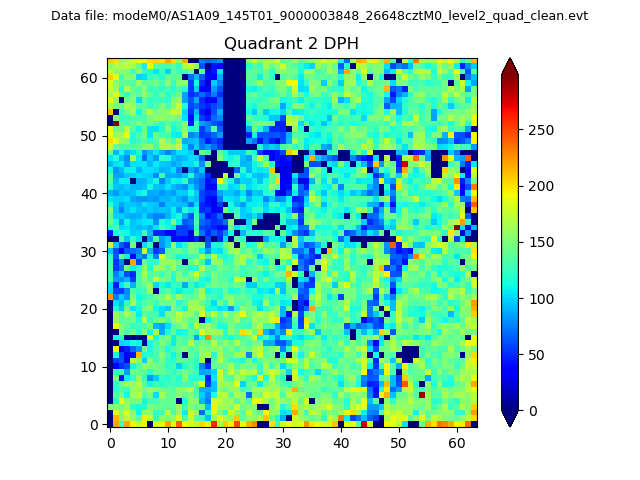
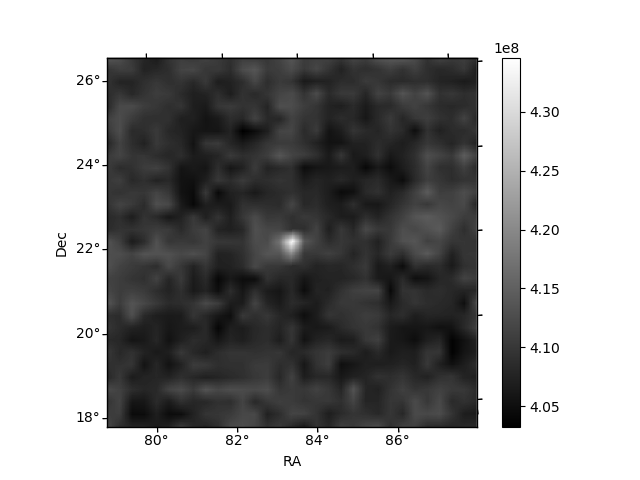
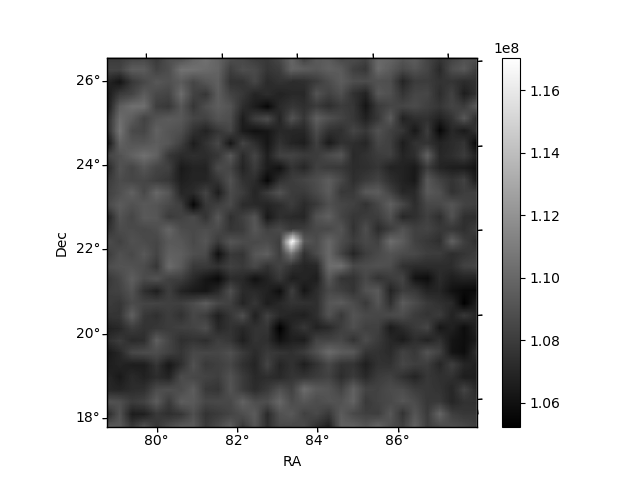
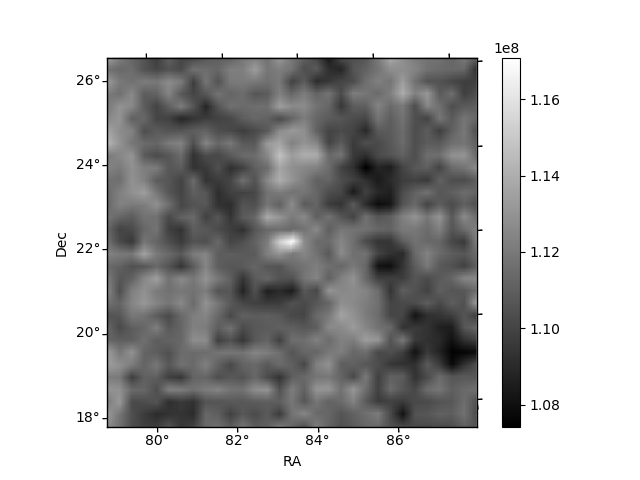
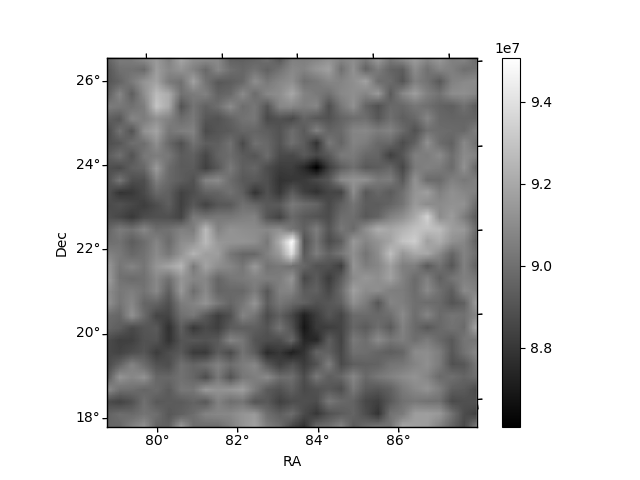
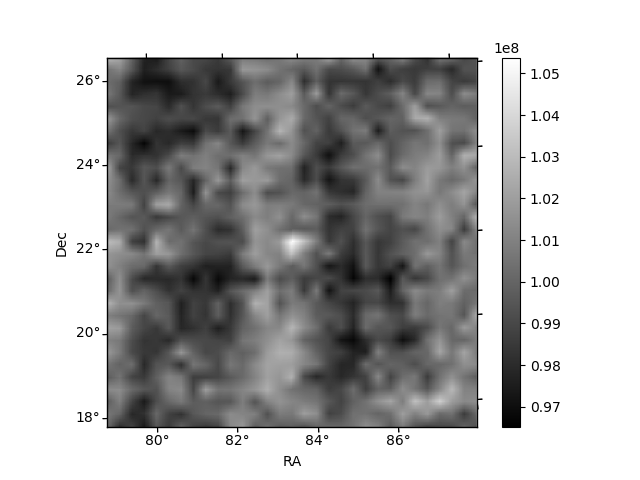
Histogram calculated using DETX and DETY for each event in the final _common_clean file
| Quadrant A | 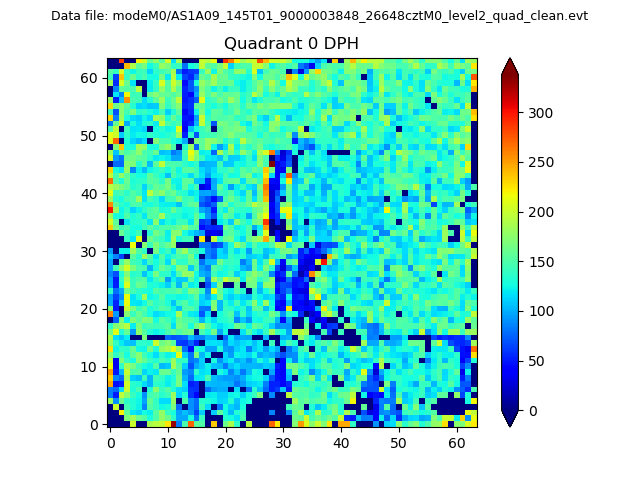 |
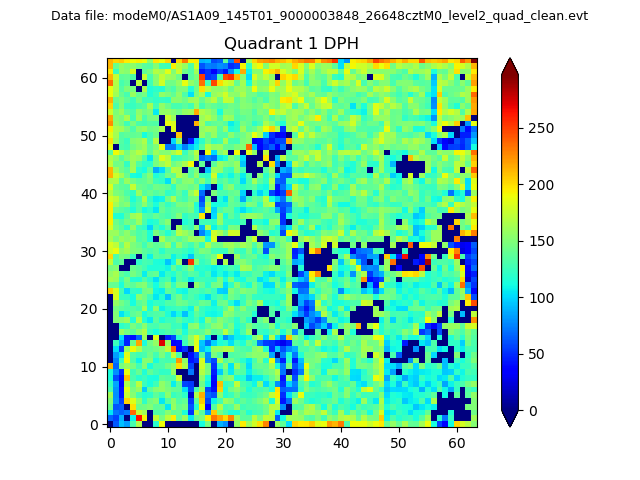 |
Quadrant B |
|---|---|---|---|
| Quadrant D | 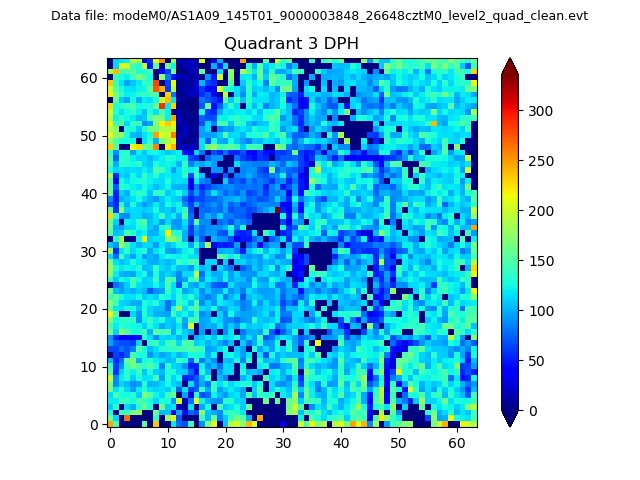 |
 |
Quadrant C |
| Plot type | Count rate plots | Images |
|---|---|---|
| Comparison with Poisson distribution Blue bars denote a histogram of data divided into 1 sec bins. Red curve is a Poisson curve with rate = median count rate of data. |
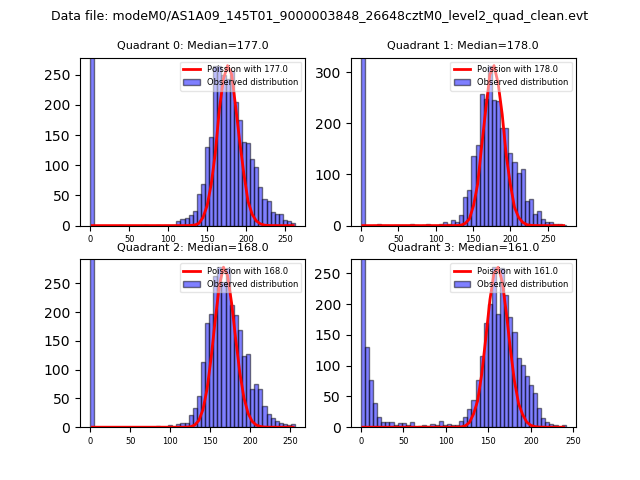 |
 |
| Quadrant-wise count rates Data is divided into 100 sec bins |
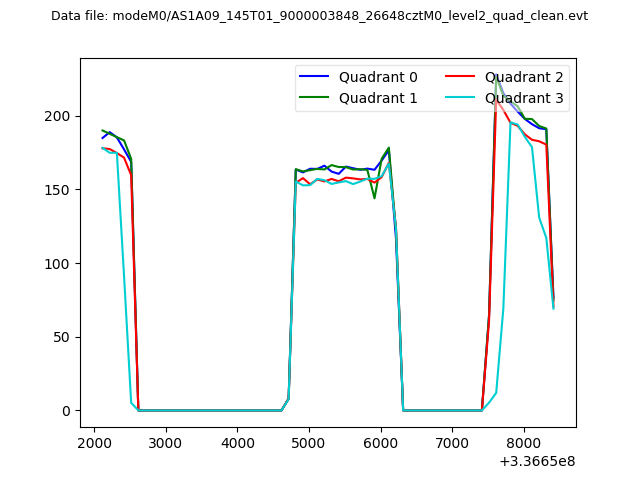 |
|
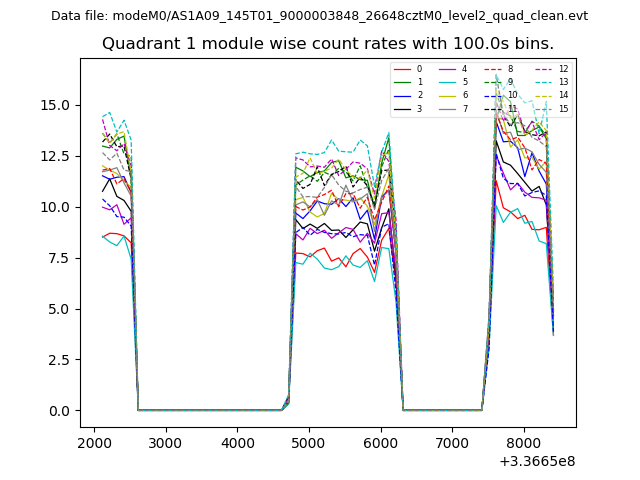
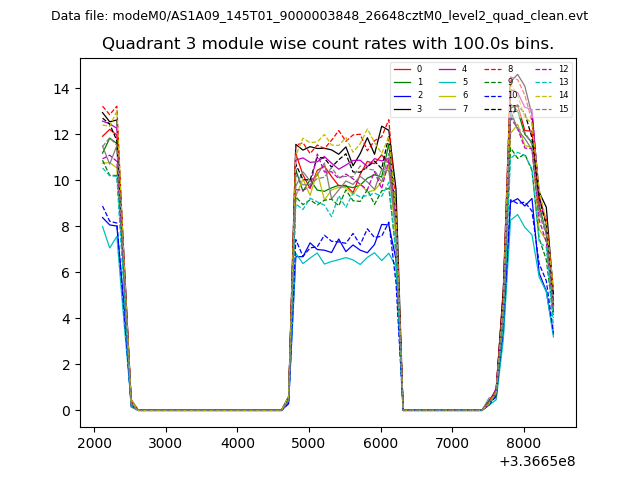
| Module-wise count rates for Quadrant A Data is divided into 100 sec bins |
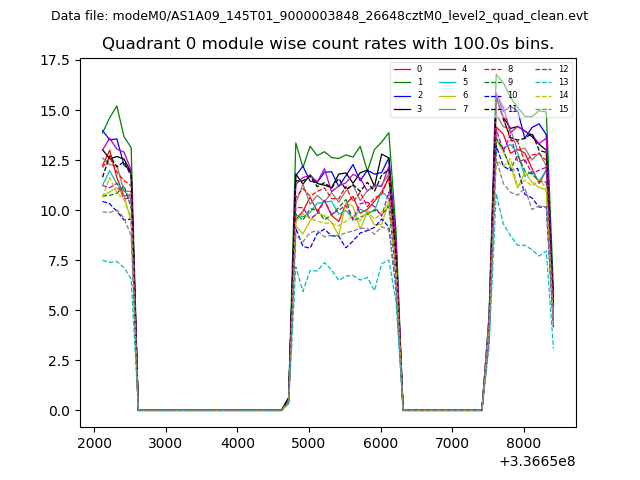 |
 |
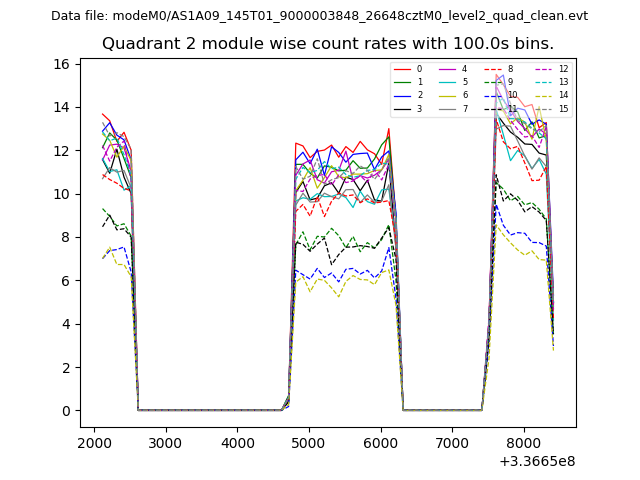
| Module-wise count rates for Quadrant B Data is divided into 100 sec bins |
 |
 |
| Module-wise count rates for Quadrant C Data is divided into 100 sec bins |
 |
 |
| Module-wise count rates for Quadrant D Data is divided into 100 sec bins |
 |
 |
| Parameter | Plot |
|---|---|
| CZT HV Monitor | 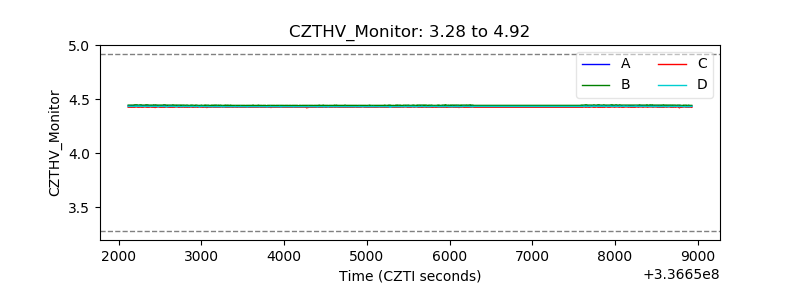 |
| D_VDD | 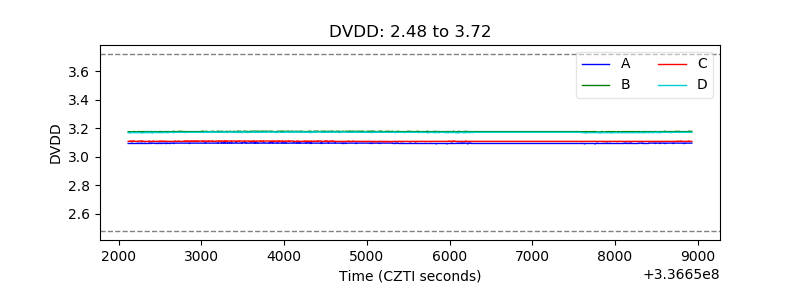 |
| Temperature 1 | 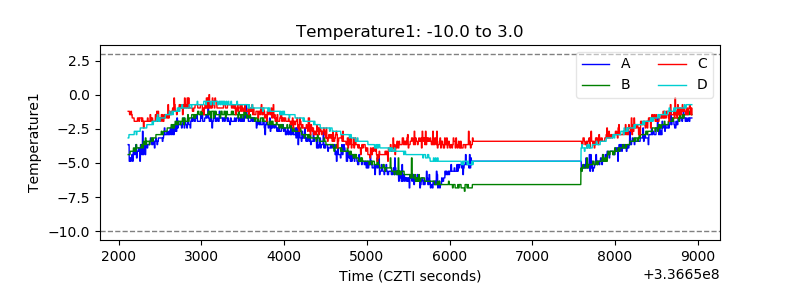 |
| Veto HV Monitor | 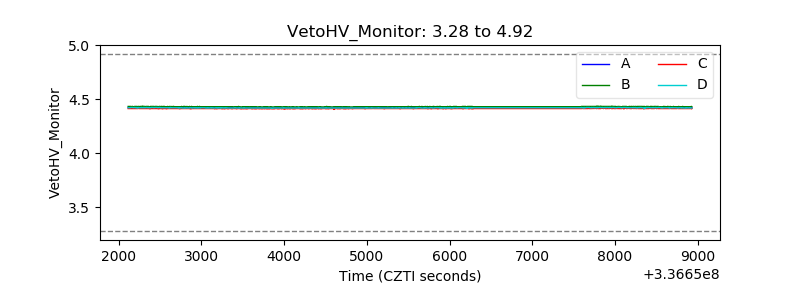 |
| Veto LLD | 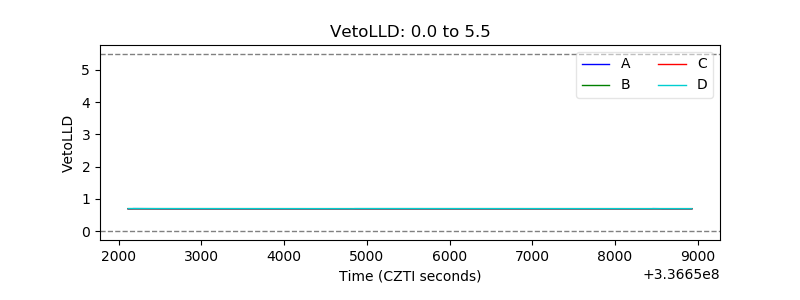 |
| Alpha Counter | 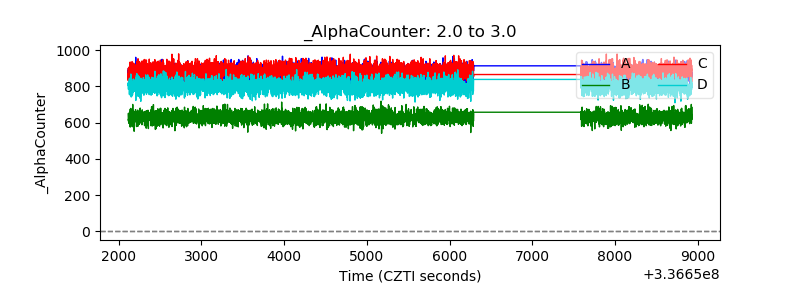 |
| _CPM_Rate | 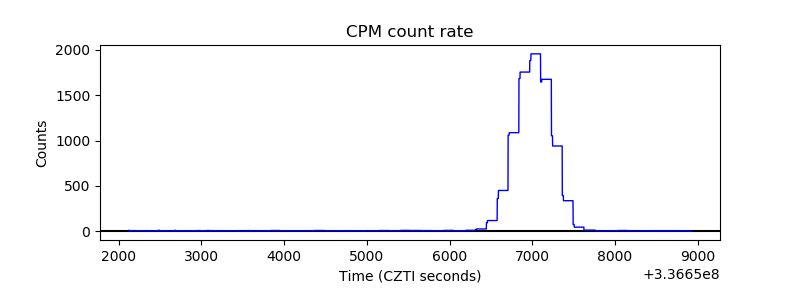 |
| CZT Counter | 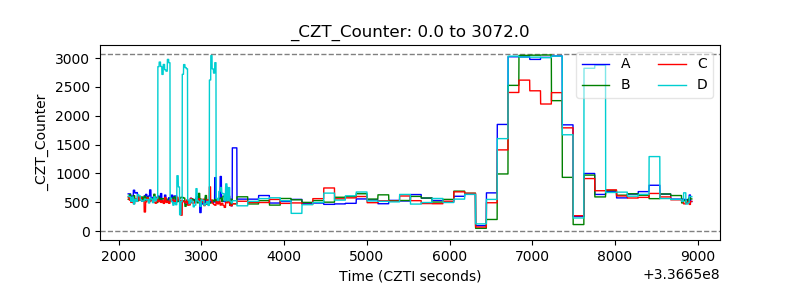 |
| +2.5 Volts monitor | 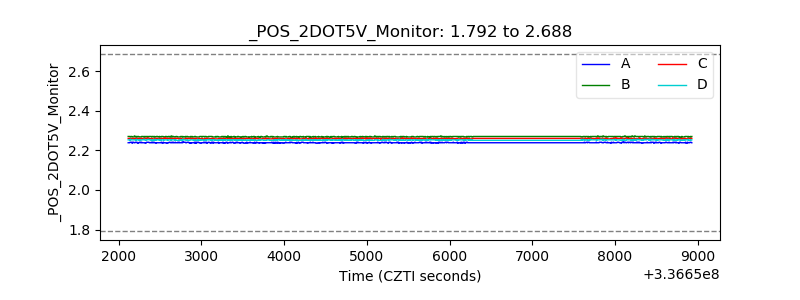 |
| +5 Volts monitor |  |
| _ROLL_ROT | 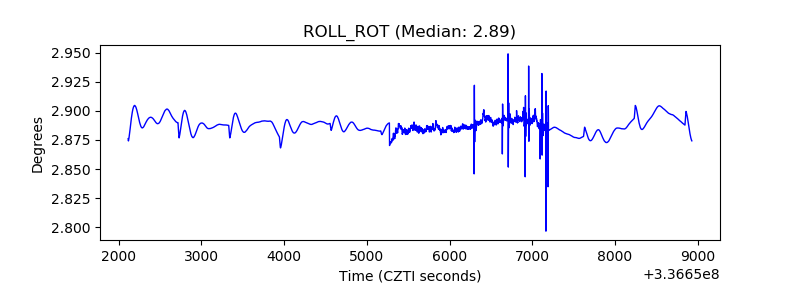 |
| _Roll_DEC | 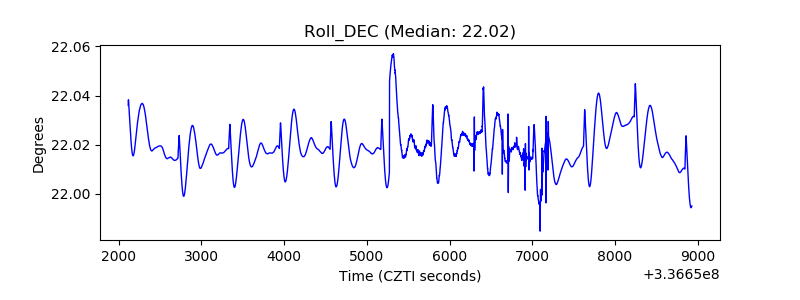 |
| _Roll_RA |  |
| Veto Counter | 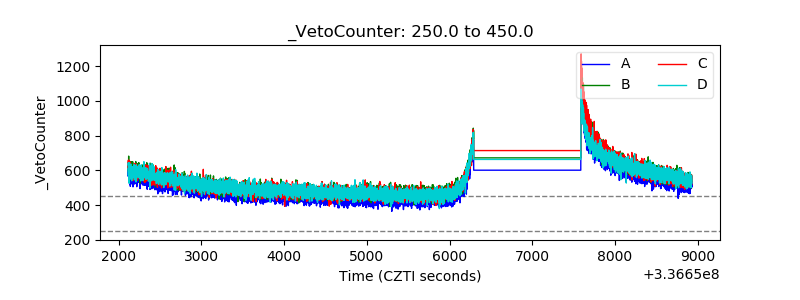 |