| Param | Original file | Final file |
|---|---|---|
| Filename | modeM0/AS1A09_145T01_9000003848_26649cztM0_level2.evt | modeM0/AS1A09_145T01_9000003848_26649cztM0_level2_quad_clean.evt |
| Size (bytes) | 560,692,800 | 81,002,880 |
| Size | 534.7 MB | 77.3 MB |
| Events in quadrant A | 3,763,695 | 523,085 |
| Events in quadrant B | 3,540,710 | 524,334 |
| Events in quadrant C | 3,490,592 | 499,543 |
| Events in quadrant D | 5,758,343 | 465,374 |
| Mode M0 | |||
|---|---|---|---|
| Quadrant | BADHDUFLAG | Total packets | Discarded packets |
| A | 0 | 15183 | 0 |
| B | 0 | 14127 | 0 |
| C | 0 | 13965 | 0 |
| D | 0 | 21395 | 0 |
| Mode M9 | |||
|---|---|---|---|
| Quadrant | BADHDUFLAG | Total packets | Discarded packets |
| A | 0 | 13 | 0 |
| B | 0 | 13 | 0 |
| C | 0 | 13 | 0 |
| D | 0 | 13 | 0 |
| Quadrant | Total seconds | Saturated seconds | Saturation percentage |
|---|---|---|---|
| A | 6311 | 91 | 1.441927% |
| B | 6312 | 82 | 1.299113% |
| C | 6312 | 115 | 1.821926% |
| D | 6312 | 532 | 8.428390% |
Noise dominated data is calculated using 1-second bins in cleaned event files. If a bin has >2000 counts, and if more than 50% of those come from <1% of pixels, then it is considered to be noise-dominated and hence unusable.
| Quadrant | # 1 sec bins | Bins with >0 counts | Bins with >2000 counts | High rate bins dominated by noise | Noise dominated (total time) | Noise dominated (detector-on time) | Marked lightcurve |
|---|---|---|---|---|---|---|---|
| A | 7581 | 6312 | 3 | 3 | 0.04% | 0.05% | 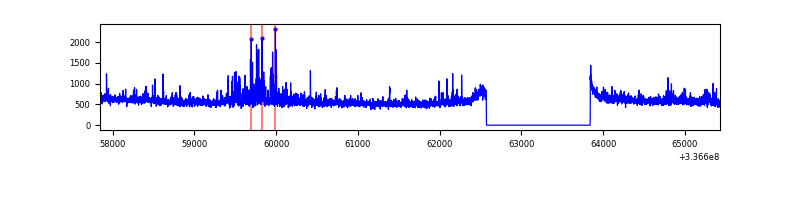 |
| B | 7582 | 6313 | 0 | 0 | 0.00% | 0.00% | 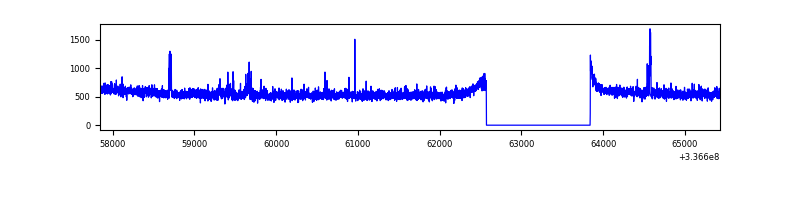 |
| C | 7582 | 6313 | 4 | 4 | 0.05% | 0.06% | 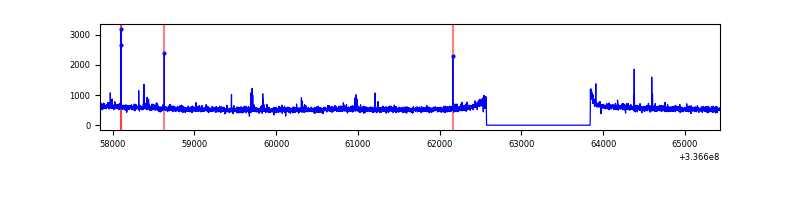 |
| D | 7582 | 6312 | 357 | 357 | 4.71% | 5.66% | 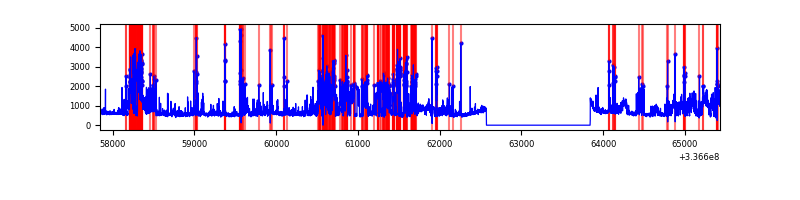 |
Top three noisy pixels from each quadrant. If the there are fewer than three noisy pixels in the level2.evt file, extra rows are filled as -1
| Pixel properties | Quadrant properties | ||||||
|---|---|---|---|---|---|---|---|
| Quadrant | DetID | PixID | Counts | Sigma | Mean | Median | Sigma |
| A | 0 | 13 | 333489 | 1880.3 | 890 | 877 | 176.9 |
| A | 13 | 254 | 10077 | 52.01 | 890 | 877 | 176.9 |
| A | 0 | 226 | 7782 | 39.03 | 890 | 877 | 176.9 |
| B | 3 | 112 | 55106 | 335.08 | 869 | 850 | 161.9 |
| B | 0 | 190 | 34405 | 207.23 | 869 | 850 | 161.9 |
| B | 0 | 219 | 32534 | 195.68 | 869 | 850 | 161.9 |
| C | 14 | 238 | 138578 | 715.02 | 839 | 848 | 192.6 |
| C | 15 | 208 | 38119 | 193.49 | 839 | 848 | 192.6 |
| C | 2 | 16 | 24396 | 122.25 | 839 | 848 | 192.6 |
| D | 1 | 52 | 1746236 | 7923.23 | 830 | 815 | 220.3 |
| D | 7 | 80 | 557327 | 2526.25 | 830 | 815 | 220.3 |
| D | 2 | 250 | 183025 | 827.13 | 830 | 815 | 220.3 |
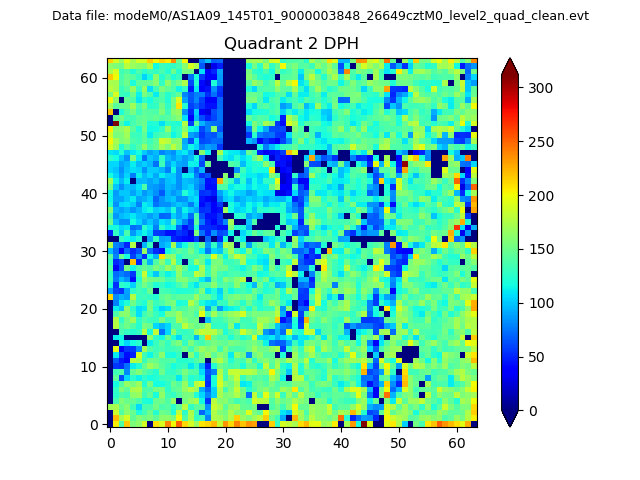
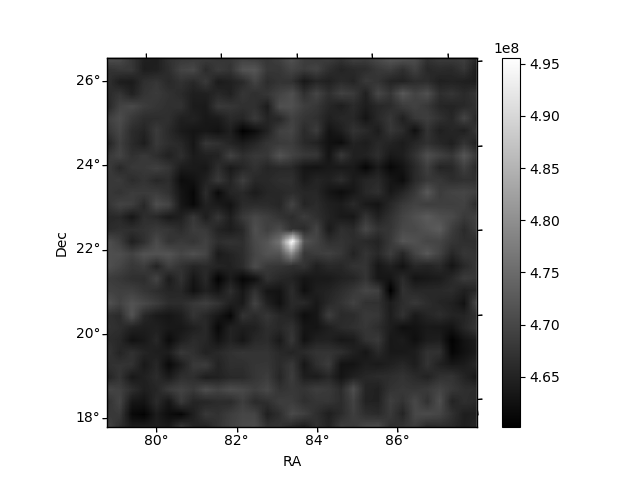
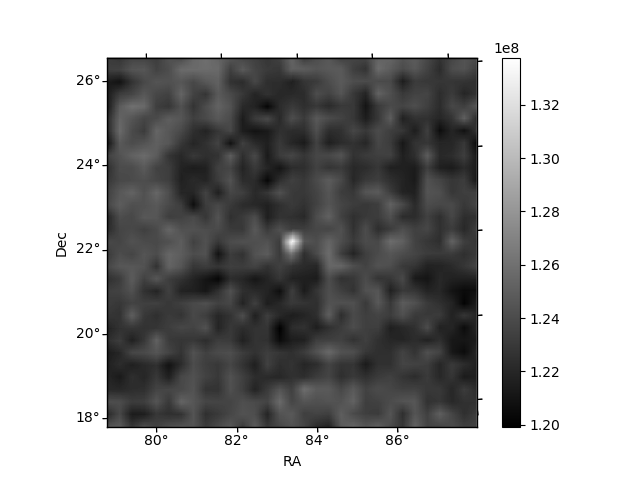
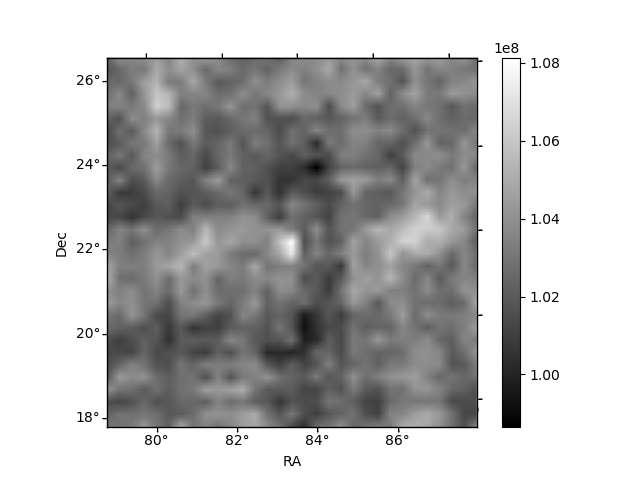
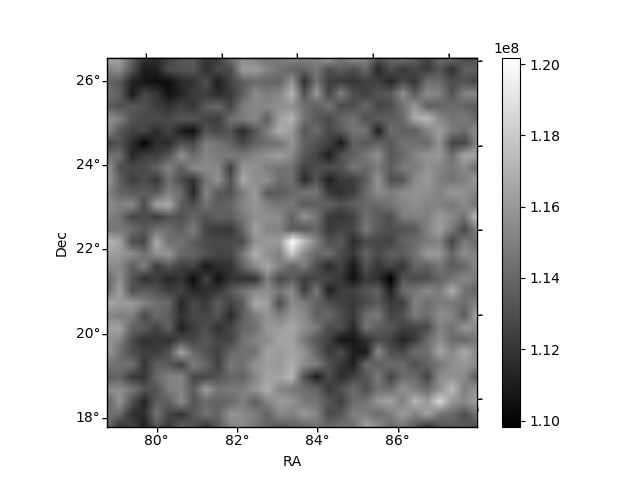
Histogram calculated using DETX and DETY for each event in the final _common_clean file
| Quadrant A | 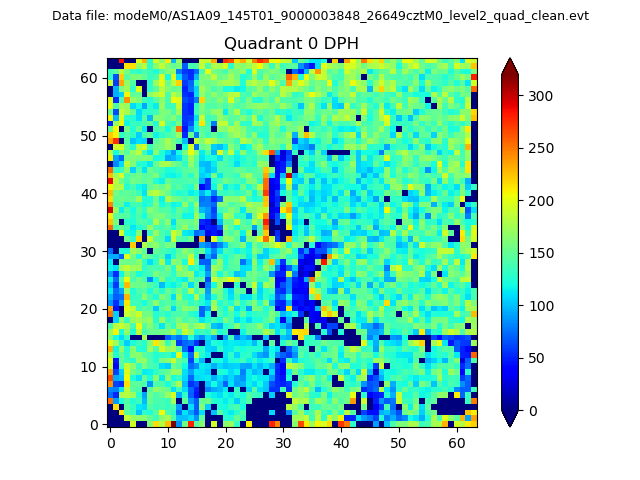 |
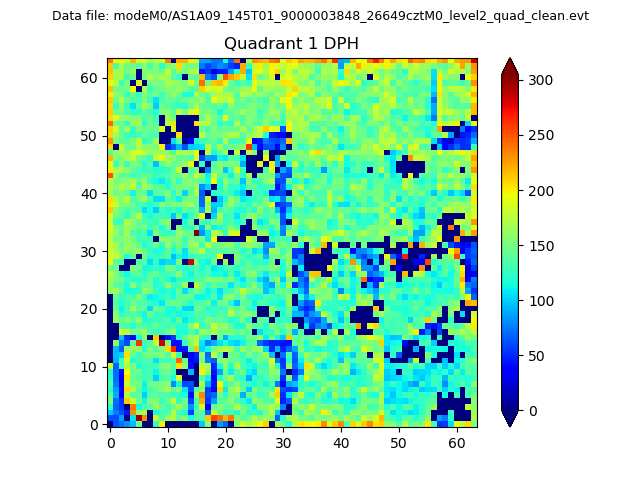 |
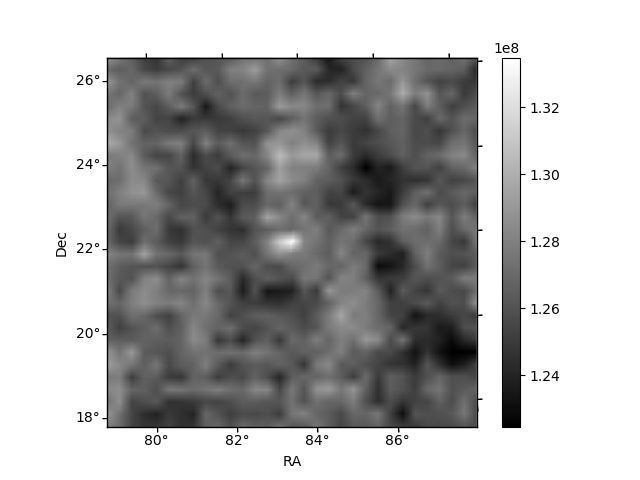
Quadrant B |
|---|---|---|---|
| Quadrant D | 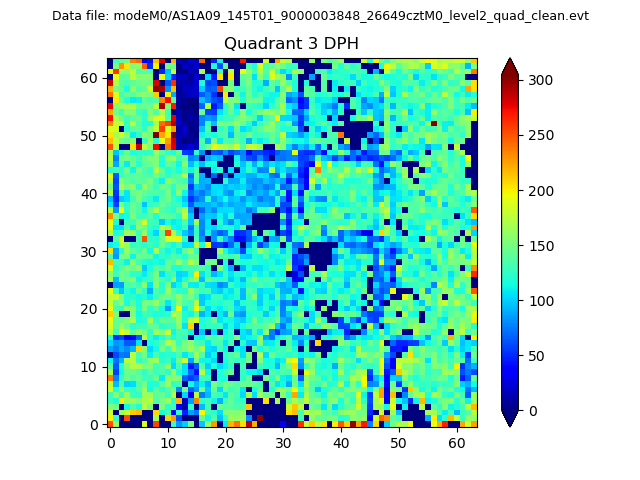 |
 |
Quadrant C |
| Plot type | Count rate plots | Images |
|---|---|---|
| Comparison with Poisson distribution Blue bars denote a histogram of data divided into 1 sec bins. Red curve is a Poisson curve with rate = median count rate of data. |
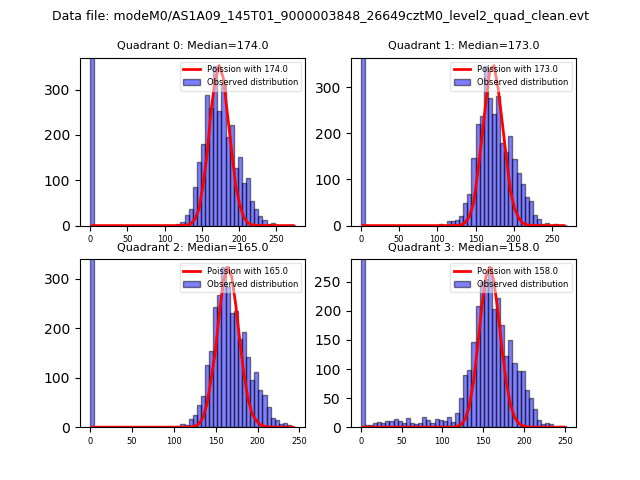 |
 |
| Quadrant-wise count rates Data is divided into 100 sec bins |
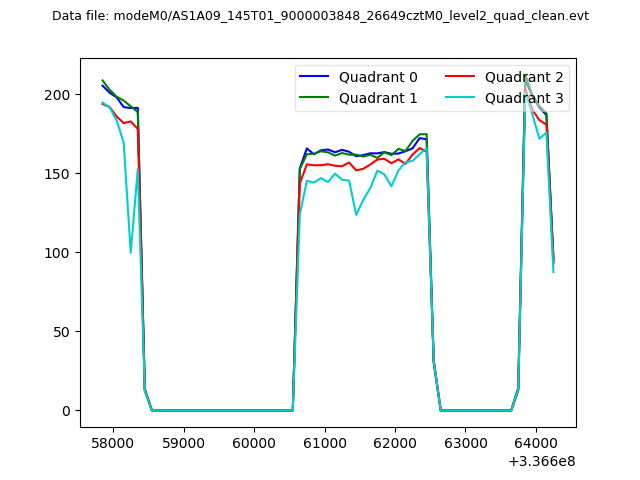 |
|
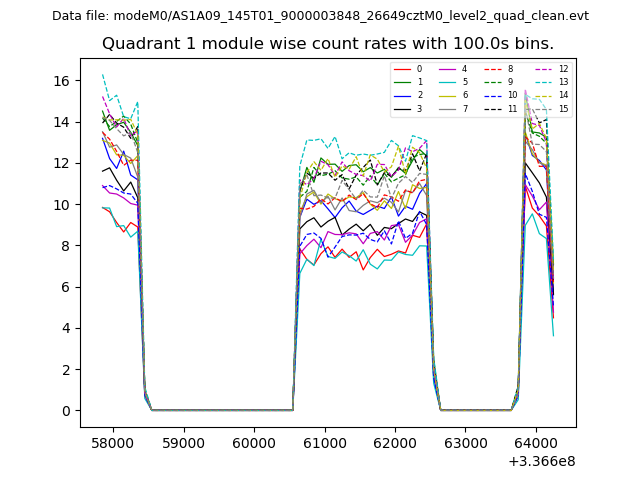
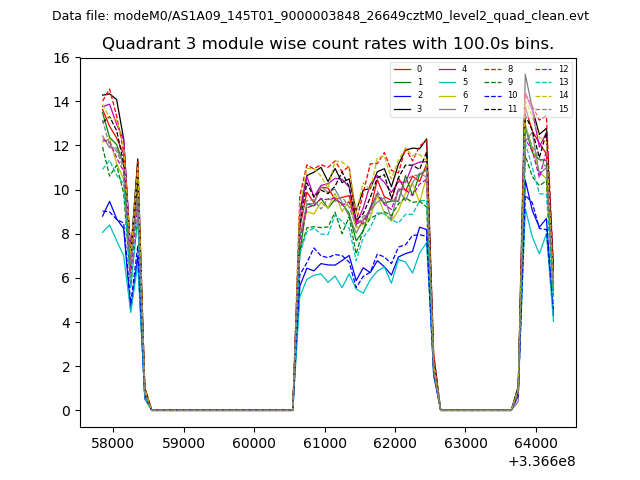
| Module-wise count rates for Quadrant A Data is divided into 100 sec bins |
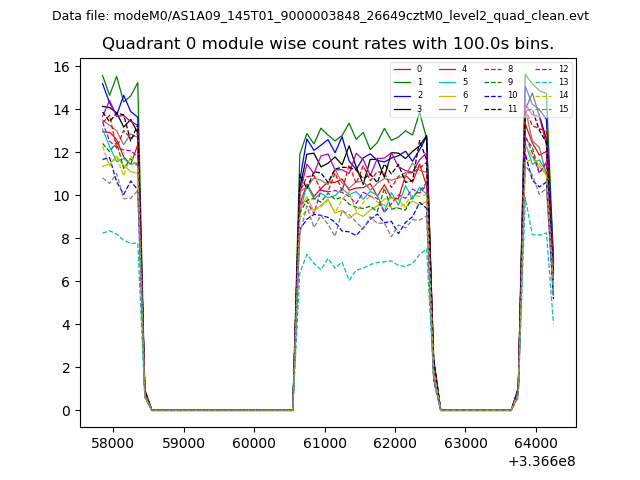 |
 |
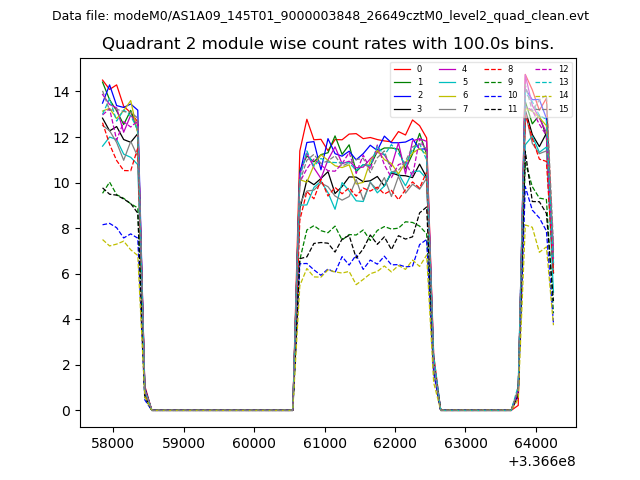
| Module-wise count rates for Quadrant B Data is divided into 100 sec bins |
 |
 |
| Module-wise count rates for Quadrant C Data is divided into 100 sec bins |
 |
 |
| Module-wise count rates for Quadrant D Data is divided into 100 sec bins |
 |
 |
| Parameter | Plot |
|---|---|
| CZT HV Monitor | 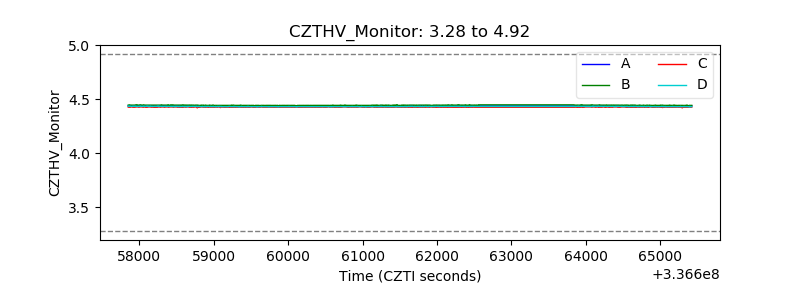 |
| D_VDD | 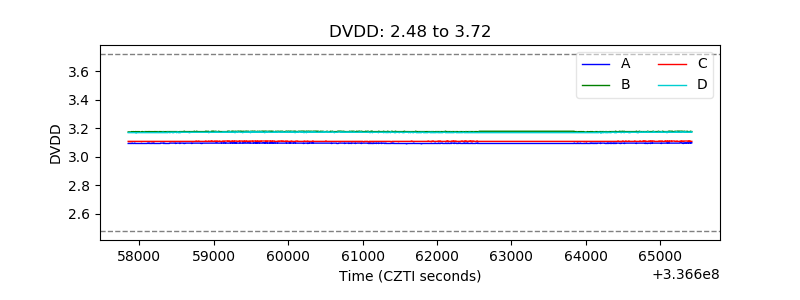 |
| Temperature 1 | 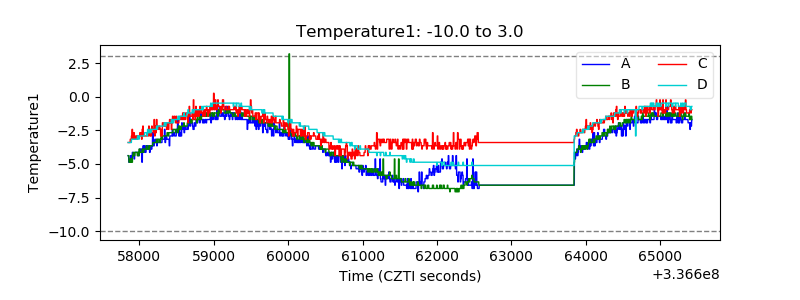 |
| Veto HV Monitor | 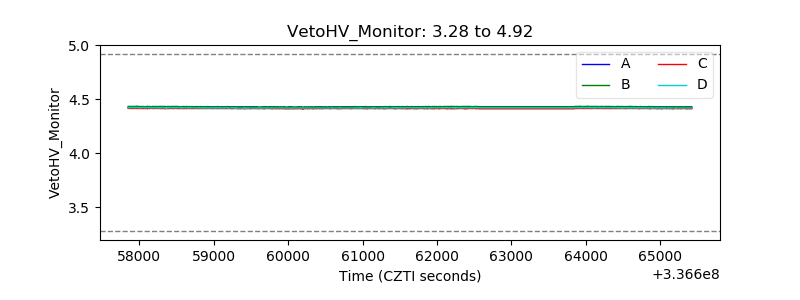 |
| Veto LLD | 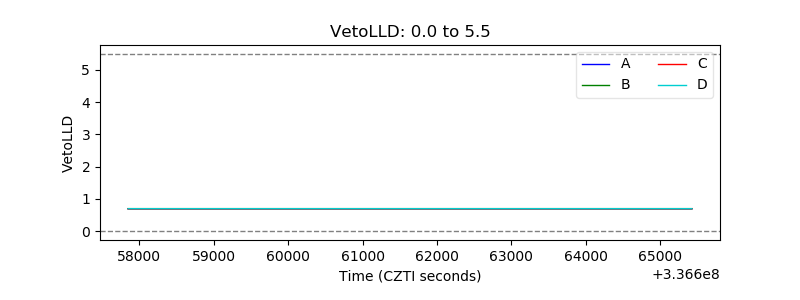 |
| Alpha Counter | 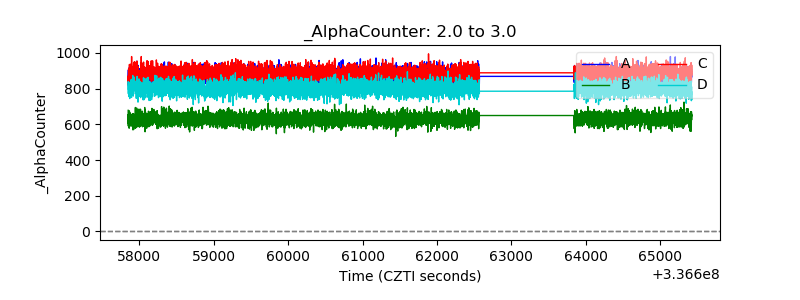 |
| _CPM_Rate | 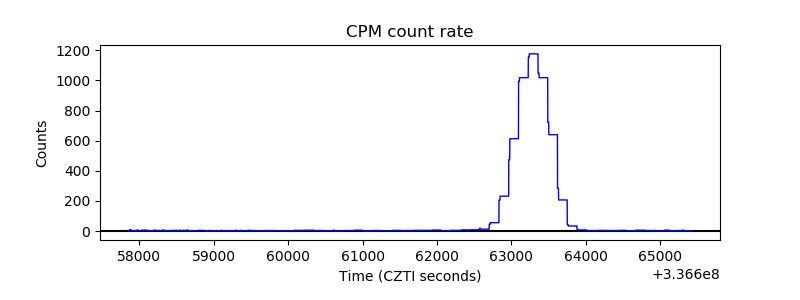 |
| CZT Counter | 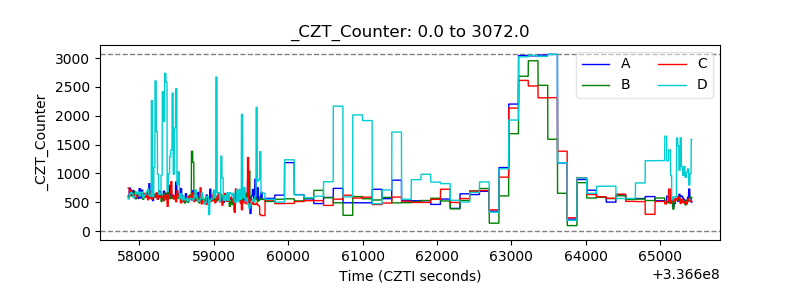 |
| +2.5 Volts monitor |  |
| +5 Volts monitor |  |
| _ROLL_ROT | 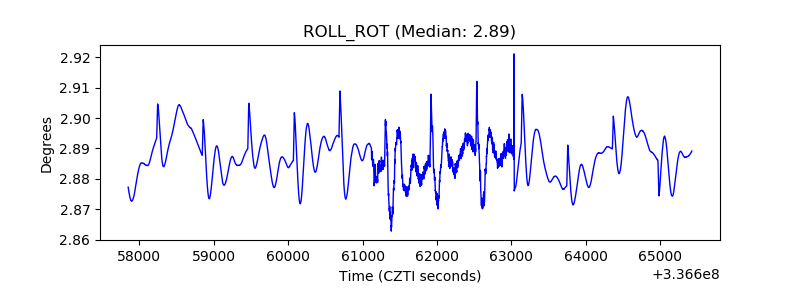 |
| _Roll_DEC | 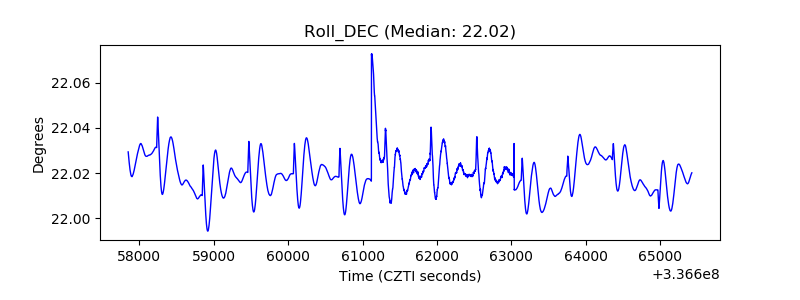 |
| _Roll_RA | 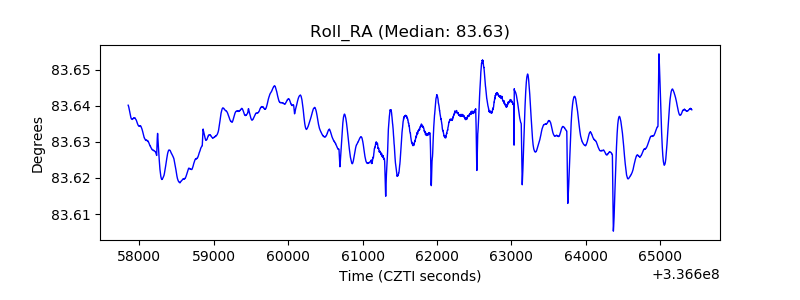 |
| Veto Counter | 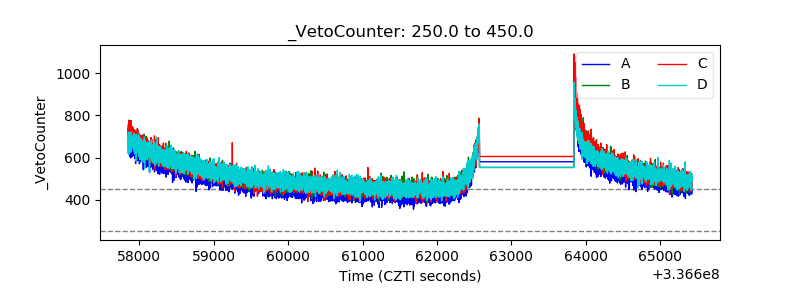 |