| Param | Original file | Final file |
|---|---|---|
| Filename | modeM0/AS1A09_145T01_9000003848_26650cztM0_level2.evt | modeM0/AS1A09_145T01_9000003848_26650cztM0_level2_quad_clean.evt |
| Size (bytes) | 597,911,040 | 68,526,720 |
| Size | 570.2 MB | 65.4 MB |
| Events in quadrant A | 3,745,010 | 423,696 |
| Events in quadrant B | 3,422,495 | 425,113 |
| Events in quadrant C | 3,401,052 | 408,057 |
| Events in quadrant D | 7,106,549 | 372,148 |
| Mode M0 | |||
|---|---|---|---|
| Quadrant | BADHDUFLAG | Total packets | Discarded packets |
| A | 0 | 15125 | 0 |
| B | 0 | 13641 | 0 |
| C | 0 | 13563 | 0 |
| D | 0 | 25434 | 0 |
| Mode M9 | |||
|---|---|---|---|
| Quadrant | BADHDUFLAG | Total packets | Discarded packets |
| A | 0 | 11 | 0 |
| B | 0 | 11 | 0 |
| C | 0 | 11 | 0 |
| D | 0 | 11 | 0 |
| Quadrant | Total seconds | Saturated seconds | Saturation percentage |
|---|---|---|---|
| A | 6386 | 103 | 1.612903% |
| B | 6386 | 87 | 1.362355% |
| C | 6386 | 134 | 2.098340% |
| D | 6386 | 1350 | 21.139994% |
Noise dominated data is calculated using 1-second bins in cleaned event files. If a bin has >2000 counts, and if more than 50% of those come from <1% of pixels, then it is considered to be noise-dominated and hence unusable.
| Quadrant | # 1 sec bins | Bins with >0 counts | Bins with >2000 counts | High rate bins dominated by noise | Noise dominated (total time) | Noise dominated (detector-on time) | Marked lightcurve |
|---|---|---|---|---|---|---|---|
| A | 7496 | 6387 | 0 | 0 | 0.00% | 0.00% | 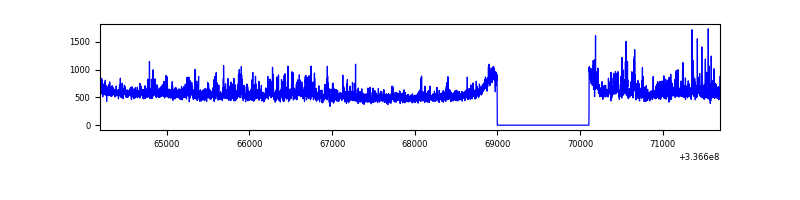 |
| B | 7496 | 6387 | 0 | 0 | 0.00% | 0.00% | 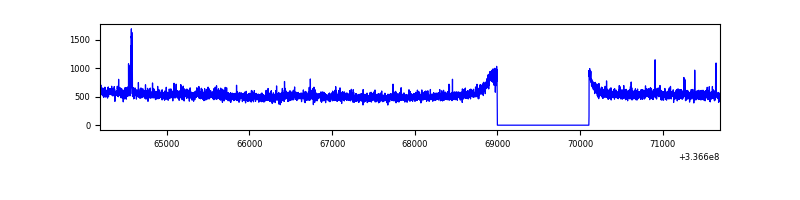 |
| C | 7496 | 6387 | 1 | 1 | 0.01% | 0.02% |  |
| D | 7496 | 6387 | 993 | 993 | 13.25% | 15.55% | 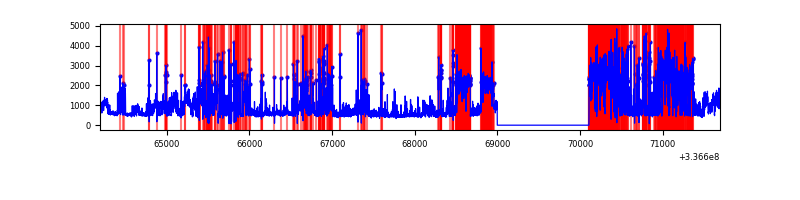 |
Top three noisy pixels from each quadrant. If the there are fewer than three noisy pixels in the level2.evt file, extra rows are filled as -1
| Pixel properties | Quadrant properties | ||||||
|---|---|---|---|---|---|---|---|
| Quadrant | DetID | PixID | Counts | Sigma | Mean | Median | Sigma |
| A | 0 | 13 | 412646 | 2384.72 | 864 | 848 | 172.7 |
| A | 13 | 254 | 10368 | 55.13 | 864 | 848 | 172.7 |
| A | 3 | 137 | 7451 | 38.24 | 864 | 848 | 172.7 |
| B | 3 | 112 | 31007 | 188.87 | 849 | 831 | 159.8 |
| B | 0 | 219 | 30358 | 184.81 | 849 | 831 | 159.8 |
| B | 0 | 190 | 21840 | 131.49 | 849 | 831 | 159.8 |
| C | 14 | 238 | 133234 | 688.68 | 823 | 830 | 192.3 |
| C | 3 | 233 | 24908 | 125.24 | 823 | 830 | 192.3 |
| C | 15 | 208 | 24553 | 123.39 | 823 | 830 | 192.3 |
| D | 7 | 80 | 2573646 | 12923.96 | 737 | 722 | 199.1 |
| D | 1 | 52 | 1634365 | 8205.89 | 737 | 722 | 199.1 |
| D | 2 | 250 | 50176 | 248.41 | 737 | 722 | 199.1 |
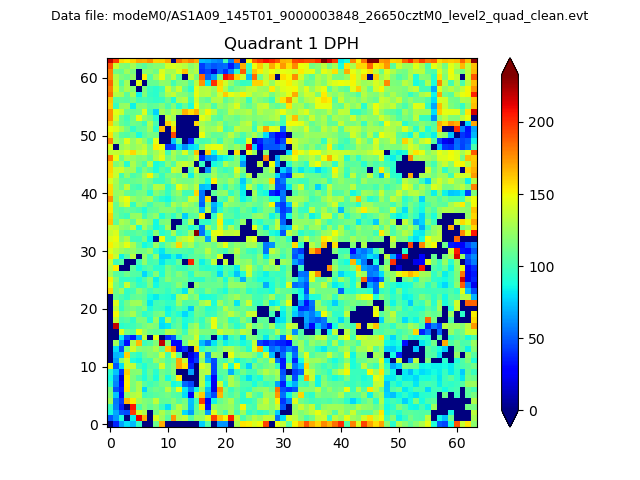
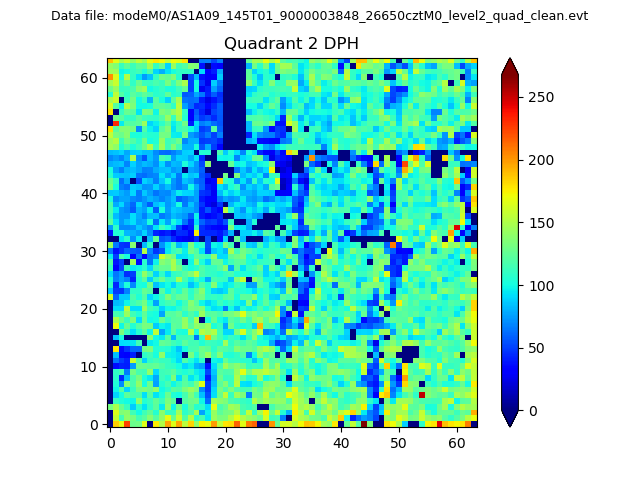
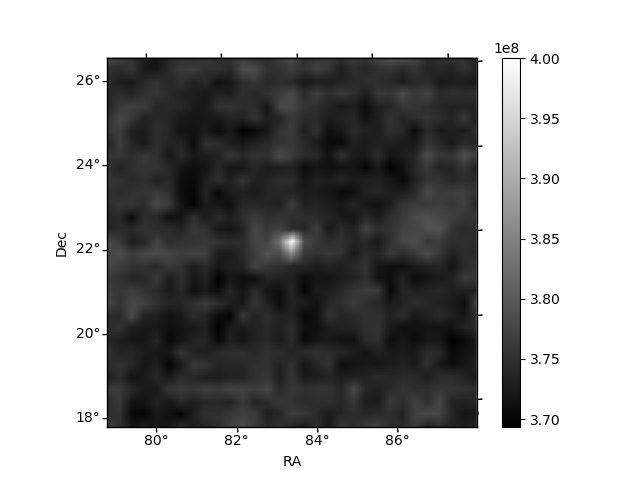
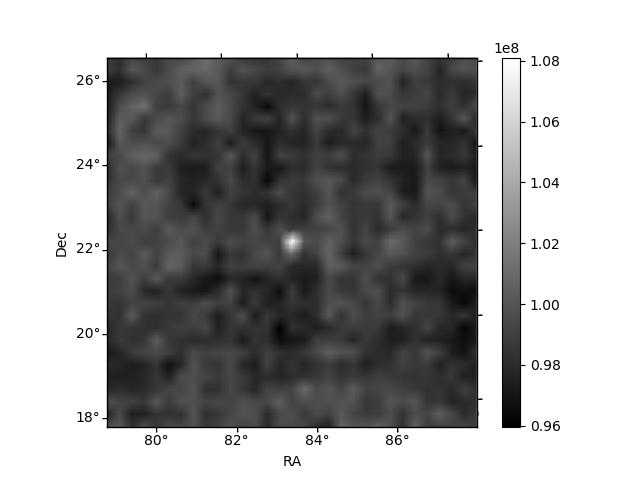
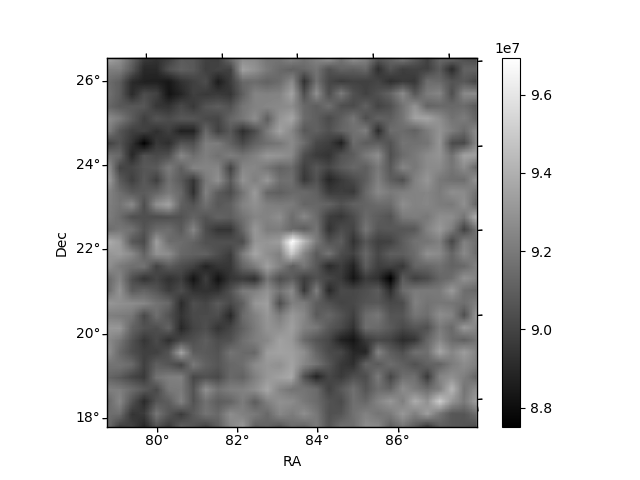
Histogram calculated using DETX and DETY for each event in the final _common_clean file
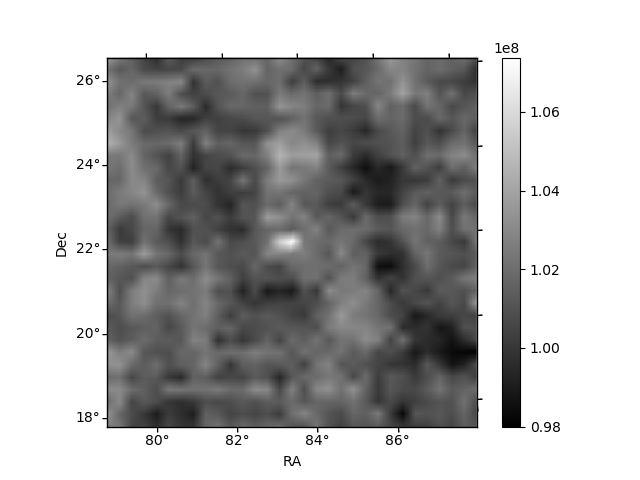
| Quadrant A | 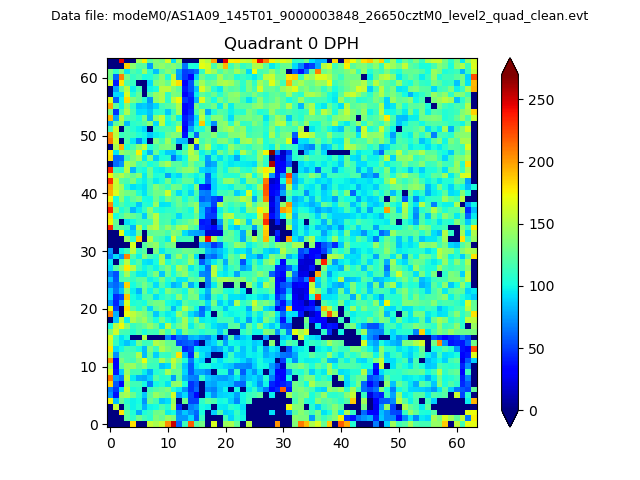 |
 |
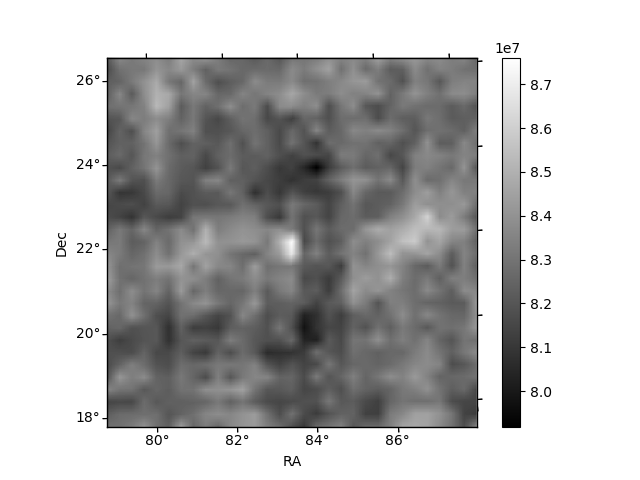
Quadrant B |
|---|---|---|---|
| Quadrant D | 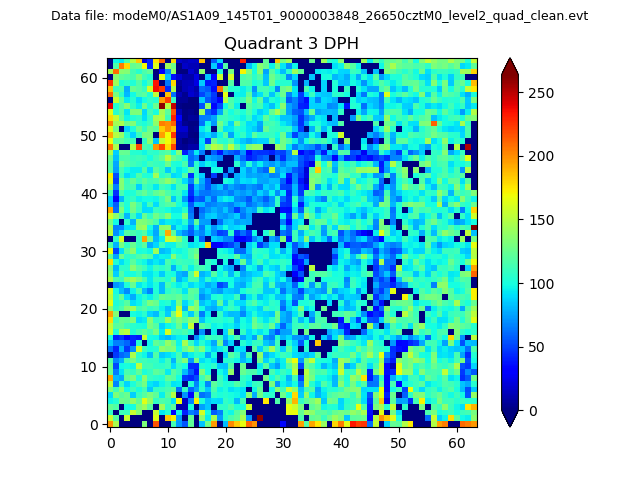 |
 |
Quadrant C |
| Plot type | Count rate plots | Images |
|---|---|---|
| Comparison with Poisson distribution Blue bars denote a histogram of data divided into 1 sec bins. Red curve is a Poisson curve with rate = median count rate of data. |
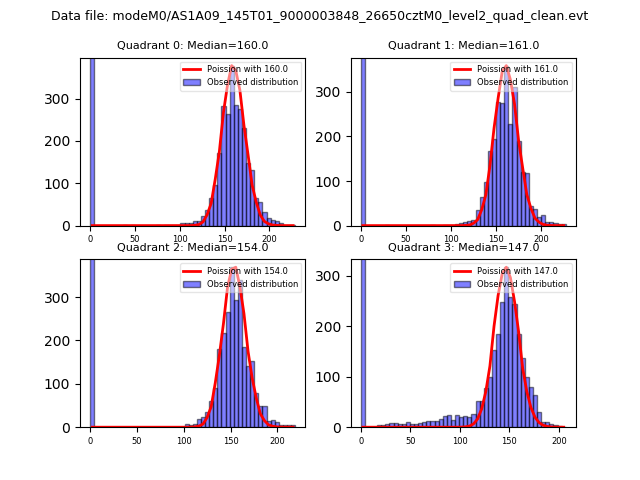 |
 |
| Quadrant-wise count rates Data is divided into 100 sec bins |
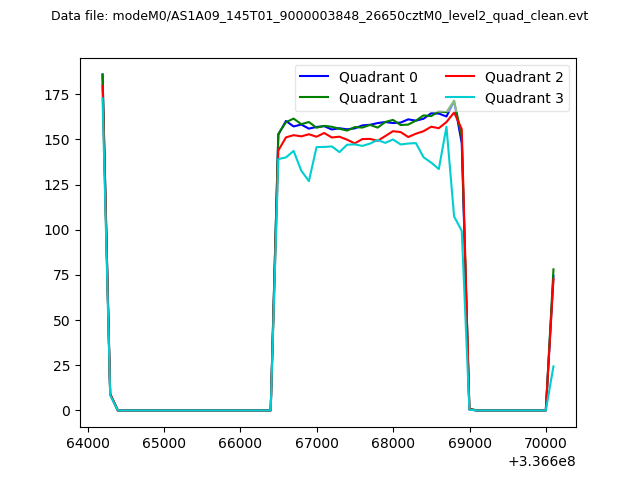 |
|
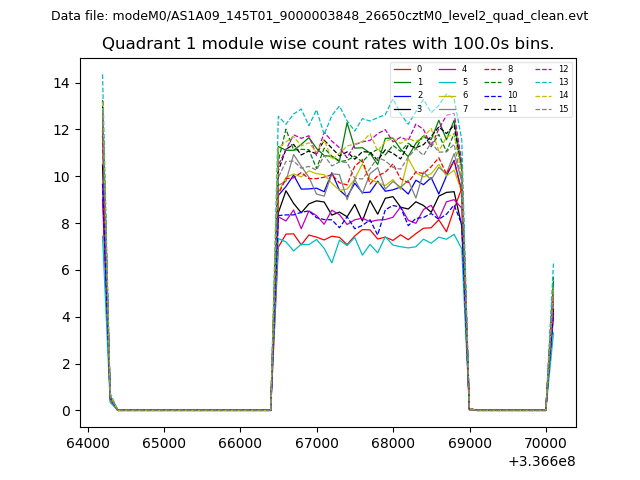
| Module-wise count rates for Quadrant A Data is divided into 100 sec bins |
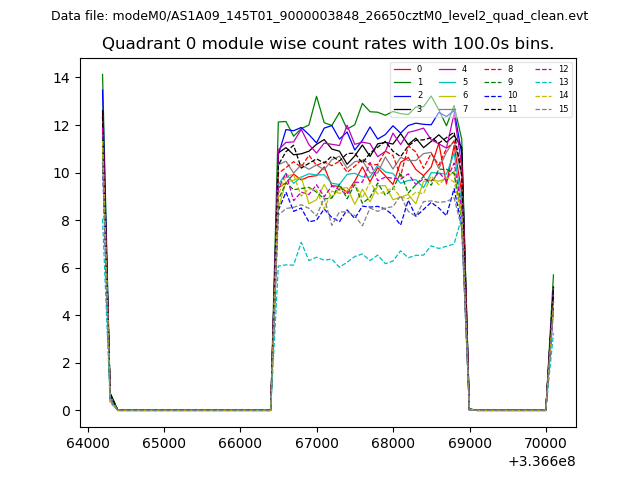 |
 |
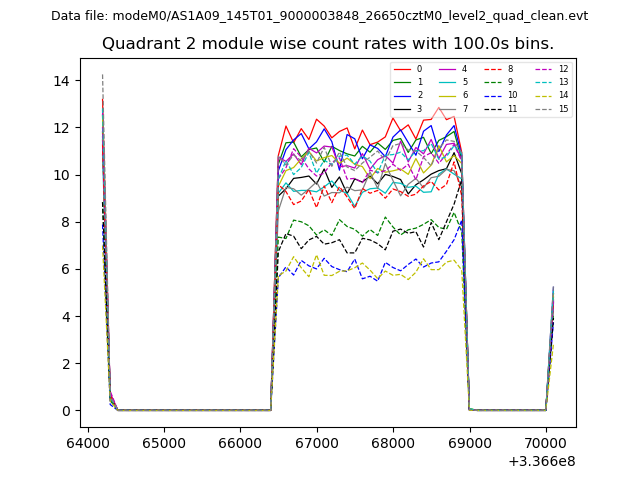
| Module-wise count rates for Quadrant B Data is divided into 100 sec bins |
 |
 |
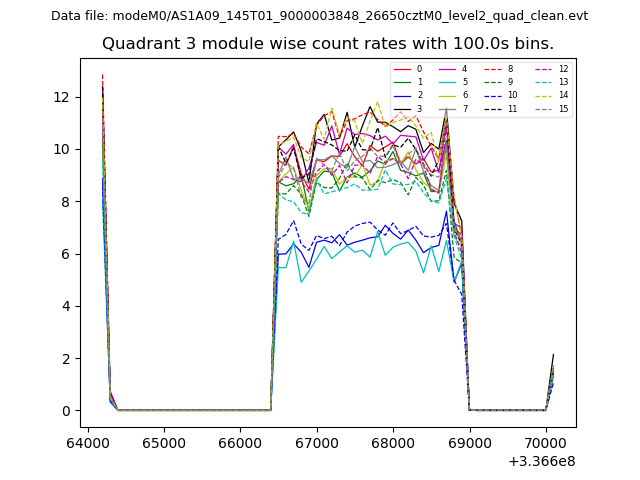
| Module-wise count rates for Quadrant C Data is divided into 100 sec bins |
 |
 |
| Module-wise count rates for Quadrant D Data is divided into 100 sec bins |
 |
 |
| Parameter | Plot |
|---|---|
| CZT HV Monitor | 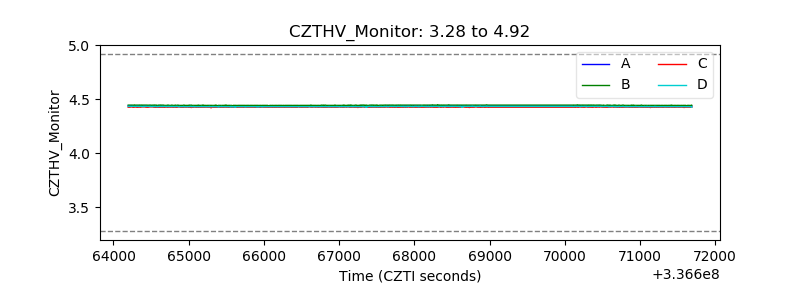 |
| D_VDD | 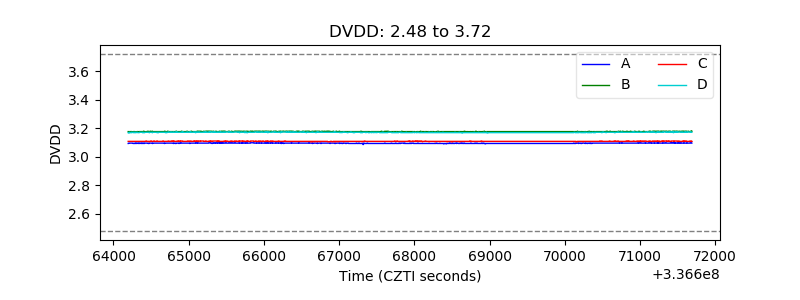 |
| Temperature 1 | 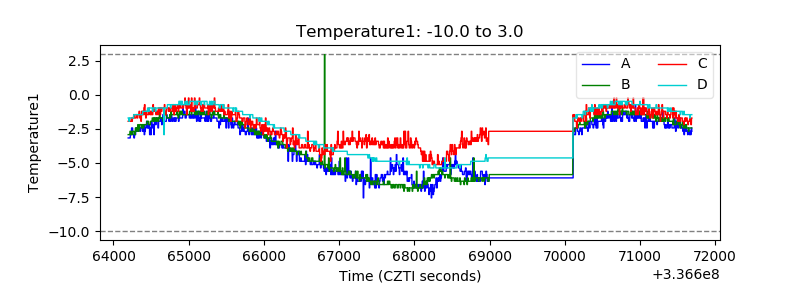 |
| Veto HV Monitor | 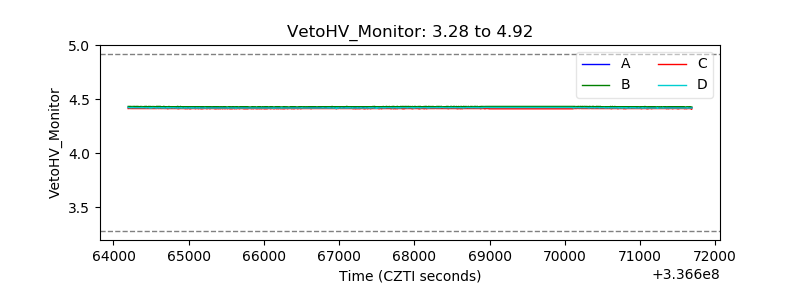 |
| Veto LLD | 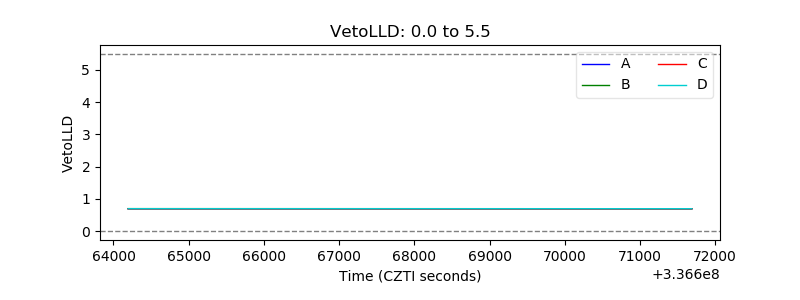 |
| Alpha Counter | 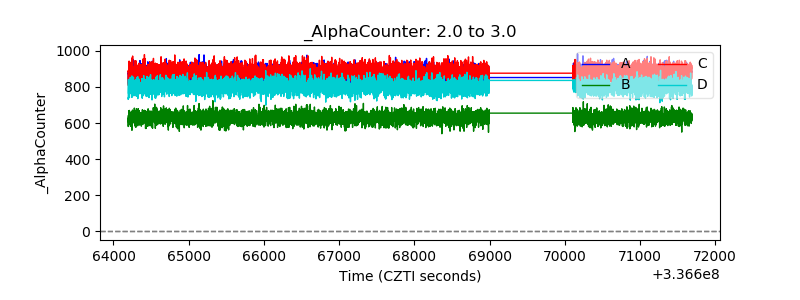 |
| _CPM_Rate | 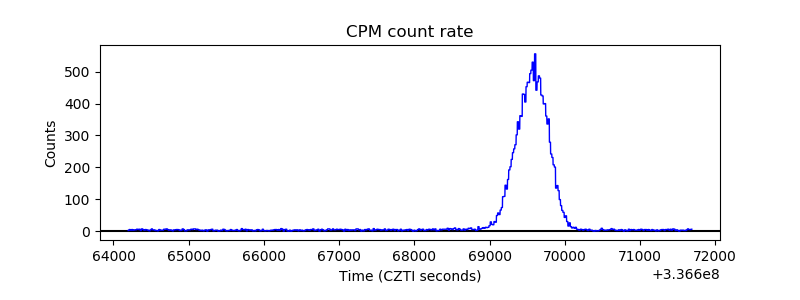 |
| CZT Counter | 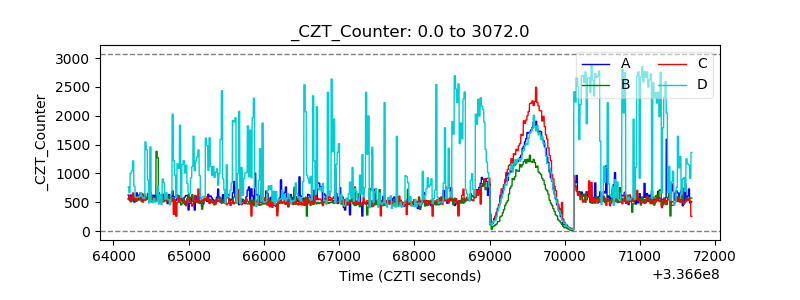 |
| +2.5 Volts monitor |  |
| +5 Volts monitor |  |
| _ROLL_ROT | 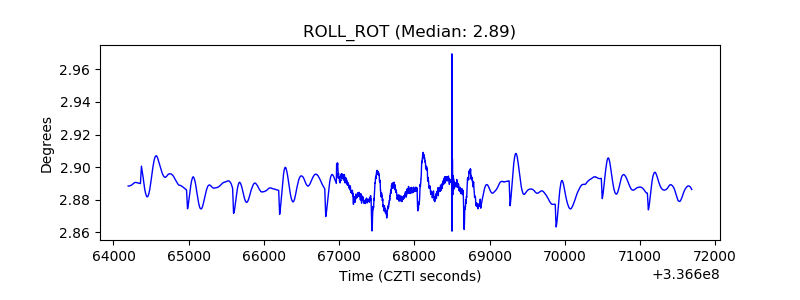 |
| _Roll_DEC | 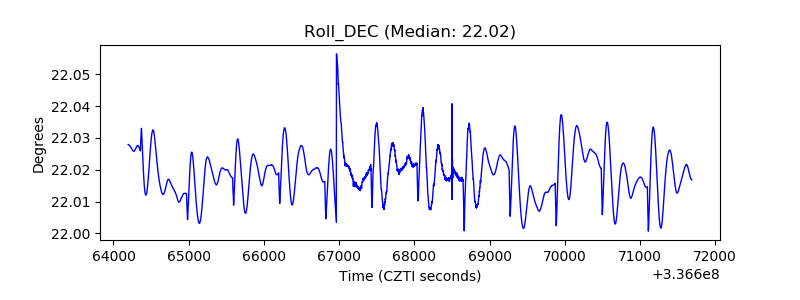 |
| _Roll_RA | 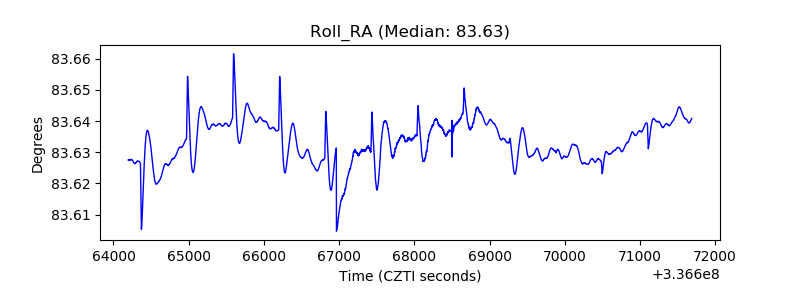 |
| Veto Counter | 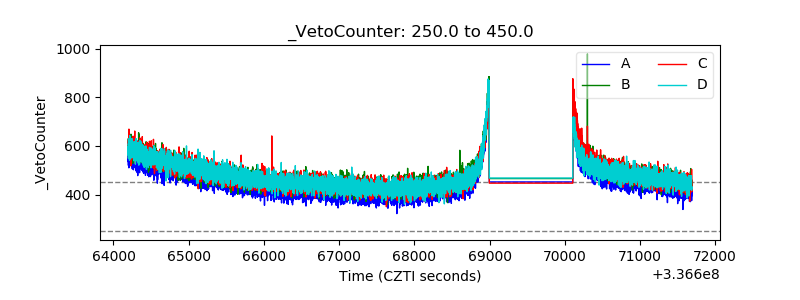 |