| Param | Original file | Final file |
|---|---|---|
| Filename | modeM0/AS1A09_145T01_9000003848_26651cztM0_level2.evt | modeM0/AS1A09_145T01_9000003848_26651cztM0_level2_quad_clean.evt |
| Size (bytes) | 536,359,680 | 77,627,520 |
| Size | 511.5 MB | 74.0 MB |
| Events in quadrant A | 3,655,991 | 486,584 |
| Events in quadrant B | 3,405,141 | 487,950 |
| Events in quadrant C | 3,363,157 | 468,923 |
| Events in quadrant D | 5,389,336 | 464,492 |
| Mode M0 | |||
|---|---|---|---|
| Quadrant | BADHDUFLAG | Total packets | Discarded packets |
| A | 0 | 14754 | 0 |
| B | 0 | 13801 | 0 |
| C | 0 | 13536 | 0 |
| D | 0 | 20195 | 0 |
| Mode M9 | |||
|---|---|---|---|
| Quadrant | BADHDUFLAG | Total packets | Discarded packets |
| A | 0 | 8 | 0 |
| B | 0 | 8 | 0 |
| C | 0 | 8 | 0 |
| D | 0 | 8 | 0 |
| Quadrant | Total seconds | Saturated seconds | Saturation percentage |
|---|---|---|---|
| A | 6344 | 60 | 0.945776% |
| B | 6345 | 63 | 0.992908% |
| C | 6344 | 111 | 1.749685% |
| D | 6344 | 780 | 12.295082% |
Noise dominated data is calculated using 1-second bins in cleaned event files. If a bin has >2000 counts, and if more than 50% of those come from <1% of pixels, then it is considered to be noise-dominated and hence unusable.
| Quadrant | # 1 sec bins | Bins with >0 counts | Bins with >2000 counts | High rate bins dominated by noise | Noise dominated (total time) | Noise dominated (detector-on time) | Marked lightcurve |
|---|---|---|---|---|---|---|---|
| A | 7169 | 6345 | 1 | 1 | 0.01% | 0.02% | 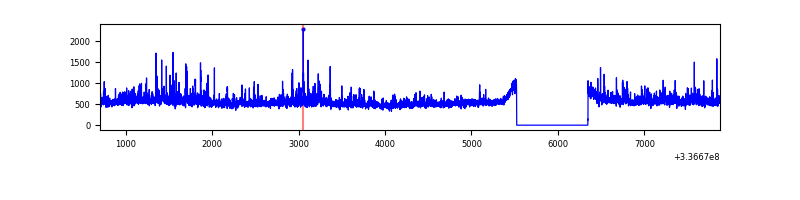 |
| B | 7170 | 6346 | 0 | 0 | 0.00% | 0.00% | 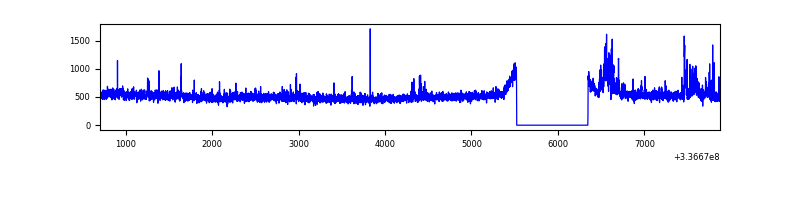 |
| C | 7169 | 6345 | 5 | 5 | 0.07% | 0.08% | 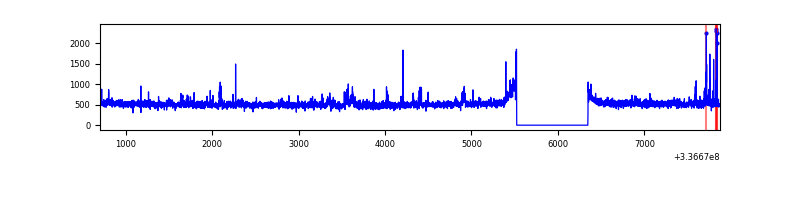 |
| D | 7169 | 6345 | 563 | 563 | 7.85% | 8.87% | 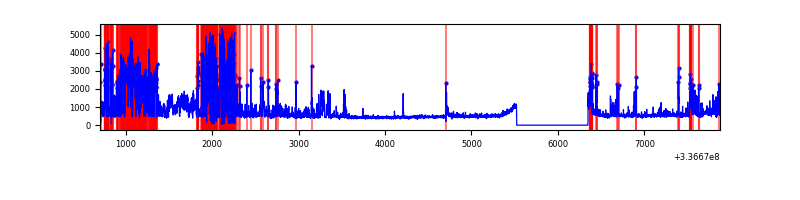 |
Top three noisy pixels from each quadrant. If the there are fewer than three noisy pixels in the level2.evt file, extra rows are filled as -1
| Pixel properties | Quadrant properties | ||||||
|---|---|---|---|---|---|---|---|
| Quadrant | DetID | PixID | Counts | Sigma | Mean | Median | Sigma |
| A | 0 | 13 | 484002 | 2921.72 | 823 | 809 | 165.4 |
| A | 13 | 254 | 10077 | 56.04 | 823 | 809 | 165.4 |
| A | 3 | 137 | 7324 | 39.39 | 823 | 809 | 165.4 |
| B | 0 | 189 | 140426 | 904.01 | 813 | 797 | 154.5 |
| B | 0 | 219 | 25421 | 159.43 | 813 | 797 | 154.5 |
| B | 10 | 245 | 21346 | 133.04 | 813 | 797 | 154.5 |
| C | 14 | 238 | 126786 | 685.01 | 783 | 792 | 183.9 |
| C | 3 | 233 | 113930 | 615.12 | 783 | 792 | 183.9 |
| C | 2 | 16 | 58249 | 312.39 | 783 | 792 | 183.9 |
| D | 7 | 80 | 1734111 | 8672.89 | 733 | 722 | 199.9 |
| D | 1 | 52 | 684770 | 3422.59 | 733 | 722 | 199.9 |
| D | 2 | 250 | 79503 | 394.18 | 733 | 722 | 199.9 |
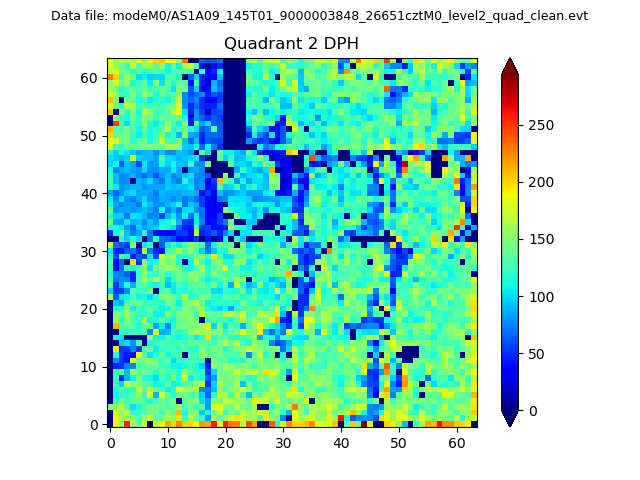
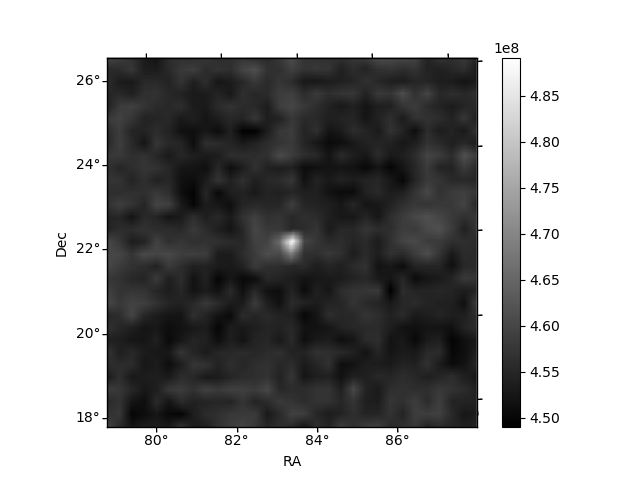
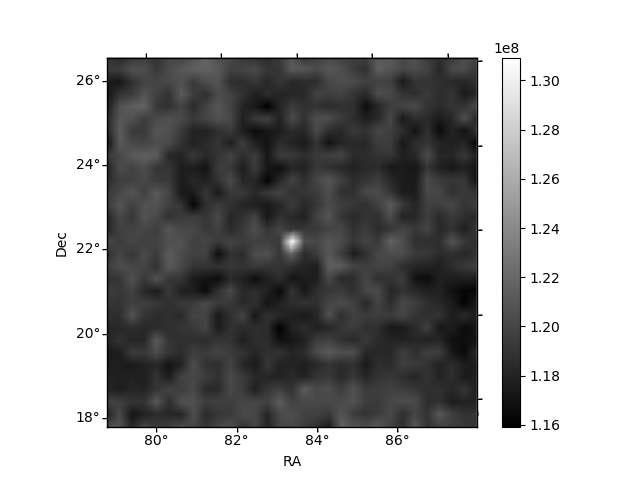
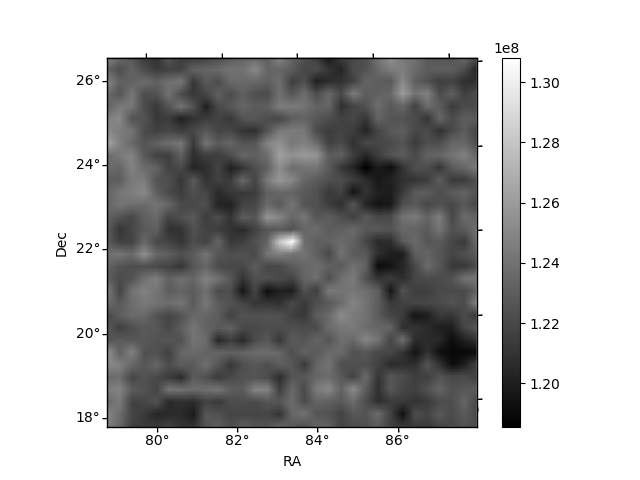
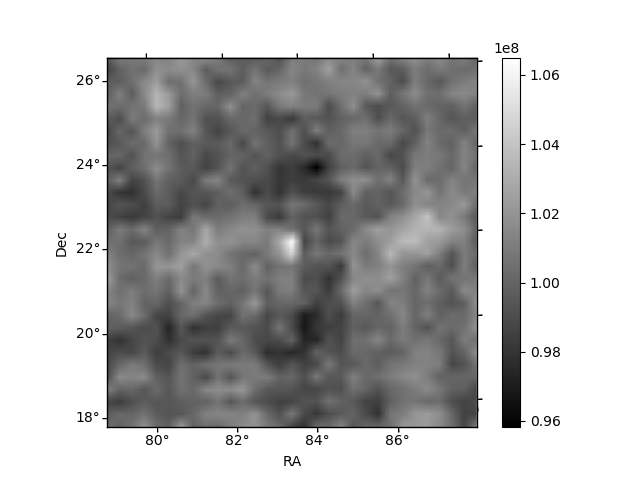
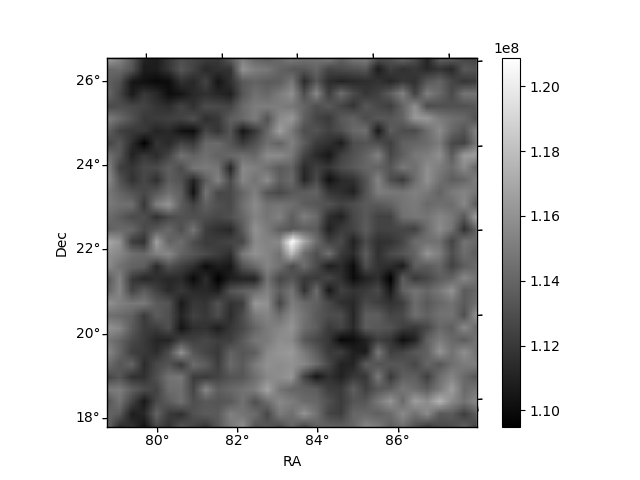
Histogram calculated using DETX and DETY for each event in the final _common_clean file
| Quadrant A | 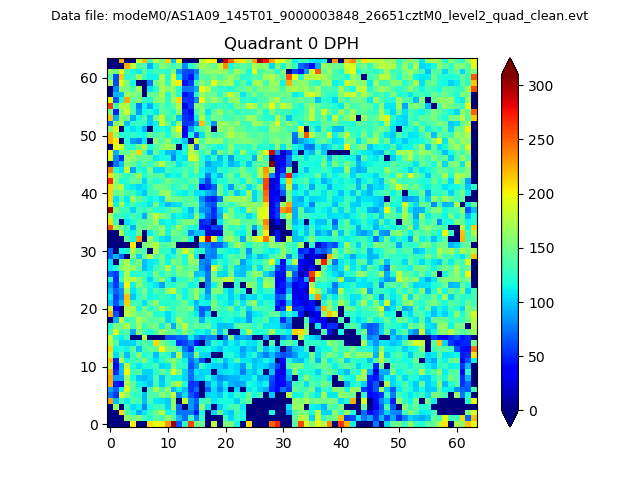 |
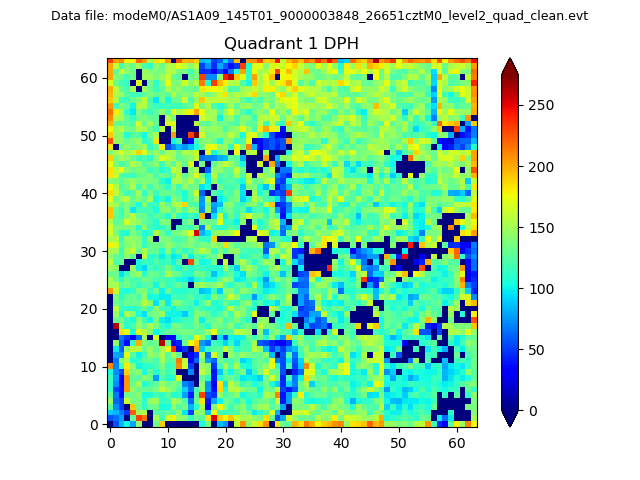 |
Quadrant B |
|---|---|---|---|
| Quadrant D | 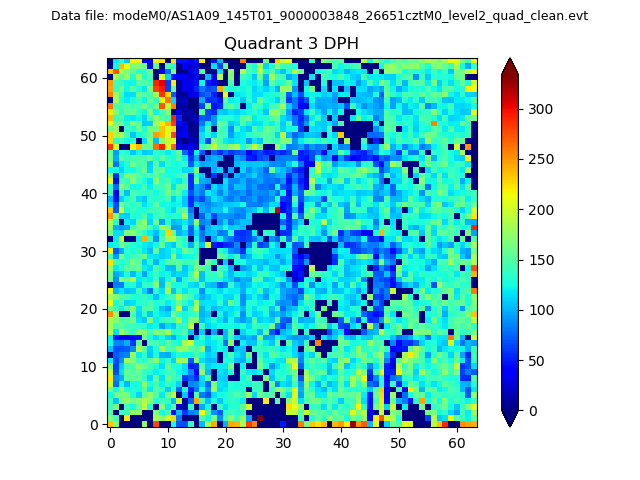 |
 |
Quadrant C |
| Plot type | Count rate plots | Images |
|---|---|---|
| Comparison with Poisson distribution Blue bars denote a histogram of data divided into 1 sec bins. Red curve is a Poisson curve with rate = median count rate of data. |
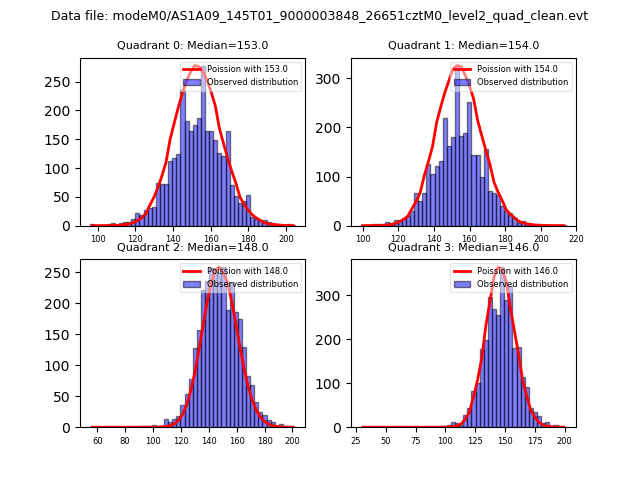 |
 |
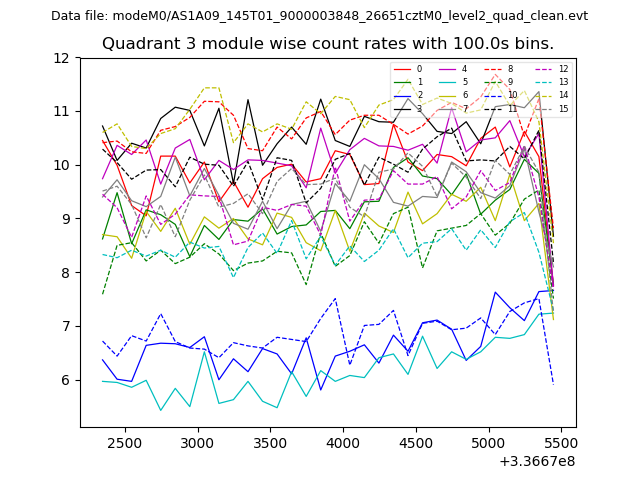
| Quadrant-wise count rates Data is divided into 100 sec bins |
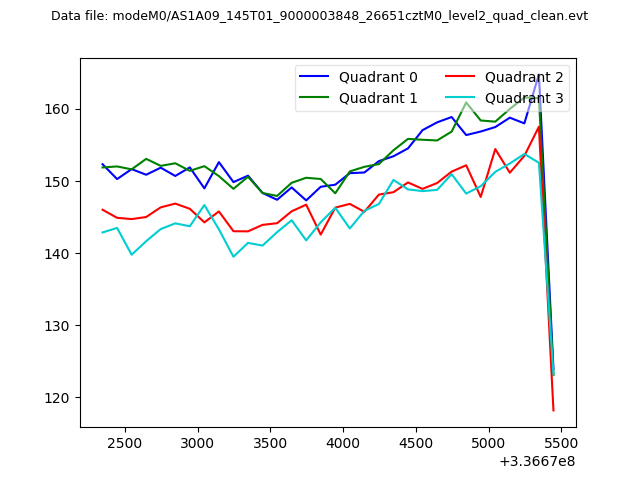 |
|
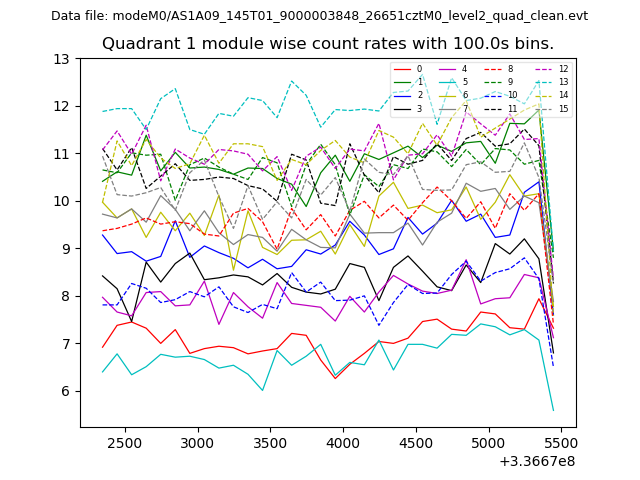
| Module-wise count rates for Quadrant A Data is divided into 100 sec bins |
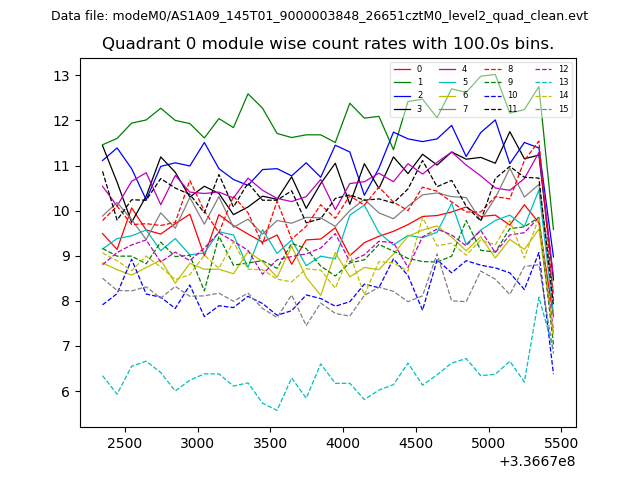 |
 |
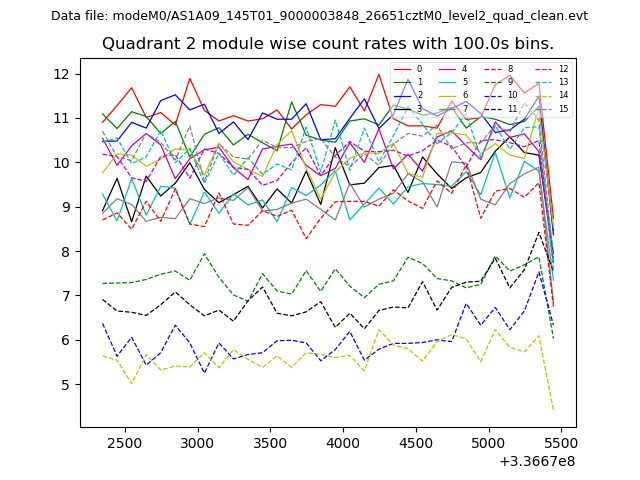
| Module-wise count rates for Quadrant B Data is divided into 100 sec bins |
 |
 |
| Module-wise count rates for Quadrant C Data is divided into 100 sec bins |
 |
 |
| Module-wise count rates for Quadrant D Data is divided into 100 sec bins |
 |
 |
| Parameter | Plot |
|---|---|
| CZT HV Monitor | 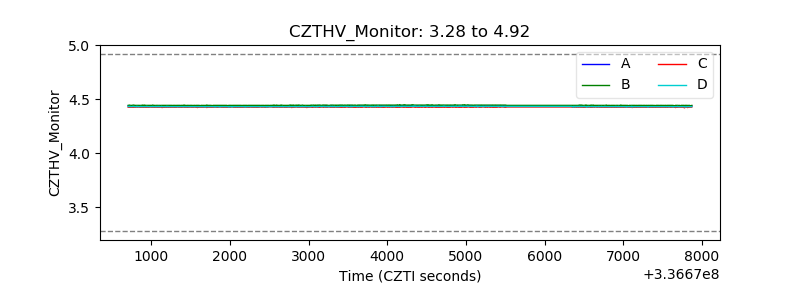 |
| D_VDD | 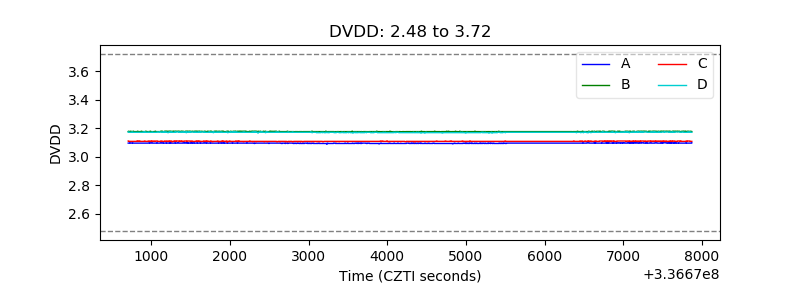 |
| Temperature 1 | 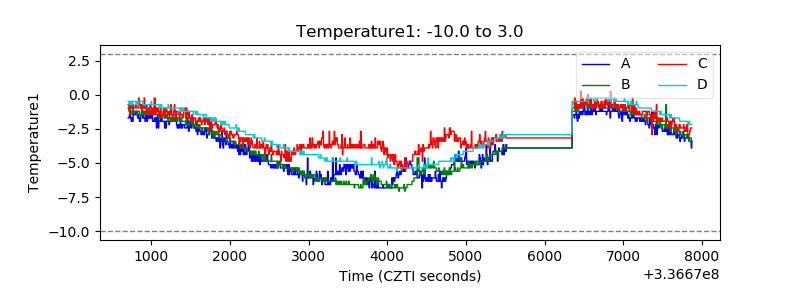 |
| Veto HV Monitor | 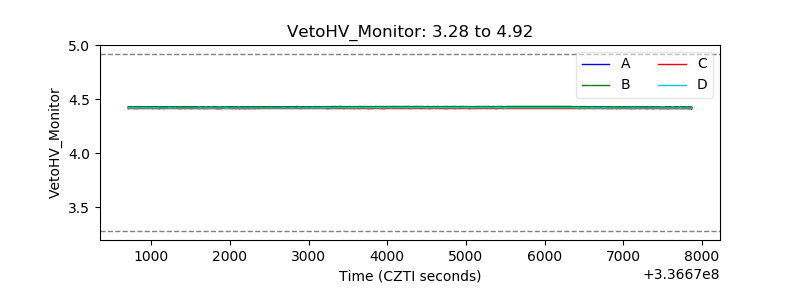 |
| Veto LLD | 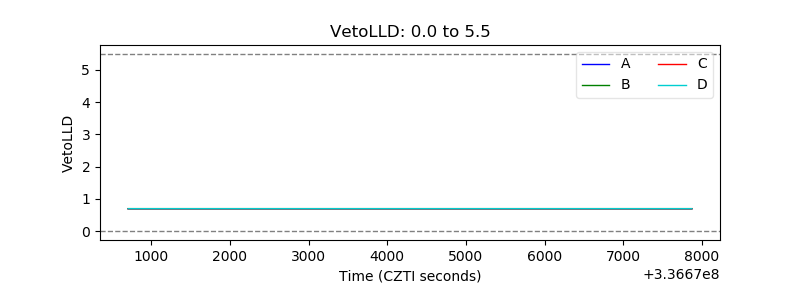 |
| Alpha Counter |  |
| _CPM_Rate | 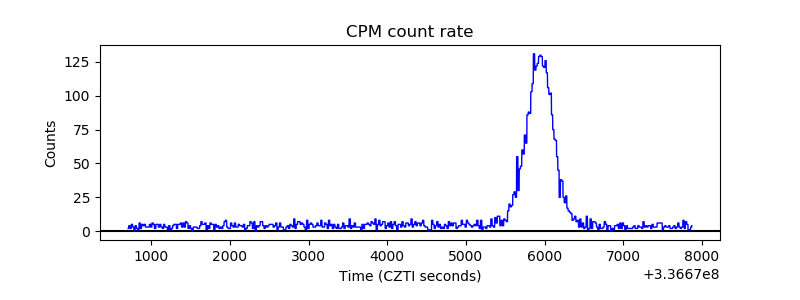 |
| CZT Counter | 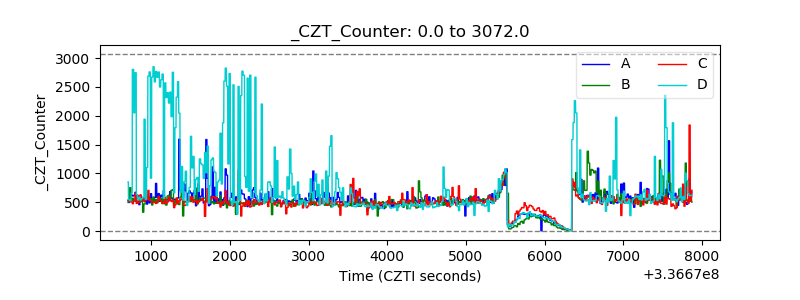 |
| +2.5 Volts monitor |  |
| +5 Volts monitor |  |
| _ROLL_ROT | 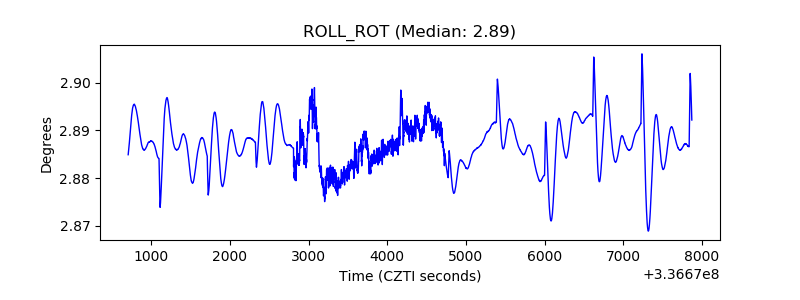 |
| _Roll_DEC | 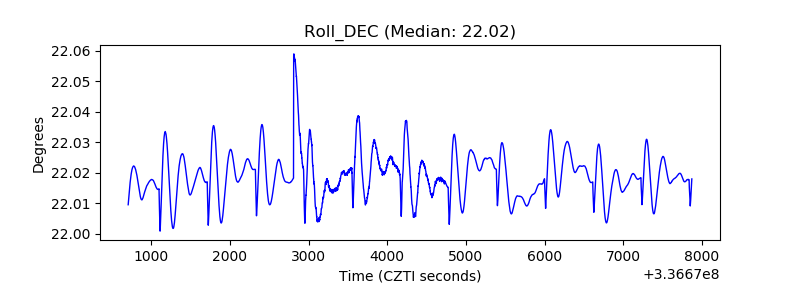 |
| _Roll_RA | 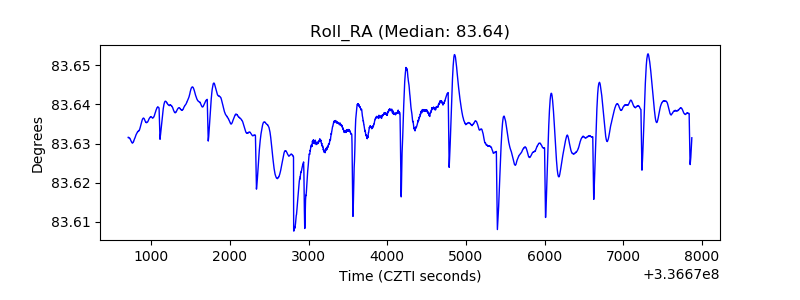 |
| Veto Counter | 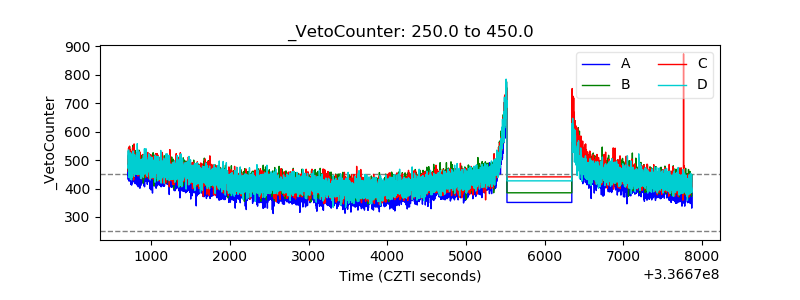 |