| Param | Original file | Final file |
|---|---|---|
| Filename | modeM0/AS1A09_145T01_9000003848_26652cztM0_level2.evt | modeM0/AS1A09_145T01_9000003848_26652cztM0_level2_quad_clean.evt |
| Size (bytes) | 543,643,200 | 85,371,840 |
| Size | 518.5 MB | 81.4 MB |
| Events in quadrant A | 3,785,303 | 536,832 |
| Events in quadrant B | 4,597,890 | 541,523 |
| Events in quadrant C | 3,628,312 | 524,359 |
| Events in quadrant D | 3,998,325 | 515,625 |
| Mode M0 | |||
|---|---|---|---|
| Quadrant | BADHDUFLAG | Total packets | Discarded packets |
| A | 0 | 15345 | 0 |
| B | 0 | 17783 | 0 |
| C | 0 | 14733 | 0 |
| D | 0 | 16372 | 0 |
| Mode M9 | |||
|---|---|---|---|
| Quadrant | BADHDUFLAG | Total packets | Discarded packets |
| A | 0 | 4 | 0 |
| B | 0 | 4 | 0 |
| C | 0 | 4 | 0 |
| D | 0 | 4 | 0 |
| Quadrant | Total seconds | Saturated seconds | Saturation percentage |
|---|---|---|---|
| A | 6697 | 127 | 1.896372% |
| B | 6697 | 535 | 7.988652% |
| C | 6697 | 174 | 2.598178% |
| D | 6697 | 123 | 1.836643% |
Noise dominated data is calculated using 1-second bins in cleaned event files. If a bin has >2000 counts, and if more than 50% of those come from <1% of pixels, then it is considered to be noise-dominated and hence unusable.
| Quadrant | # 1 sec bins | Bins with >0 counts | Bins with >2000 counts | High rate bins dominated by noise | Noise dominated (total time) | Noise dominated (detector-on time) | Marked lightcurve |
|---|---|---|---|---|---|---|---|
| A | 7132 | 6698 | 55 | 55 | 0.77% | 0.82% | 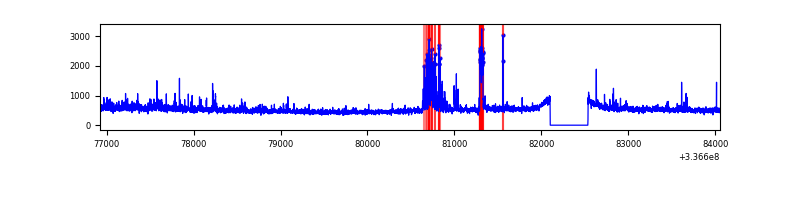 |
| B | 7132 | 6698 | 298 | 298 | 4.18% | 4.45% | 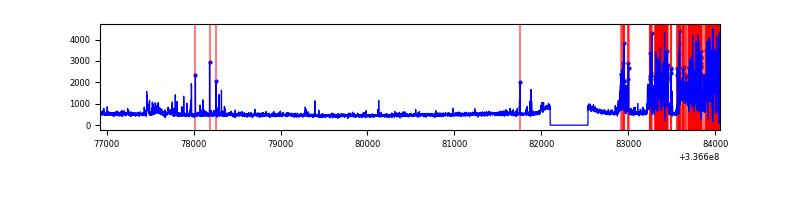 |
| C | 7132 | 6698 | 41 | 41 | 0.57% | 0.61% | 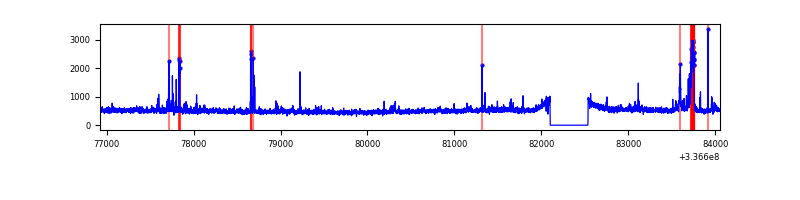 |
| D | 7132 | 6698 | 48 | 48 | 0.67% | 0.72% | 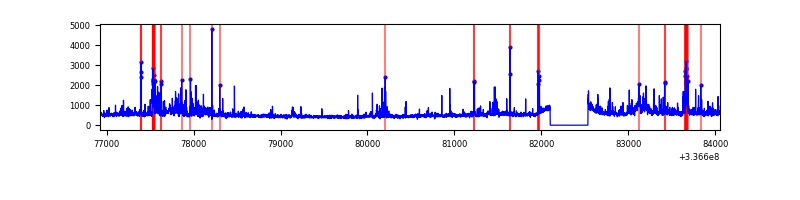 |
Top three noisy pixels from each quadrant. If the there are fewer than three noisy pixels in the level2.evt file, extra rows are filled as -1
| Pixel properties | Quadrant properties | ||||||
|---|---|---|---|---|---|---|---|
| Quadrant | DetID | PixID | Counts | Sigma | Mean | Median | Sigma |
| A | 12 | 96 | 259227 | 1479.06 | 855 | 841 | 174.7 |
| A | 0 | 13 | 227298 | 1296.29 | 855 | 841 | 174.7 |
| A | 13 | 254 | 11144 | 58.98 | 855 | 841 | 174.7 |
| B | 10 | 245 | 1251873 | 7970.91 | 817 | 799 | 157.0 |
| B | 0 | 189 | 68612 | 432.05 | 817 | 799 | 157.0 |
| B | 3 | 112 | 38462 | 239.96 | 817 | 799 | 157.0 |
| C | 2 | 16 | 228580 | 1183.47 | 814 | 818 | 192.5 |
| C | 14 | 238 | 131902 | 681.12 | 814 | 818 | 192.5 |
| C | 3 | 233 | 54134 | 277.03 | 814 | 818 | 192.5 |
| D | 1 | 52 | 204574 | 914.92 | 821 | 806 | 222.7 |
| D | 7 | 80 | 171051 | 764.4 | 821 | 806 | 222.7 |
| D | 2 | 250 | 122987 | 548.59 | 821 | 806 | 222.7 |
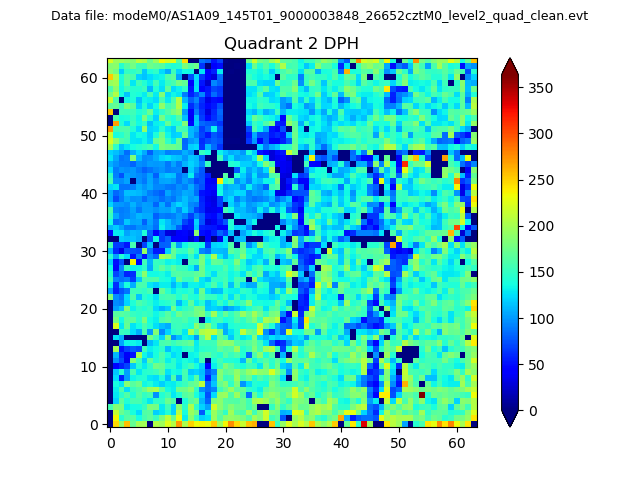
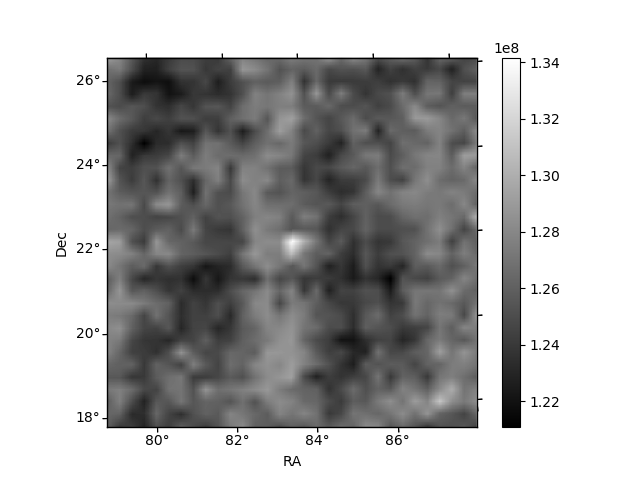
Histogram calculated using DETX and DETY for each event in the final _common_clean file
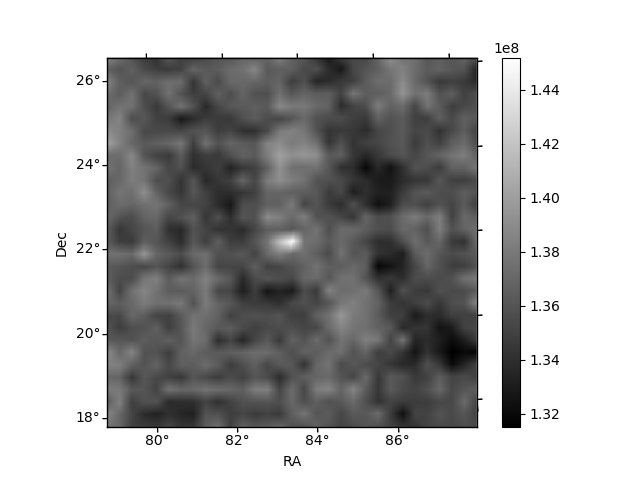
| Quadrant A | 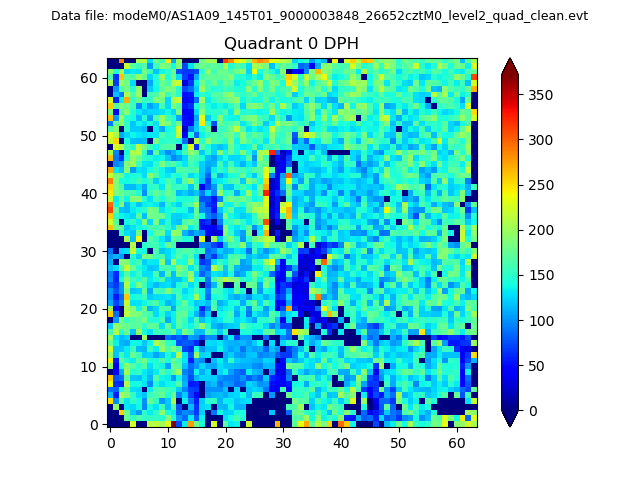 |
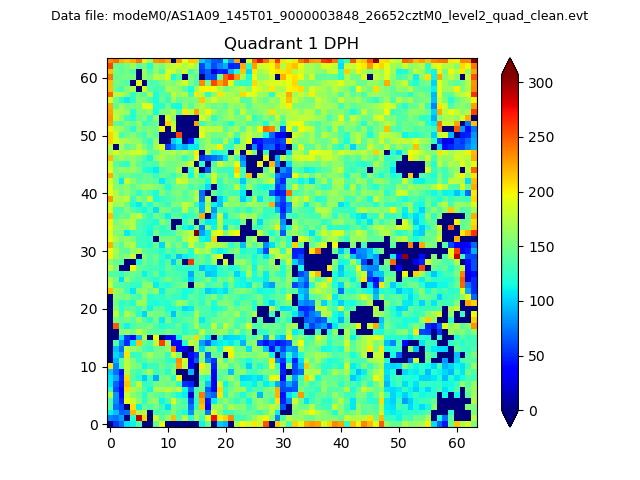 |
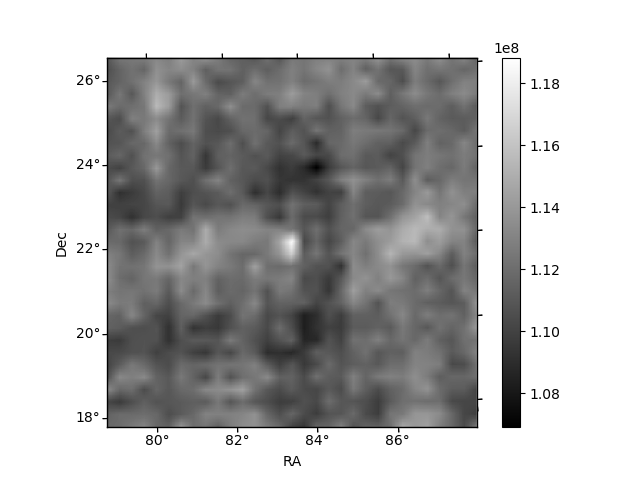
Quadrant B |
|---|---|---|---|
| Quadrant D | 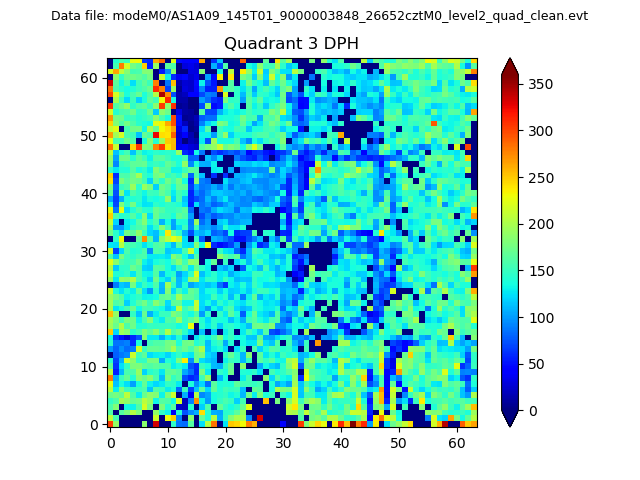 |
 |
Quadrant C |
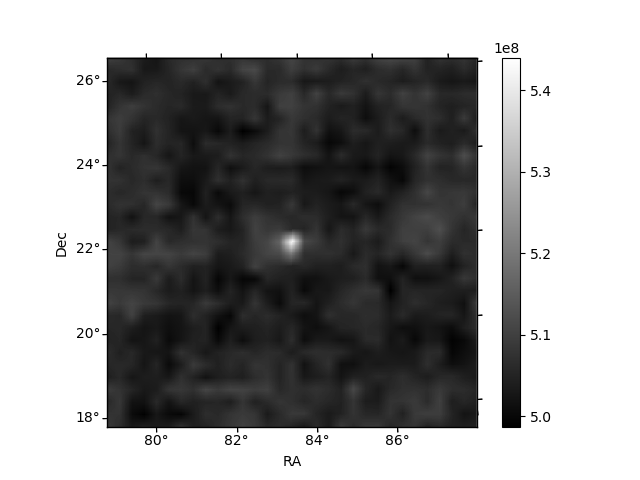
| Plot type | Count rate plots | Images |
|---|---|---|
| Comparison with Poisson distribution Blue bars denote a histogram of data divided into 1 sec bins. Red curve is a Poisson curve with rate = median count rate of data. |
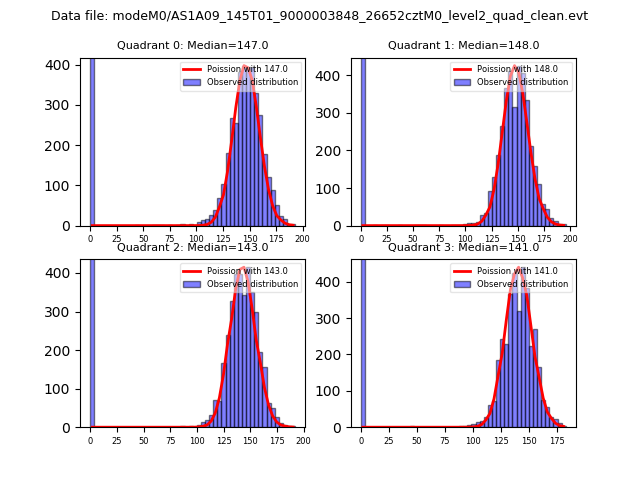 |
 |
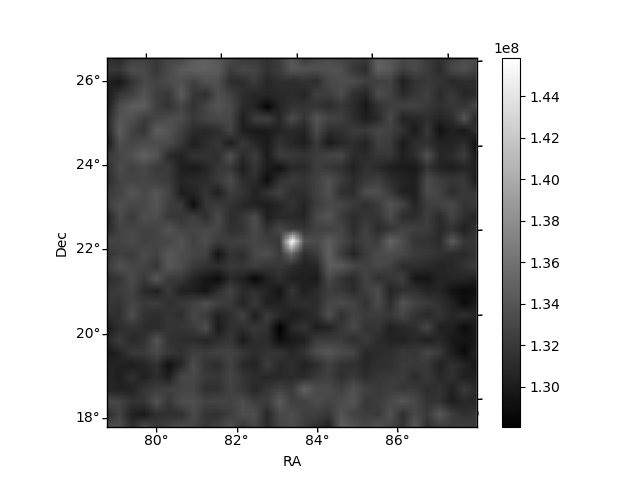
| Quadrant-wise count rates Data is divided into 100 sec bins |
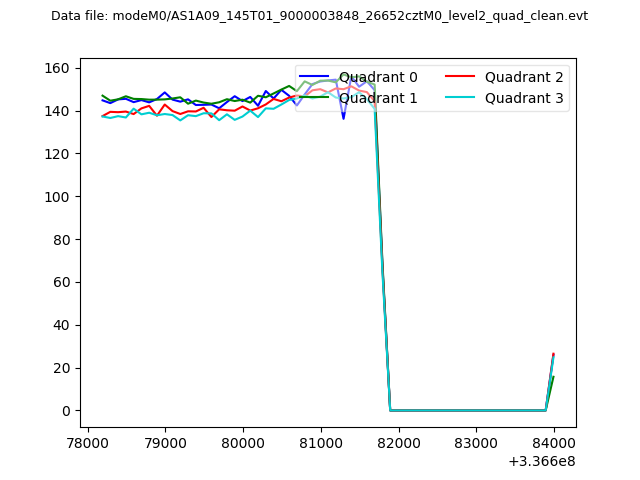 |
|
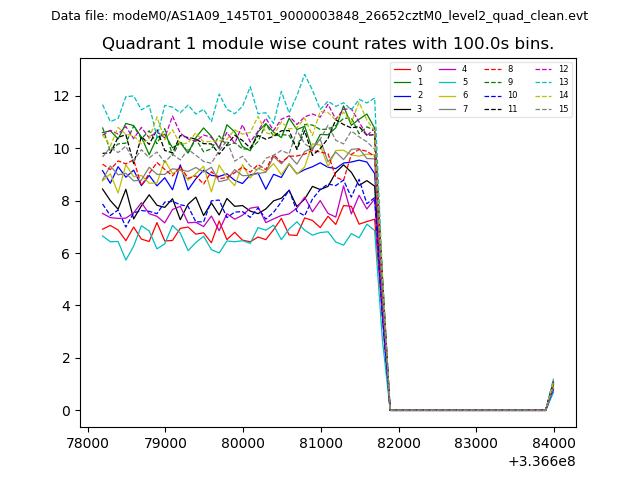
| Module-wise count rates for Quadrant A Data is divided into 100 sec bins |
 |
 |
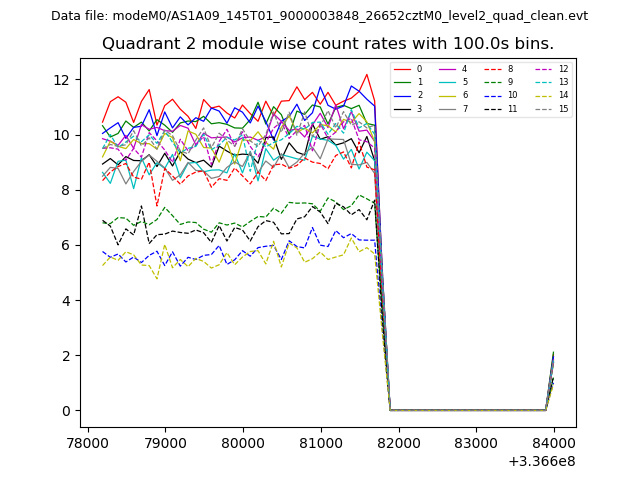
| Module-wise count rates for Quadrant B Data is divided into 100 sec bins |
 |
 |
| Module-wise count rates for Quadrant C Data is divided into 100 sec bins |
 |
 |
| Module-wise count rates for Quadrant D Data is divided into 100 sec bins |
 |
 |
| Parameter | Plot |
|---|---|
| CZT HV Monitor | 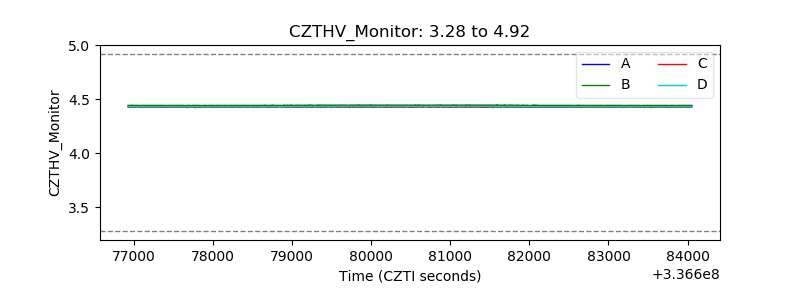 |
| D_VDD | 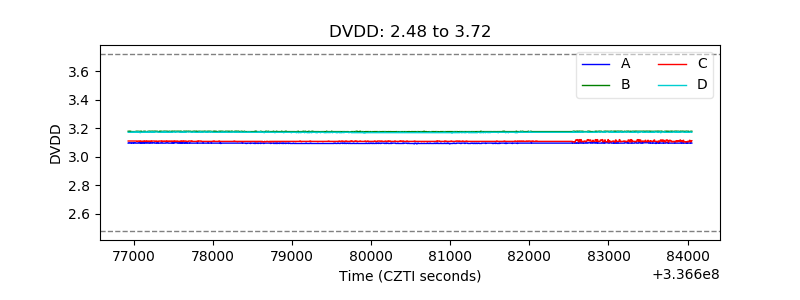 |
| Temperature 1 | 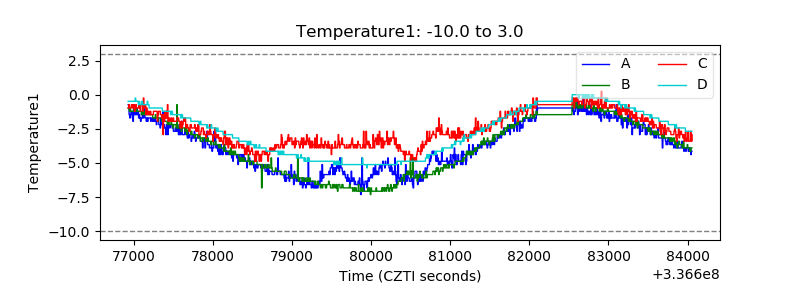 |
| Veto HV Monitor | 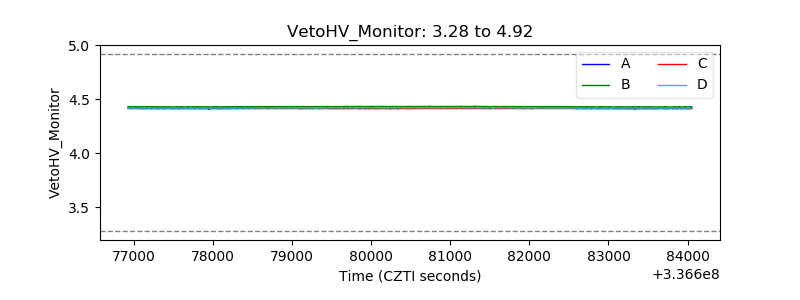 |
| Veto LLD | 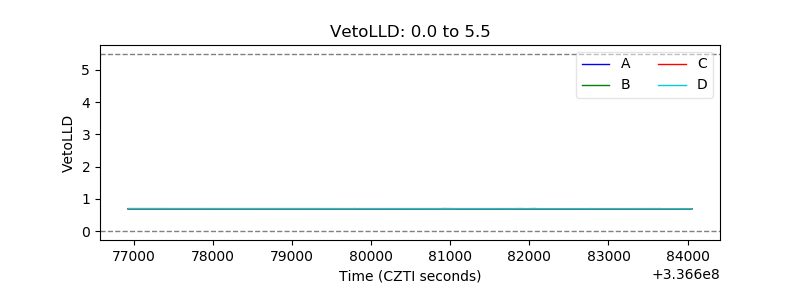 |
| Alpha Counter | 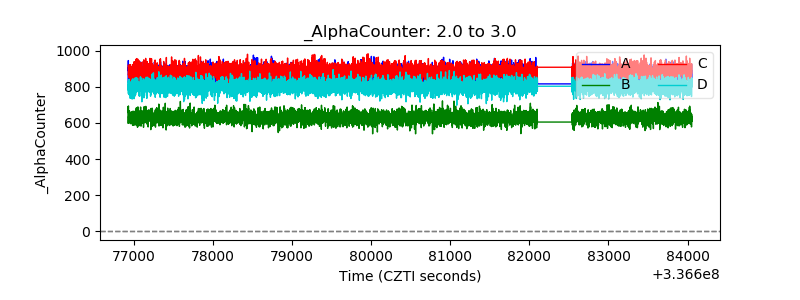 |
| _CPM_Rate | 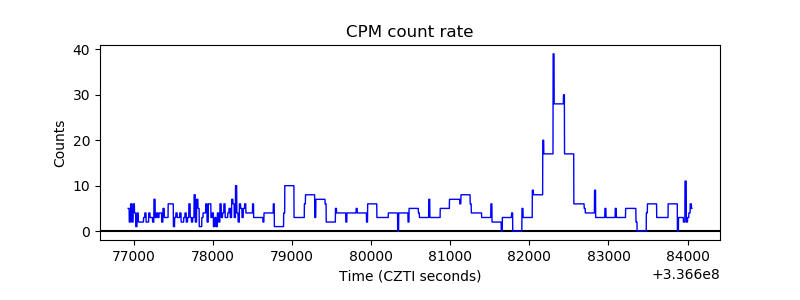 |
| CZT Counter | 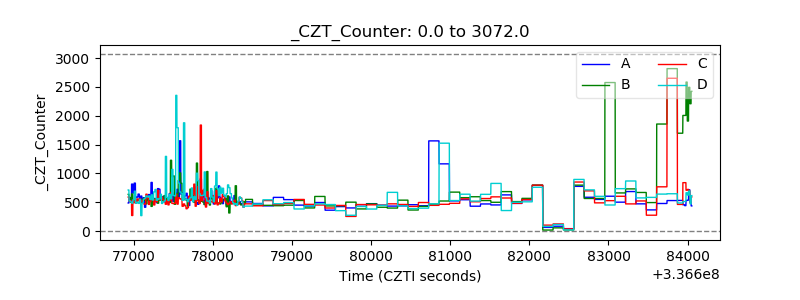 |
| +2.5 Volts monitor |  |
| +5 Volts monitor |  |
| _ROLL_ROT | 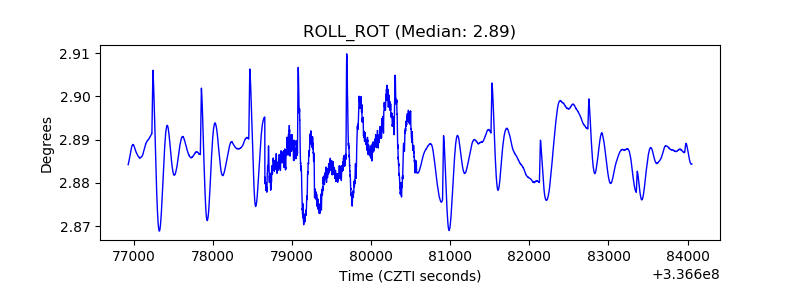 |
| _Roll_DEC | 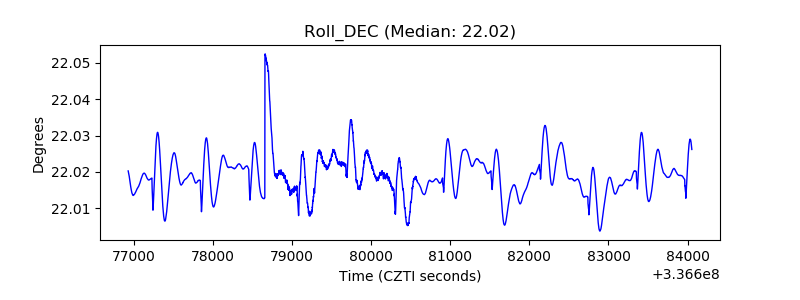 |
| _Roll_RA | 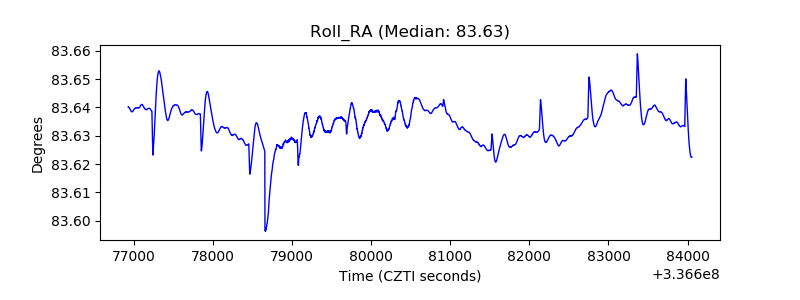 |
| Veto Counter | 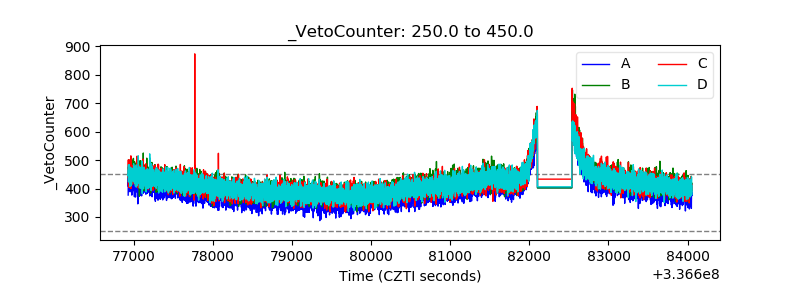 |