| Param | Original file | Final file |
|---|---|---|
| Filename | modeM0/AS1A09_145T01_9000003848_26653cztM0_level2.evt | modeM0/AS1A09_145T01_9000003848_26653cztM0_level2_quad_clean.evt |
| Size (bytes) | 672,209,280 | 91,903,680 |
| Size | 641.1 MB | 87.6 MB |
| Events in quadrant A | 3,732,494 | 596,761 |
| Events in quadrant B | 5,976,428 | 571,122 |
| Events in quadrant C | 3,974,350 | 574,176 |
| Events in quadrant D | 6,181,156 | 533,444 |
| Mode M0 | |||
|---|---|---|---|
| Quadrant | BADHDUFLAG | Total packets | Discarded packets |
| A | 0 | 15481 | 0 |
| B | 0 | 22529 | 0 |
| C | 0 | 16191 | 0 |
| D | 0 | 23419 | 0 |
| Mode M9 | |||
|---|---|---|---|
| Quadrant | BADHDUFLAG | Total packets | Discarded packets |
| A | 0 | 3 | 0 |
| B | 0 | 3 | 0 |
| C | 0 | 3 | 0 |
| D | 0 | 3 | 0 |
| Quadrant | Total seconds | Saturated seconds | Saturation percentage |
|---|---|---|---|
| A | 7286 | 61 | 0.837222% |
| B | 7286 | 842 | 11.556410% |
| C | 7286 | 203 | 2.786165% |
| D | 7286 | 941 | 12.915180% |
Noise dominated data is calculated using 1-second bins in cleaned event files. If a bin has >2000 counts, and if more than 50% of those come from <1% of pixels, then it is considered to be noise-dominated and hence unusable.
| Quadrant | # 1 sec bins | Bins with >0 counts | Bins with >2000 counts | High rate bins dominated by noise | Noise dominated (total time) | Noise dominated (detector-on time) | Marked lightcurve |
|---|---|---|---|---|---|---|---|
| A | 7611 | 7289 | 0 | 0 | 0.00% | 0.00% | 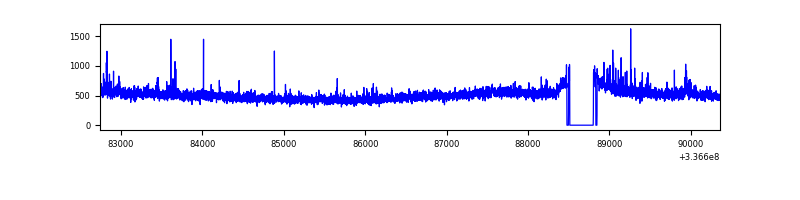 |
| B | 7611 | 7289 | 540 | 540 | 7.09% | 7.41% | 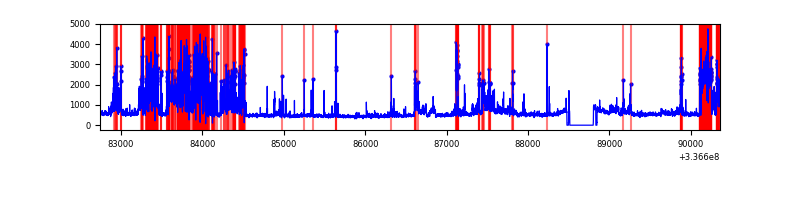 |
| C | 7611 | 7289 | 56 | 56 | 0.74% | 0.77% | 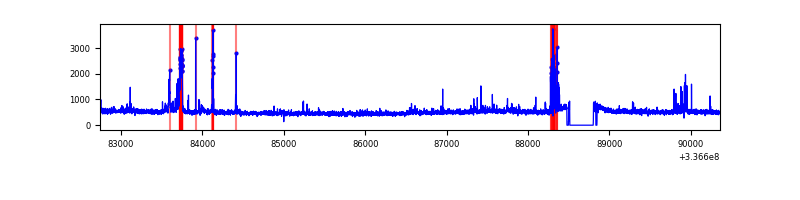 |
| D | 7611 | 7289 | 727 | 727 | 9.55% | 9.97% | 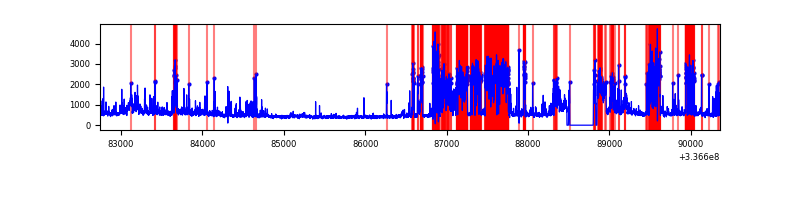 |
Top three noisy pixels from each quadrant. If the there are fewer than three noisy pixels in the level2.evt file, extra rows are filled as -1
| Pixel properties | Quadrant properties | ||||||
|---|---|---|---|---|---|---|---|
| Quadrant | DetID | PixID | Counts | Sigma | Mean | Median | Sigma |
| A | 0 | 13 | 153142 | 808.08 | 924 | 906 | 188.4 |
| A | 13 | 254 | 12615 | 62.15 | 924 | 906 | 188.4 |
| A | 3 | 137 | 8525 | 40.44 | 924 | 906 | 188.4 |
| B | 10 | 245 | 2493875 | 15040.22 | 869 | 850 | 165.8 |
| B | 3 | 112 | 39452 | 232.88 | 869 | 850 | 165.8 |
| B | 12 | 111 | 19309 | 111.36 | 869 | 850 | 165.8 |
| C | 2 | 16 | 209855 | 1010.8 | 877 | 884 | 206.7 |
| C | 14 | 238 | 140060 | 673.2 | 877 | 884 | 206.7 |
| C | 15 | 208 | 133371 | 640.85 | 877 | 884 | 206.7 |
| D | 1 | 52 | 1798878 | 8001.13 | 842 | 823 | 224.7 |
| D | 7 | 80 | 644796 | 2865.6 | 842 | 823 | 224.7 |
| D | 12 | 233 | 190882 | 845.74 | 842 | 823 | 224.7 |
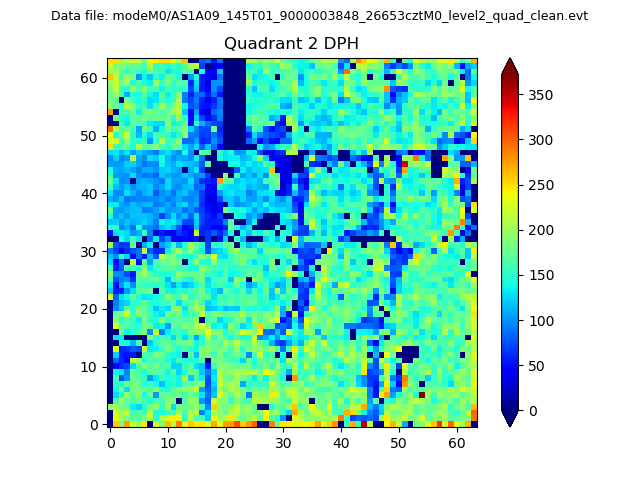
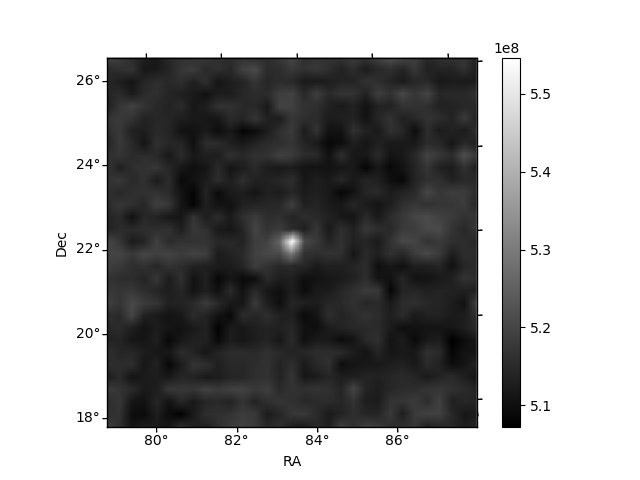
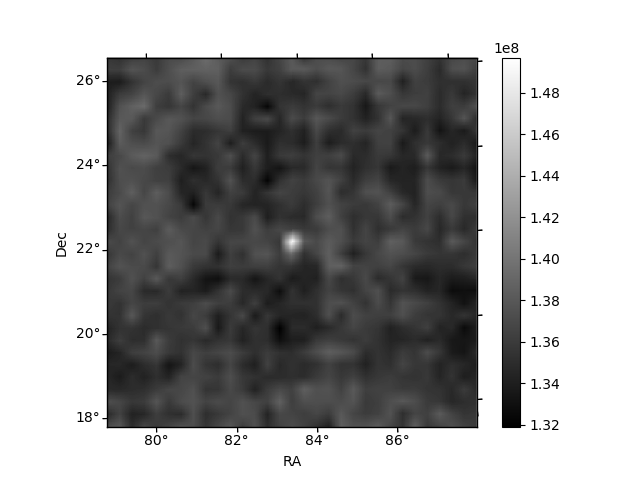
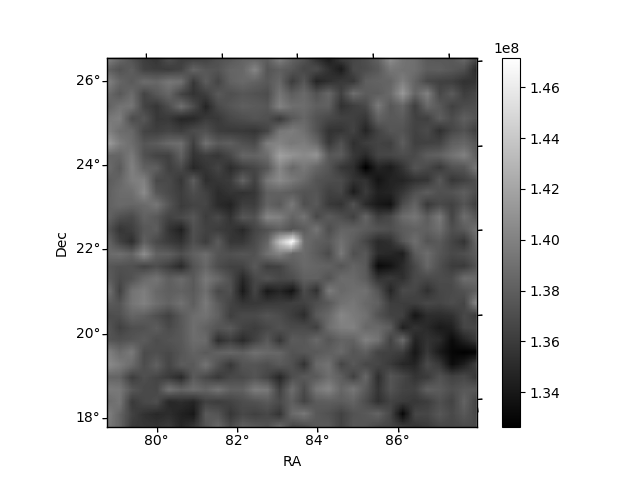
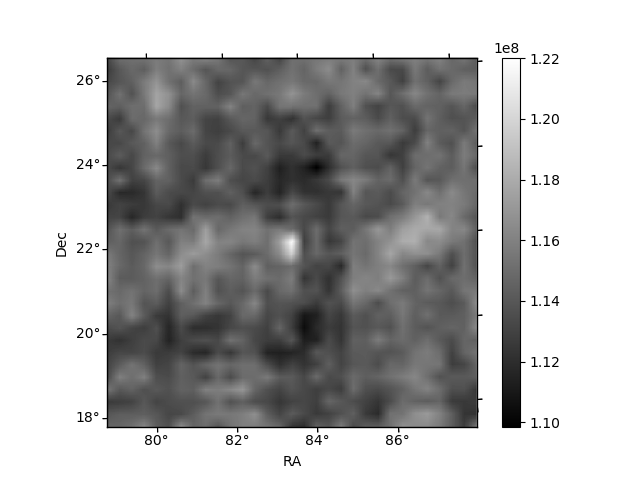
Histogram calculated using DETX and DETY for each event in the final _common_clean file
| Quadrant A | 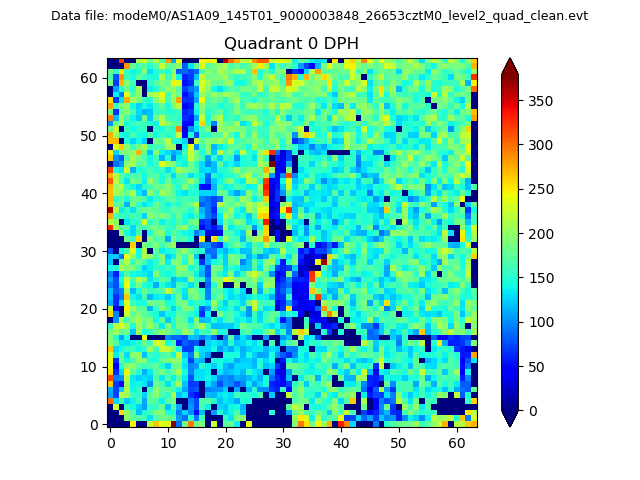 |
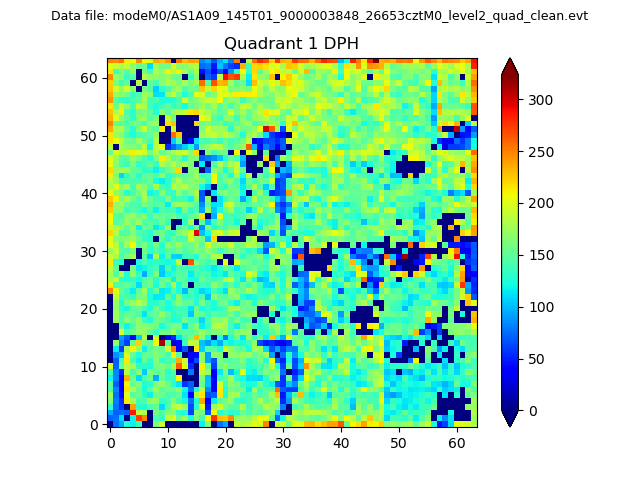 |
Quadrant B |
|---|---|---|---|
| Quadrant D | 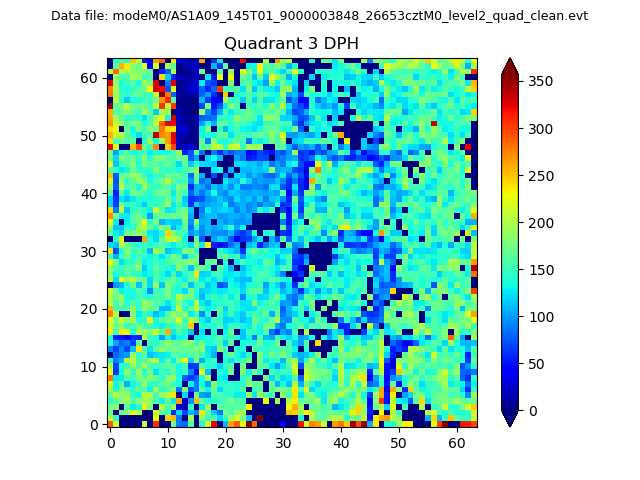 |
 |
Quadrant C |
| Plot type | Count rate plots | Images |
|---|---|---|
| Comparison with Poisson distribution Blue bars denote a histogram of data divided into 1 sec bins. Red curve is a Poisson curve with rate = median count rate of data. |
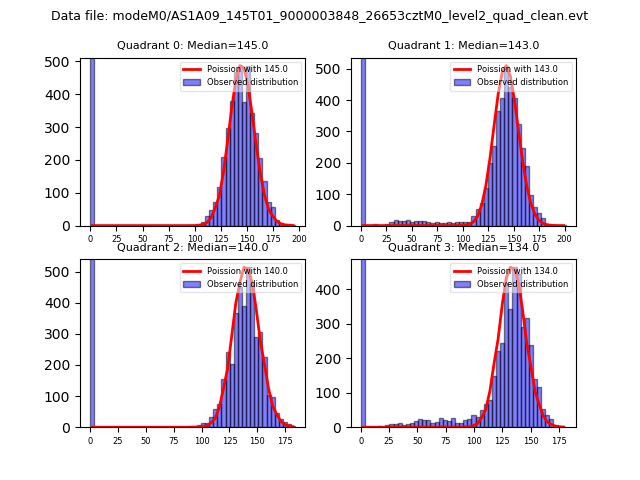 |
 |
| Quadrant-wise count rates Data is divided into 100 sec bins |
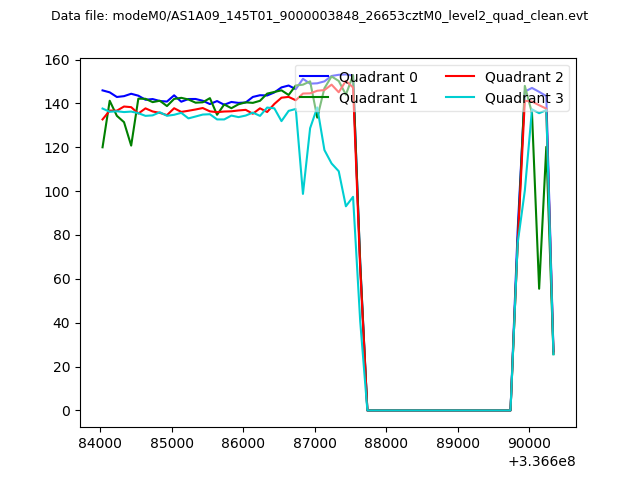 |
|
| Module-wise count rates for Quadrant A Data is divided into 100 sec bins |
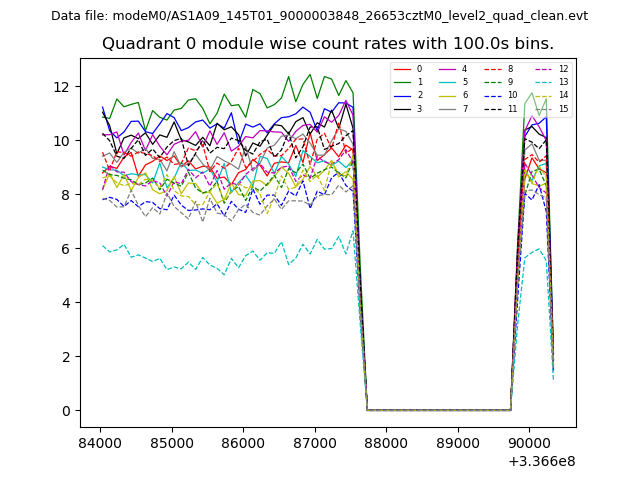 |
 |
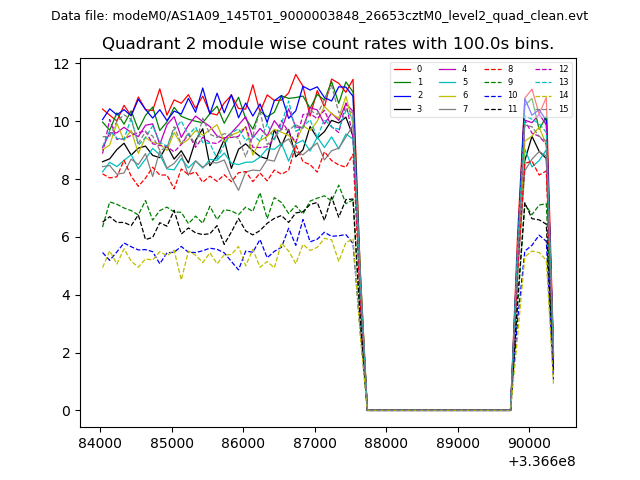
| Module-wise count rates for Quadrant B Data is divided into 100 sec bins |
 |
 |
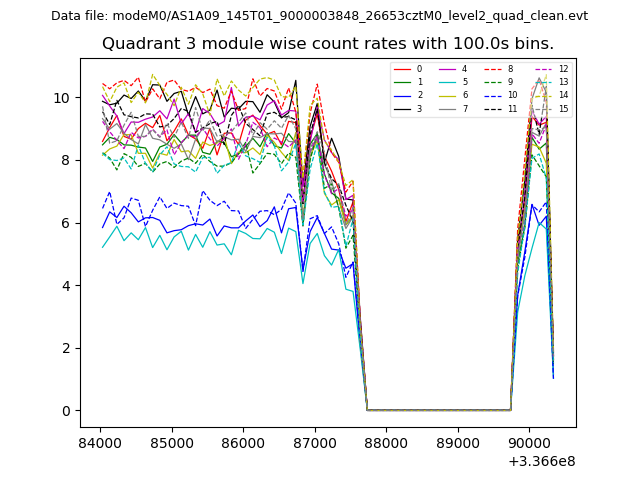
| Module-wise count rates for Quadrant C Data is divided into 100 sec bins |
 |
 |
| Module-wise count rates for Quadrant D Data is divided into 100 sec bins |
 |
 |
| Parameter | Plot |
|---|---|
| CZT HV Monitor | 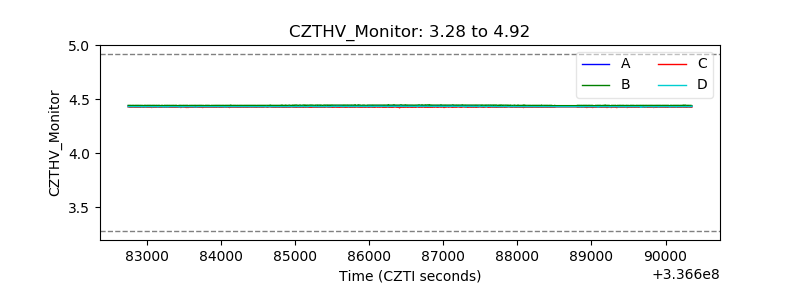 |
| D_VDD | 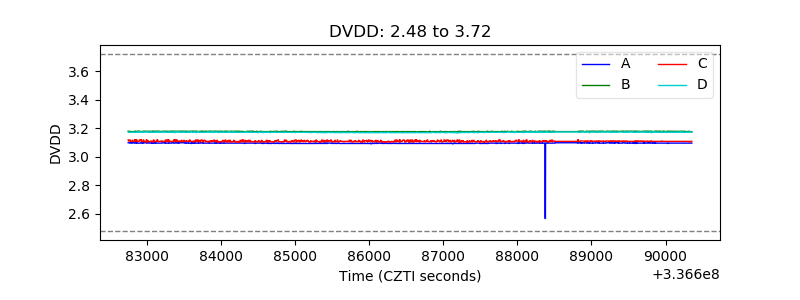 |
| Temperature 1 | 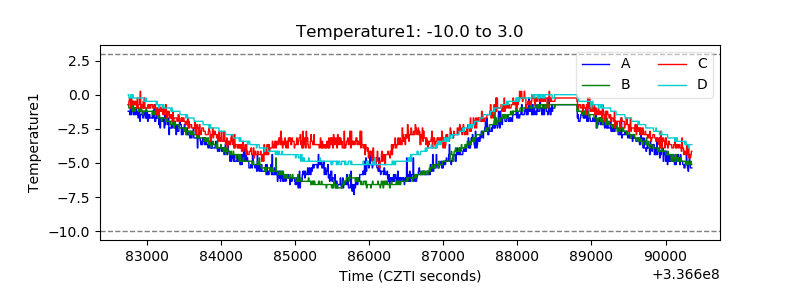 |
| Veto HV Monitor | 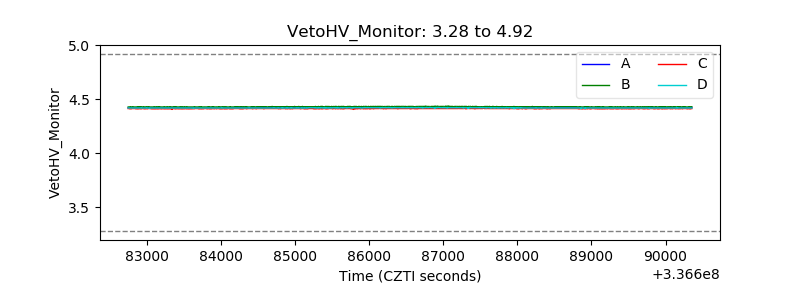 |
| Veto LLD | 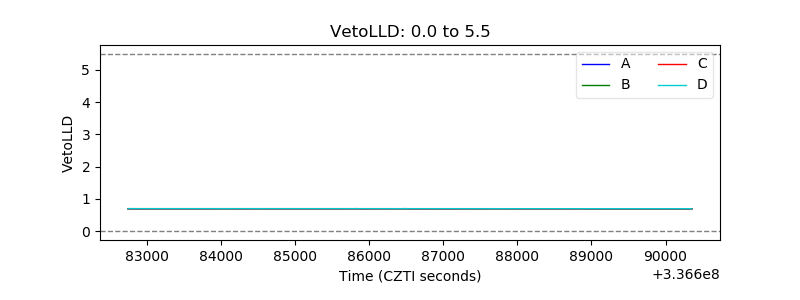 |
| Alpha Counter | 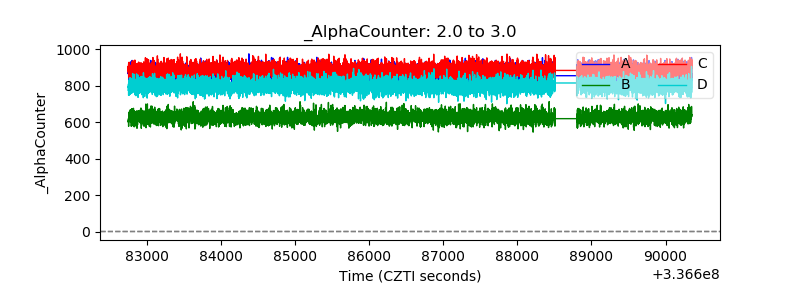 |
| _CPM_Rate | 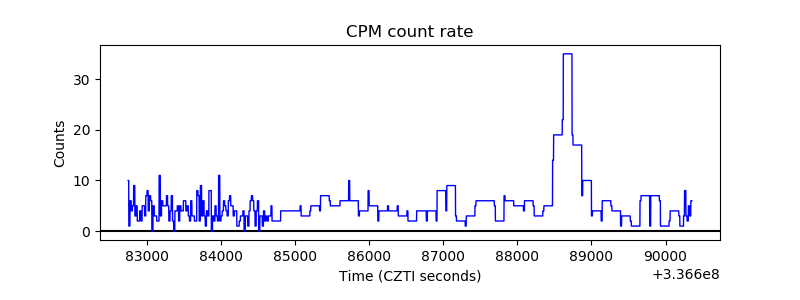 |
| CZT Counter | 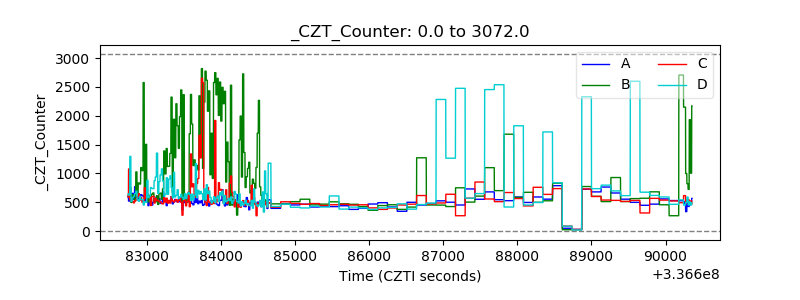 |
| +2.5 Volts monitor |  |
| +5 Volts monitor |  |
| _ROLL_ROT | 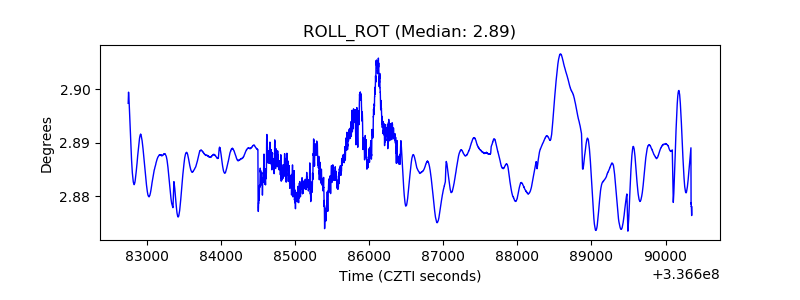 |
| _Roll_DEC | 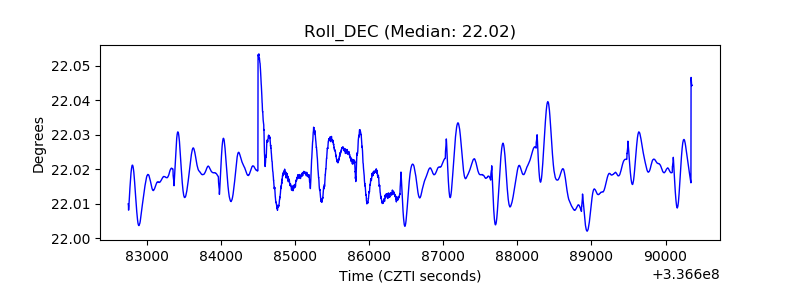 |
| _Roll_RA | 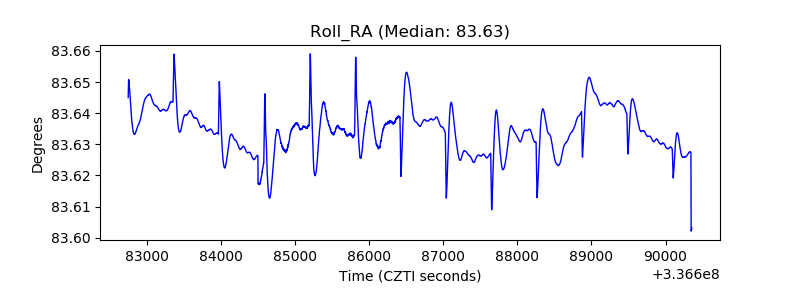 |
| Veto Counter | 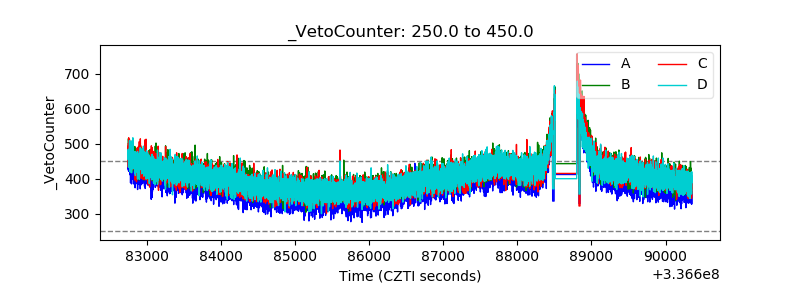 |